Article Text

Abstract
Introduction To examine the effects of tap dance (TD) on dynamic plantar pressure, static postural stability, ankle range of motion (ROM), and lower extremity functional strength in patients at risk of diabetic foot (DF).
Research design and methods A randomised, single-blinded, two-arm prospective study of 40 patients at risk of DF was conducted. The intervention group (n=20) received 16 weeks of TD training (60 min/session×3 sessions/week). The control group attended four educational workshops (1 hour/session×1 session/month). Plantar pressure, represented by the primary outcomes of peak pressure (PP) and pressure-time integral (PTI) over 10 areas on each foot, was measured using the Footscan platform system. Secondary outcomes comprised static postural stability, ankle ROM and lower extremity functional strength.
Results Reductions in intervention group PP (right foot: mean differences=4.50~27.1, decrease%=25.6~72.0; left foot: mean differences=−5.90~6.33, decrease%=−22.6~53.2) and PTI at 10 areas of each foot (right foot: mean differences=1.00~12.5, decrease%=10.4~63.6; left foot: mean differences=0.590~25.3, decrease%=21.9~72.6) were observed. Substantial PP and PTI differences were noted at the second through fourth metatarsals, medial heel and lateral heel in the right foot. Substantial PP and PTI differences were detected at metatarsals 1 and 2 and metatarsal 2 in the left foot, respectively. Moderate training effects were found in plantar flexion ROM of both feet, lower extremity functional strength, and length of center-of-pressure trajectory with eyes closed and open (r=0.321–0.376, p<0.05).
Conclusions A 16-week TD training program can significantly improve ankle ROM, lower extremity functional strength, and static postural stability. To attain greater improvements in plantar pressure, a longer training period is necessary.
Trial registration number ChiCTR1800014714.
- diabetic foot
- exercise
This is an open access article distributed in accordance with the Creative Commons Attribution Non Commercial (CC BY-NC 4.0) license, which permits others to distribute, remix, adapt, build upon this work non-commercially, and license their derivative works on different terms, provided the original work is properly cited, appropriate credit is given, any changes made indicated, and the use is non-commercial. See: http://creativecommons.org/licenses/by-nc/4.0/.
Statistics from Altmetric.com
Significance of this study
What is already known about this subject?
Elevated plantar pressure is a valid risk assessment indicator for diabetic foot ulceration.
What are the new findings?
A 16-week tap dance program can reduce plantar pressure and significantly improve ankle range of motion, lower extremity functional strength, and static postural stability. Moreover, a longer training period is warranted to attain significant improvements in plantar pressure.
How might these results change the focus of research or clinical practice?
Tap dance, as a form of weight-bearing exercise that provides constant stimulation to plantar surface and focuses on ankle and foot movements, deserves further study to examine its effectiveness in the prevention of diabetes and its complications.
The present results confirmed the positive adaptations of plantar pressure to overload stress.
Introduction
Diabetic foot (DF) is a common diabetic complication,1 and has an adverse effect on physical functionality and quality of life.2 Approximately 6.3% of patients with diabetes worldwide have DF,3 and almost a quarter have lifelong foot ulcers.4 Beyond pain, falls and amputation are two typical outcomes in diabetes with DF, and their risks are increased during the disease course. Given the increasing global prevalence of diabetes, early prevention of DF is of tremendous importance to patients at risk of DF. Management of DF prioritizes early prevention because of its high burden and healing difficulty.5 6
Results from related observational studies demonstrated that people with or at risk of DF would show abnormal lower limb biomechanical characteristics, such as reduced range of movement (ROM) of joints, delayed muscle activations, altered forces in the foot, and changes in gait mechanics.7 These biomechanical changes may finally cause elevated plantar pressure during gait and promote the development of diabetic foot ulcerations (DFUs). Accumulated evidence has demonstrated that the elevated plantar pressure is a valid risk assessment indicator for DFUs,8 and even continuous plantar pressure monitoring can help reduce the risk of DFU recurrence.9 Relieving plantar pressure in daily activity through the use of therapeutic footwear is highly recommended for the prevention and healing of DFUs.10 However, an emerging body of research has identified positive adaptations to overload stress,11 and some researchers have been calling to shift the paradigm by including weight-bearing exercise for people with diabetic peripheral neuropathy (DPN).12
To date, exercise has been well evidenced in improving glycemic control,13 14 vascular structure and function of the lower limbs,14 and peripheral nerve function.15 This indicates the efficacy of exercise interventions in preventing DFUs.5 16 However, no consensus has been reached on the most effective exercise prescription,17 18 although a recent meta-analysis reported the priority of combined exercise against either aerobic or resistance training alone.5 A common problem that exists in the related intervention studies is the absent report of rationale for exercise intervention.5 16 Since ankle and foot biomechanics are generally altered in patients with diabetes regardless of the presence of neuropathy,19 a specific exercise for ankle and feet may be more appropriate in the prevention and treatment of DF complications.20 This is in agreement with the updated guidelines on exercise and diabetes proposed by the American Diabetes Association (ADA).21 The ADA has put a greater focus on the inclusion of flexibility exercise and balance training to increase joint ROM, enhance joint mobility and balance.
Tap dance (TD) is an indigenous American art form and wooden or tap shoes are used to create rhythmic sounds and patterns by striking the tap or sole against the floor.22 Such an exercise form provides load and continuous stimulation to the plantar surface by strengthening ankle and foot movements. Compared with practitioners of other sports or dance forms, tap dancers have a lower injury rate.23 Biomechanical analysis has demonstrated smaller ground reaction and joint forces in the percussive footwork of TD.24 In addition, similar physiological responses (ie, oxygen uptake, respiratory exchange rate, and heart rate) were found between TD and graded exercise, indicating that the TD would be a useful exercise modality for aerobic fitness and cardiovascular health improvement.25 Biricocchi et al conducted a case study and found that TD as an intervention form would enhance static and dynamic balance for a child with type 1 congenital myotonic muscular dystrophy.26 Despite these promising indications for the potential benefits of TD on reducing risk factors of DF, few relevant studies have been conducted. Thus, this study aimed to examine the effects of TD on dynamic plantar pressure, static postural stability, ankle ROM, and lower extremity functional strength in older patients at risk of DF.
Methods
Study design
This randomized, single-blinded, two-arm prospective study was conducted in Nanjing, China according to Good Clinical Practice, an international standard for clinical trials, and the Consolidated Standards of Reporting Trials statement. It was prospectively registered in the Chinese Clinical Trial Registry.
Participants
Participants were recruited from a local, regional hospital during the annual physical examination period (March–May 2018). The inclusion criteria were as follows: (1) community dwellers aged between 60 and 70 years, (2) diagnosed as having had type II diabetes mellitus for more than 3 years, and (3) having no apparent foot ulceration or lesion (International Working Group on the Diabetic Foot risk 1).27 Participants were excluded if they had active DPN symptoms, diagnosis of major vascular complications, excessively high or low foot arches, or limitations in daily exercise. Two authors and clinicians from the physical examination center of the hospital performed the inclusion and exclusion assessments. This study was conducted in the fitness room of a regional hospital between June and September 2018.
Sample size
The sample size was calculated on the basis of previous studies on the effects of foot and/or ankle exercise programs on plantar pressure.28 29 A moderate effect size (f=0.25) was used to estimate sample size. Given a potential 20% dropout rate and additional variations, a sample size of 40 participants was necessary to ensure 80% power to detect treatment differences at a two-sided 5% significance level.
Randomization and allocation
Qualified participants who had signed a consent form were randomly allocated to the intervention and control (CON) groups through drawing of lots at a 1:1 ratio. A student assistant not involved in any other study procedures performed the allocation.
Intervention
The intervention group underwent a 16-week TD program involving 14 ankle and foot movements and 8 movement combinations. Details about the design process and other relevant information regarding the program have been published elsewhere.30 Participants in the CON group attended four educational workshops on preventing DFUs in daily life (1 hour/session, 1 session/month). All participants were instructed to follow their usual lifestyle and avoid intentionally changing their drug regimens or daily physical activity level during the study period.
The exercise dosage was set as 60 min/session×3 sessions/week. Each training session comprised five phases: a (1) 10-minute warm-up, (2) 20-minute first training session, (3) 5-minute break, (4) 20-minute second training session, and (5) 5-minute cool down. At the end of each phase, self-perceived exercise intensity was recorded using the Chinese version of the Rating of Perceived Exertion (RPE) scale.31 The intensities ranged from light (RPE 11) to somewhat hard (RPE 13).
Outcome measures
A certified nurse from the local hospital provided the tests for blood biochemistry and other vital signs, which were used to elaborate on the demographic information of participants. Two research assistants with backgrounds in exercise medicine and blinded to group assignment conducted the assessments at baseline (0 week) and at the end of the intervention (ie, the 16th week).
Plantar pressure representing the maximal load in an area under the foot was measured using the Footscan platform system (RSscan International, Olen, Belgium). Before each test, participant weight and foot size were entered to calibrate the system. All participants had been given explicit instructions about the test protocols and had been permitted to stand or walk on the platform to familiarize themselves with the system before the test. During the trials, participants were asked to look straight ahead and walk barefoot at their usual walking speed. Each participant walked five steps in a straight line, and only the third step on the plate was measured for plantar pressure. Data were recorded using Scientific Footscan software (RSscan International), which divided each foot into 10 masked sites: toe 1 (T1), toes 2–5 (T2–5), the first to fifth metatarsals (M1, M2, M3, M4, and M5), the middle foot (MF), the lateral heel (HL), and the medial heel (HM). The primary outcomes were peak pressure (PP; N/cm2) and pressure-time integral (PTI; Ns/cm2). The PTI represents the cumulative effect of pressure over time in a certain area of the foot.
Static postural stability was tested using the Footscan platform system, and outcome data were recorded using Footscan V.7.7 Balance 2nd Generation (RSscan International) software. Participants were instructed to stand still on the plate in a natural position with their feet shoulder-width apart and hands by their sides under two conditions: eyes open and eyes closed. Each test lasted 30 s. A research assistant stood by during the process to assist participants in case of falls. Foot position was standardised among all tests using the usual stance width. Data on the trajectory of the center of pressure (COP; mm) and the elliptical area (EA; mm2) were recorded.
The active ankle ROM, comprising dorsiflexion and plantar flexion measures, was evaluated using a manual goniometer. Participants were seated in a chair with feet flat on another chair of the same height. The lateral malleolus served as the fulcrum. The bottom rod of the goniometer and the other arm were placed parallel with the fibula and the longitudinal axis of the fifth metatarsal, respectively. Participants were tested three times, and the best scores for each foot were recorded.
Lower extremity functional strength was measured using the Five Times Sit to Stand Test (FTSST).32 Each participant had one practice trial before the formal test. Participants were seated with their arms folded across their chests and their backs against the chair, which was 43 cm tall. They were then asked to stand five times from a sitting position as quickly as possible. Timing began at the ‘Go’ signal and ended when the buttocks touched the chair. The time taken to complete the FTSST was the outcome of interest.
Statistical methods
Demographic and clinical data are presented as means and SDs or as numbers and percentages. For the primary outcomes, the one-way multivariate analysis of variance (MANOVA) and one-way repeated measures MANOVA were used to evaluate group and time effects on PP and PTI, respectively. A series of ANOVA tests were then performed to assess group and time effects on each test parameter. Bonferroni corrections were applied to pairwise comparisons to control for type I error. The two-tailed Student’s t-test for paired and unpaired data was used to compare within-group and between-group differences in the secondary outcomes (ie, postural stability, ankle ROM, and FTSST). The effect size r was calculated manually using the equation r=sqrt[t2/(t2+df)]. According to Cohen, r values of 0.10, 0.30, and 0.50 represent small, medium, and large effect sizes, respectively.33 The significance level was set at p<0.05. All data were analysed using IBM SPSS Statistics for Windows, V.24 (IBM Corp).
Results
Participant flow
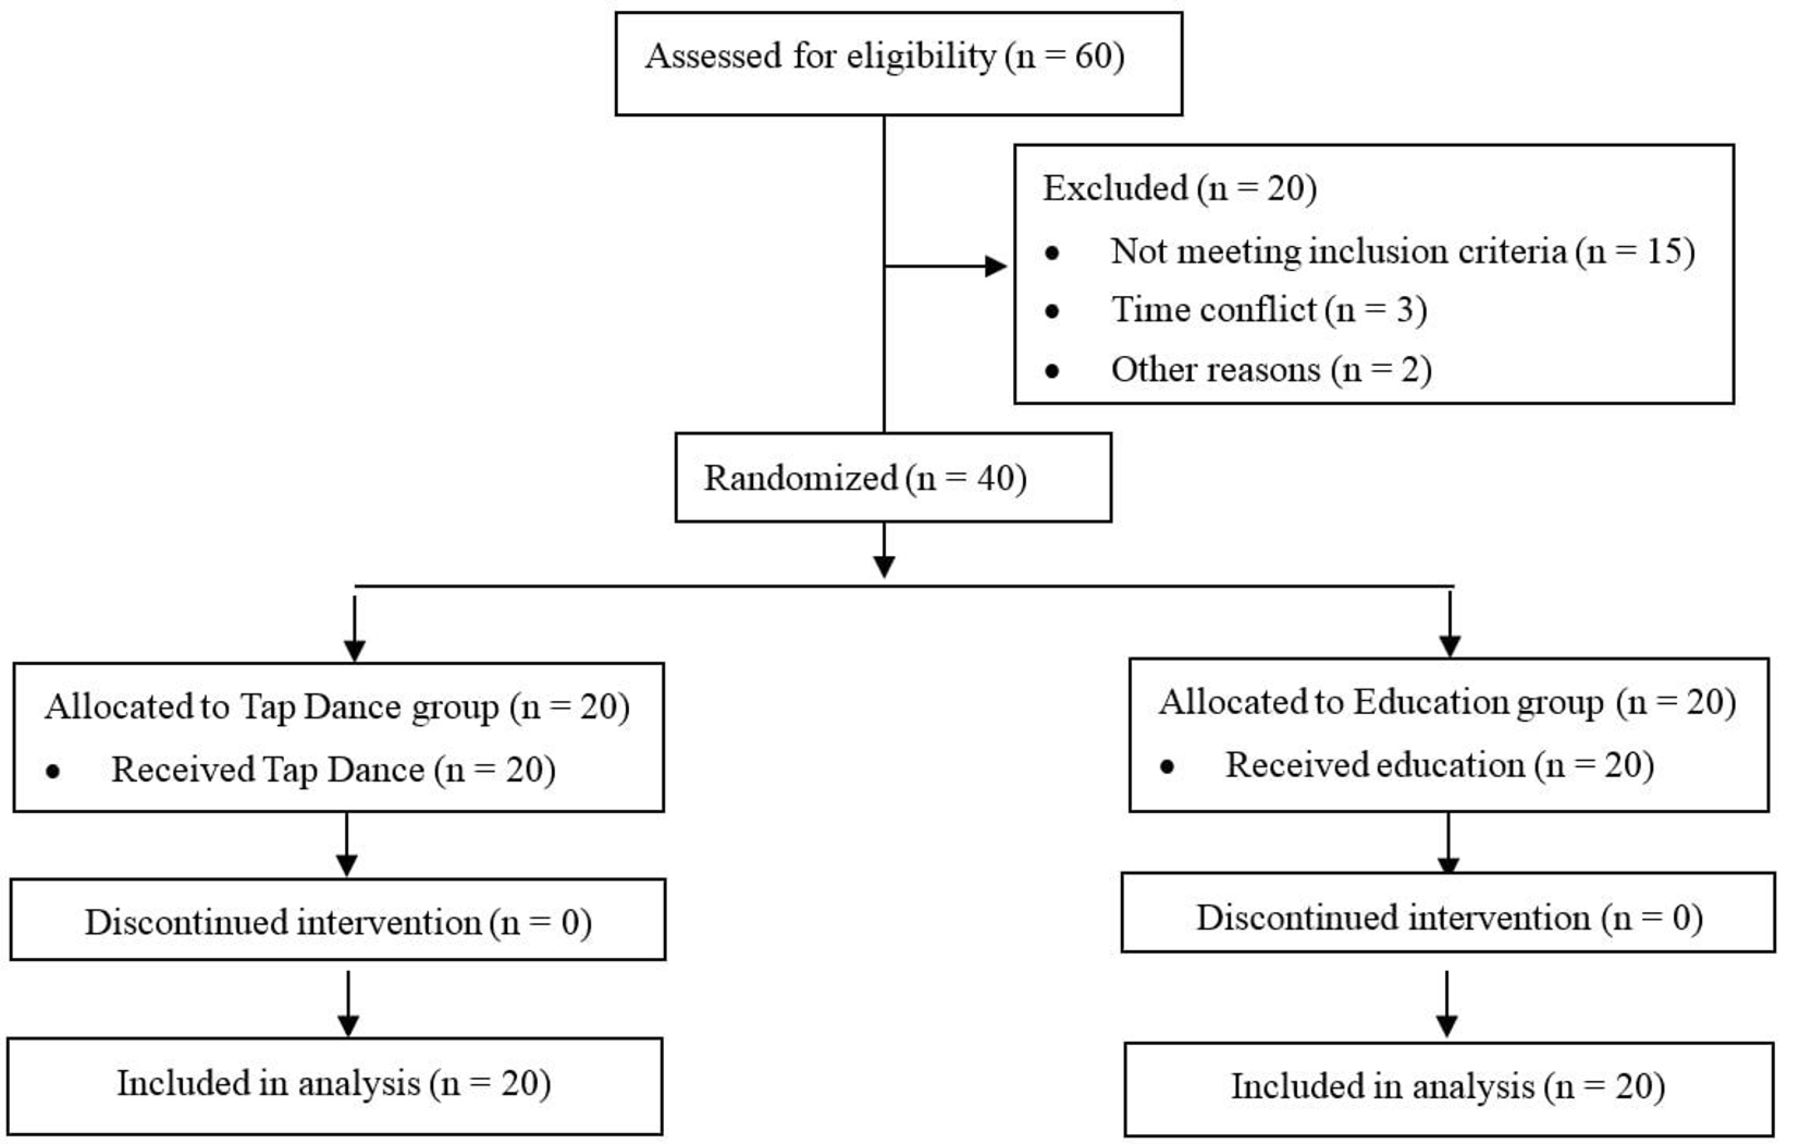
Of the 60 older adults recruited and screened for eligibility, 20 were excluded, primarily because of the apparent foot or joint deformity, physical frailty, or time conflict with the training schedule. The remaining 40 were randomly assigned to TD (n=20) and CON (n=20) groups. None dropped out during the intervention period (figure 1). The average attendance rate for both groups was over 93%. In addition, no adverse effects were reported during the intervention period.
Participants’ flow.
Baseline data
Table 1 presents the demographic and clinical characteristics of the participants, for which no significant between-group differences were found.
Baseline demographic and clinical characteristics
Changes in plantar pressure distribution
PP and PTI distribution
The mean values (table 2) indicated generally higher PP and PTI values at the M2, M3, M4, HM, and HL. The forefoot-to-rearfoot ratio (F/R ratio), calculated as the maximum PP at the forefoot (T1+T2−3+M1−5) by the maximum PP at the rearfoot (MF+HM+HL), decreased from 2.02 to 1.95 and from 2.83 to 2.11 for the right foot and left foot, respectively.
Within-group and between-group comparisons in subplantar pressure values
Main effects of time and group on PP of the right foot
Although PP of the right foot demonstrated no significant time effects, F (10, 7)=2.69, p=0.101, partial η2=0.794, reductions across each of the 10 areas were found in the TD group (mean differences=4.50–27.1, decrease%=25.6–72.0). At post-test, significant reductions at M2 (mean differences=13.2, decrease%=33.9, p=0.028), M3 (mean differences=27.1, decrease%=54.5, p=0.001), M4 (mean differences=23.3, decrease%=55.2, p=0.007), HM (mean differences=18.3, decrease%=44.6, p=0.006), and HL (mean differences=16.8, decrease%=43.0, p=0.037) were observed. No statistically significant reductions in overall PP and PP of any foot areas in the CON group were noted. Although there were no significant group differences in the overall PP at post-test, F (10, 27)=1.71, p=0.131, partial η2=0.38, result of the univariate analysis showed significant group differences on M3, t (36)=−3.40, p=0.002, r=0.493 and M4, t (36)=−2.56, p=0.015, r=0.392.
Main effects of time and group on PP of the left foot
No significant time differences in PP in either group were detected. However, both the absolute values and percentages of PP changes were higher in the TD group (mean differences=−3.40~28.2, decrease%=8.90~53.0) than those in the CON group (mean differences=−5.90~6.33, decrease%=−22.6~53.2). Such changes indicate that a longer intervention period is required to realize significant improvements in overall PP of the left foot. The one-way MANOVA revealed significant group effects in overall PP, F (10, 27)=2.26, p=0.045, partial η2=0.456. Moderate, significant group differences were noted at M1, t (36)=−2.02, p=0.049, r=0.319 and M2, t (36)=−2.82, p=0.008, r=0.424.
Main effects of time and group on PTI of the right foot
The one-way repeated measures MANOVA demonstrated no significant time effects differences in PTI in either the TD group, F (10, 7)=2.69, p=0.101, partial η2=0.794, or the CON group, F (10, 6)=0.743, p=0.678, partial η2=0.553. However, PTI reductions were observed in each plantar area of the TD group (mean differences=1.00–12.5, decrease%=10.4~63.6). Pairwise comparisons of the TD group revealed significant PTI reductions at M2 (mean difference=7.56, decrease%=47.0, p=0.028), M3 (mean difference=10.0, decrease%=50.1, p=0.001), M4 (mean difference=6.20, decrease%=31.2, p=0.007), HM (mean difference=24.0, decrease%=69.4, p=0.006), and HL (mean difference=25.3, decrease%=72.6, p=0.037). Results from the MANOVA indicated marginal group differences in PTI at post-test, F (10, 11)=2.40, p=0.054, partial η2=0.685. Pairwise comparisons demonstrated significant group differences at M1, t (31)=−1.36, p=0.008, r=0.238 and M2, t (31)=−3.47, p=0.007, r=0.528.
Main effects of time and group on PTI of the left foot
No significant time effects were found in left foot PTI for either the TD or CON group, although an apparent decreasing trend in all foot areas of the TD group (mean differences=0.590~25.3, decrease%=21.9~72.6) was observed. No significant group effects were found in overall PTI at the post-test, F (10, 16)=2.10, p=0.089, partial η2=0.568. However, pairwise comparisons revealed significant between-group differences in PTI at M2, t (32)=−2.02, p=0.029, r=0.469.
Changes in postural stability, ankle ROM, and lower extremity functional strength
All test parameters as listed in table 3 showed significant improvements after intervention in the TD group (all p<0.01). For the CON group, EA under eyes open and left ankle plantar flexion displayed improvements, while the length of COP trajectory with eyes closed and the time for finishing FTSST were increased, indicating deterioration in static postural stability and lower extremity functional strength. No significant changes in the other parameters between pretest and post-test in the CON group were noted. At post-test, there were moderate group differences in plantar flexion of left foot, t (38)=2.50, p=0.017, r=0.376, and right foot, t (38)=2.32, p=0.026, r=0.352, length of COP trajectory with eyes closed, t (38)=−2.16, p=0.037, r=0.331, EA with eyes open, t (38)=−2.48, p=0.018, r=0.373 and with eyes closed, t (38)=−2.09, p=0.044, r=0.321.
Within-group and between-group comparisons in postural stability, ankle range of motion, and functional lower extremities
Discussion
This retrospective study explored the effect of a TD intervention on plantar pressure, postural stability, and lower body function in patients at risk of DF. The results indicate that PP and PTI were reduced through the intervention and that a longer training period would yield more benefits. Moreover, the program effectively improved static postural stability, ankle ROM, and lower extremity functional strength. All these have tremendous meaning to the early prevention of DFU.
This is the first study examining TD effects on plantar pressure, and the Physical Stress Theory (PST) inspired the selection of an exercise that is mainly executed by feet, ankle, and knees. The PST states that although short-term unloading helps tissues heal, long-term stress protection leads to continual reductions in tolerance for stress and physical activity in general.12 The ADA has changed its position on weight-bearing exercises for individuals with DPN and recommended the inclusion of both weight-bearing and non-weight-bearing exercises in individualized training programs.21 Accumulated evidence supports the premise that individuals with DPN may benefit from overload stress to become more tolerant of subsequent stress.11 TD is not only a weight-bearing exercise but also requires continuously and rhythmically striking the floor with the feet, thereby increasing pressure stimulation to plantar regions. Furthermore, because TD is characterized by smaller ground reaction forces and joint forces,23 it is safe for people with or at risk of DF. The high adherence rate and lack of adverse effects over the intervention period further demonstrated its safety and feasibility among the target population.
Abnormal distribution of plantar pressure is a critical risk factor for DF.34 The reduced F/R ratio after the intervention (left foot: 2.83 vs 2.11; right foot: 2.02 vs 1.95) in the present study indicates the potential efficacy of TD for balancing pressure distribution. However, no inferences of clinical importance can be made from these results because few studies have explored a clinical threshold for F/R ratios. To date, Caselli et al are the only researchers to report that a specific F/R ratio (over 2) is predictive of ulcer development.35 Given the great variabilities in measurements and study populations, a threshold range rather than a definite F/R ratio value would better guide the early prevention of DF. This warrants further investigation.
Non-significant improvements were found in the overall PP or PTI, but a decreasing trend from pretest to post-test suggesting a longer training period would be warranted. In addition, there is great variability in training duration (8 weeks–4 years) among different studies, and no consensus has been reached regarding the optimal exercise prescription for DF prevention. Future studies are suggested to address this issue by including disparities between research and practice.
Based on the mean values of regional PP and PTI at the pretest, there were comparatively higher PP and PTI values in M2–4, HM and HL of the right foot, indicating that they were the main contact areas during the exercise. These areas probably got more stimulations during exercise by striking the tap or sole against the floor. This may explain why they were the sites that exhibited the main improvements in PP and PTI. In the left foot, only PP at M1–2 and PTI at M2 exhibited significant training effects. The asymmetrical plantar pressure changes between left and right feet were unexpected because TD movements are characterized by a high degree of symmetry at the knees and ankles.36 A potential reason would be related to the motor learning differences between left and right lower extremities. From the perspective of motor learning, the preferred dominant limbs usually surpass non-dominant limbs in performance and motor learning rate.37 38 This is echoed by some participants that they found more difficulties when practicing movements executed by the left foot, especially at the initial learning stage.
Our study showed significant improvements in ankle ROM and lower extremity functional strength. Such results are easy to understand since the majority of TD movements mainly lie on ankle joints and lower extremities to complete. Rocha et al biomechanically analyzed three typical TD movements (ie, nerve beats, brush brush stamps, and heel ball walks).36 They found that each step required 10°–66.8° of ankle motion, and that the ankle movement involved greater plantar flexion than dorsiflexion. This may explain why greater post-intervention improvements were demonstrated for plantar flexion than dorsiflexion in the present study. In addition, increases in ankle plantar flexion and lower extremity muscle strength can substantially improve static balance control ability.39 Therefore, it is easy to understand the improved static postural stability in the present study. Considering the close associations between lower body functions and balance ability, the TD would be an effective exercise in preventing falls among people at risk of falling.
Conclusions
In conclusion, as a form of weight-bearing exercise that provides constant stimulation to the plantar surface, TD is safe for patients at risk of DF. A 16-week TD program can significantly improve ankle ROM, lower extremity functional strength, and static postural stability, whereas a longer training period is warranted to attain significant improvements in plantar pressure.
Acknowledgments
This study’s authors would like to thank all the participants for their participation and support. This study’s authors also appreciated the kind help from Miss Aimei Ding and Miss Li Xu in participant recruitment.
References
Footnotes
Contributors YZ—conceptualization, investigation, data curation, writing (original draft), supervision, funding acquisition, and writing (review and editing). KC—participants’ recruitment, investigation, and data curation. QW—exercise program design, test implementation, and writing (review and editing). YH and HG—participants’ recruitment and screening, investigation, intervention, and supervision.
Funding This study was funded by the National Natural Science Foundation of China (no. 81801387) and the Jiangsu Natural Science Foundation of Higher Education Institutions of China (no. 17KJD330001).
Competing interests None declared.
Patient consent for publication Not required.
Ethics approval This study was approved by the Committee on the Use of Human and Animal Subjects in Teaching and Research of Nanjing Normal University (no. 20201201).
Provenance and peer review Not commissioned; externally peer reviewed.
Data availability statement Data are available upon reasonable request.