Article Text

Abstract
Introduction Little is known about the role diabetes (type 1 (T1D) and type 2 (T2D)) plays in modifying prognosis among kidney transplant recipients. Here, we compare mortality among transplant recipients with T1D, T2D and non-diabetes-related end-stage kidney disease (ESKD).
Research design and methods We included 254 188 first-time single kidney transplant recipients aged ≥18 years from the US Renal Data System (2000–2018). Diabetes status, as primary cause of ESKD, was defined using International Classification of Disease 9th and 10th Clinical Modification codes. Multivariable-adjusted Cox regression models (right-censored) computed risk of death associated with T1D and T2D relative to non-diabetes. Trends in standardized mortality ratios (SMRs) (2000–2017), relative to the general US population, were assessed using Joinpoint regression.
Results A total of 72 175 (28.4%) deaths occurred over a median survival time of 14.6 years. 5-year survival probabilities were 88%, 85% and 77% for non-diabetes, T1D and T2D, respectively. In adjusted models, mortality was highest for T1D (HR=1.95, (95% CI: 1.88 to 2.03)) and then T2D (1.65 (1.62 to 1.69)), as compared with non-diabetes. SMRs declined for non-diabetes, T1D, and T2D. However, in 2017, SMRs were 2.38 (2.31 to 2.45), 6.55 (6.07 to 7.06), and 3.82 (3.68 to 3.98), for non-diabetes, T1D and T2D, respectively.
Conclusions In the USA, diabetes type is an important modifier in mortality risk among kidney transplant recipients with highest rates among people with T1D-related ESKD. Development of effective interventions that reduce excess mortality in transplant recipients with diabetes is needed, especially for T1D.
- epidemiology
- diabetes mellitus type 2
- diabetes mellitus type 1
- kidney transplantation
Data availability statement
Data are available in a public, open access repository. The USRDS database is freely available to the public. Therefore, studies conducted under the auspices of the USRDS are exempt from institutional review board approval.
This is an open access article distributed in accordance with the Creative Commons Attribution Non Commercial (CC BY-NC 4.0) license, which permits others to distribute, remix, adapt, build upon this work non-commercially, and license their derivative works on different terms, provided the original work is properly cited, appropriate credit is given, any changes made indicated, and the use is non-commercial. See: http://creativecommons.org/licenses/by-nc/4.0/.
Statistics from Altmetric.com
Significance of this study
What is already known about this subject?
Previous studies indicate that mortality remains approximately two to three times higher in kidney transplant recipients with versus without diabetes. However, contemporary data estimating this excess risk are lacking. In addition, few studies consider the role the two main types of diabetes (type 1 and type 2 (T1D and T2D)) play in modifying prognosis among transplant recipients despite the different disease etiologies, age distributions, and comorbidities in people with T1D versus T2D.
What are the new findings?
Transplant recipients with T1D and T2D-related end-stage kidney disease (ESKD) still have 95% and 65% increased risk for mortality, respectively, as compared with those without diabetes-related ESKD; and this excess risk is not explained by differences in age, graft failure, comorbidities, or donor characteristics.
Age-standardized mortality among transplant recipients has declined since 2000 but remains approximately twofold to more than sixfold higher compared with the general population with highest rates among T1D.
Diabetes type is an important modifier in the prognosis of transplant recipients. Development of effective interventions that reduce excess mortality in transplant recipients with diabetes, especially T1D, is needed.
How might these results change the focus of research or clinical practice?
These results highlight the excess mortality risk experienced by people with T1D and T2D receiving a kidney transplant. Interventions that target glycemia management and cardiovascular risk reduction may be warranted to reduce this disparity in the future.
Introduction
In 2017, more than 700 000 people in the USA were being treated for end-stage kidney disease (ESKD) (ie, kidney failure requiring dialysis or transplantation).1 Diabetes is the main cause of ESKD accounting for 47% of all new ESKD cases in 2016.1 Once diagnosed with ESKD, kidney transplantation is the treatment of choice as it substantially reduces the excess death risk when compared with dialysis.2–4 This is particularly true for people with diabetes due to their poor prognosis remaining on dialysis.4
The survival rates of transplant recipients have steadily improved in the last two decades.1 5 The 2018 US Renal Data System (USRDS) report stated that, in 2015, the probability of survival within 1 year post-transplant was 96% for recipients of deceased donors (DDs) and 99% for recipients of living donors (LDs).1 Kidney graft survival also improved. In 2015, 1-year graft survival rates, censored for death, were 93% for DDs and 98% for LDs.1 These estimates are routinely reported by the USRDS, but do not include important stratifications by diabetes status despite poorer outcomes often reported for people with diabetes.5–9
For example, some data indicate that mortality remains approximately two to three times higher in transplant recipients with versus without diabetes.7–9 While some studies suggest this is due to an increased risk of cardiovascular and infection-related mortality,7 10 11 a higher proportion of comorbidities,7 12 and an older patient population, exploring the excess risk among transplant recipients with diabetes in the long term remains an understudied area of research. This is, in large part, due to the need for large sample sizes, long follow-up times and rich data repositories with information on key risk factors to understand the excess risk associated with diabetes. Further, few studies consider the role the two main types of diabetes (type 1 and type 2 (T1D and T2D)) play in modifying prognosis among transplant recipients despite the different disease etiologies, age distributions, and comorbidities in people with T1D versus T2D.13 14
Therefore, using the USRDS, a national registry of people being treated for ESKD, the primary aim of this study was to provide contemporary survival estimates among US adult kidney transplant recipients with T1D or T2D, as compared with those with no diabetes. Our secondary aims were to examine factors associated with survival in T1D and T2D versus groups without diabetes and to determine trends in mortality rates over time. We hypothesize that: (1) survival among the overall transplant population has improved at a greater rate than the general population; (2) but that disparities by diabetes status (T1D and T2D) remain.
Methodology
Data sources
The USRDS is a national registry of people being treated for ESKD drawn from clinical and claims data reports submitted to the Centers for Medicare and Medicaid Services (CMS).1 All patients with ESKD are eligible for Medicare.15 All adults (≥18 years) receiving a first-time single kidney transplant between 01 January 2000 and 10 August 2018 were included in this study. We excluded patients with missing data on age or sex (N=29), or primary cause of ESKD (N=8674; 3.3%). The final sample size for this study included 254 188 first-time kidney transplant recipients.
Study variables
USRDS includes patient information collected from CMS form 2728 required by law to be completed for each new patient with ESKD at the time of diagnosis. This includes demographic information, some clinical measurements, and comorbidities. To ensure comorbidities reflected time at transplant, we supplemented CMS 2728 data with CMS hospitalization data within 30 days of transplant date using International Classification of Disease 9th and 10th Clinical Modification (ICD-9-CM and ICD-10-CM) diagnosis codes as appropriate (online supplemental table 1). USRDS also includes the date patients were first treated for ESKD and transplant date, and donor characteristics of age, sex, race/ethnicity, cold ischemic time, donor risk level (among DDs defined by Kidney Donor Percentage Index (KDPI) as low risk (KDPI=0–20), moderate risk (KDPI >20–85) or high risk (KDPI >85),16 vs LD), and date of graft failure. Diabetes status (T1D, T2D, non-diabetes) was defined using ICD-9-CM and ICD-10-CM codes according to physician-assigned primary cause of ESKD (online supplemental table 1). The proportion of missing data, by diabetes status, is reported in online supplemental table 2. For all recipient and donor-specific variables, the proportion of missing was <10% and <25%, respectively.
Supplemental material
Mortality ascertainment
Universal reporting of deaths of patients with ESKD as well as date of death is required via CMS form 2746 as a condition of coverage for dialysis units and transplant centers. In addition, mortality ascertainment is augmented by Social Security Death Master File data to the extent allowed by regulation. In this study, death ascertainment was available until 10 August 2018.
Statistical analysis
Differences in characteristics between transplant recipients with T1D, T2D and without diabetes were assessed using Pearson’s χ2 test for proportions, and Student’s t-test for means from approximately normal distributions and Wilcoxon’s rank-sum test for skewed data. We calculated survival probabilities using the Kaplan-Meier method with death as the event, and follow-up time estimated as time from transplant date until date of death or end of study period (10 August 2018), whichever occurred first. Median survival times were estimated from the Kaplan-Meier curves, and differences in survival probabilities between groups were assessed using the log-rank test. For graft survival probabilities, we employed the cumulative incidence competing risk method to account for the competing risk of death.17
Age-standardized mortality rates (ASMRs), by diabetes status, were estimated using the direct method of standardization. We used Cox proportional hazards regression to perform multivariable modeling of survival probabilities adjusted for recipient (age, sex, race/ethnicity, insurance status, ESKD duration prior to transplant, body mass index (BMI), history of smoking, comorbidities, and graft failure) and donor (age, sex, race/ethnicity, donor risk level, and cold ischemic time) characteristics. Cox proportional hazards models of survival probabilities were additionally stratified by graft failure and donor type (DD vs LD), and a sensitivity analysis was performed excluding simultaneous kidney and pancreas transplant recipients (N=13 682, 5.4% of total population). In secondary analyses, graft failure was considered the outcome of interest, censored for death.
Standardized mortality ratios (SMRs) were calculated by comparing year (2000–2017) and age-specific (18–44, 45–64, 65–74, 75+ years) mortality rates between the transplant and general US population, and 95% CIs were calculated using limits for a Poisson-distributed variable. Year and age-specific mortality rates for the general US population were obtained from the Centers for Disease Control and Prevention’s National Center for Health Statistics. An SMR of 1 indicates equivalent mortality risk to the age and year-matched general population. SMRs were calculated for the transplant population stratified by diabetes status. We did not additionally stratify SMRs by graft failure status due to small cell counts when performing multiple stratifications. All statistical analyses were performed using Stata V.16.0 (StataCorp, College Station, Texas, USA).
Joinpoint regression was used to estimate the annual percentage change (APC) in SMRs over time.18 This software uses permutation tests to identify points where linear trends change significantly in either direction or magnitude and calculates the APC for each time period identified. A maximum of two joinpoints were specified and the model included an offset of log-person-years. A p value of <0.05 was established as statistical significance.
Results
Characteristics of the 254 188 first-time single kidney transplant recipients, by diabetes status, are shown in table 1. In brief, people with T2D were more likely to be male, older, non-Hispanic black, Medicare insured, and, in general, have more comorbidities compared with both transplant recipients with T1D and those without diabetes. Transplant recipients without diabetes were more likely to receive a transplant from an LD, and less likely to have a simultaneous kidney and pancreas transplant as compared with T1D and T2D, while recipients with T2D were most likely to receive a high-risk DD organ (KDPI >85).
Characteristics among US transplant recipients at the time of kidney transplant, by primary cause of ESKD
Crude survival of kidney transplant recipients
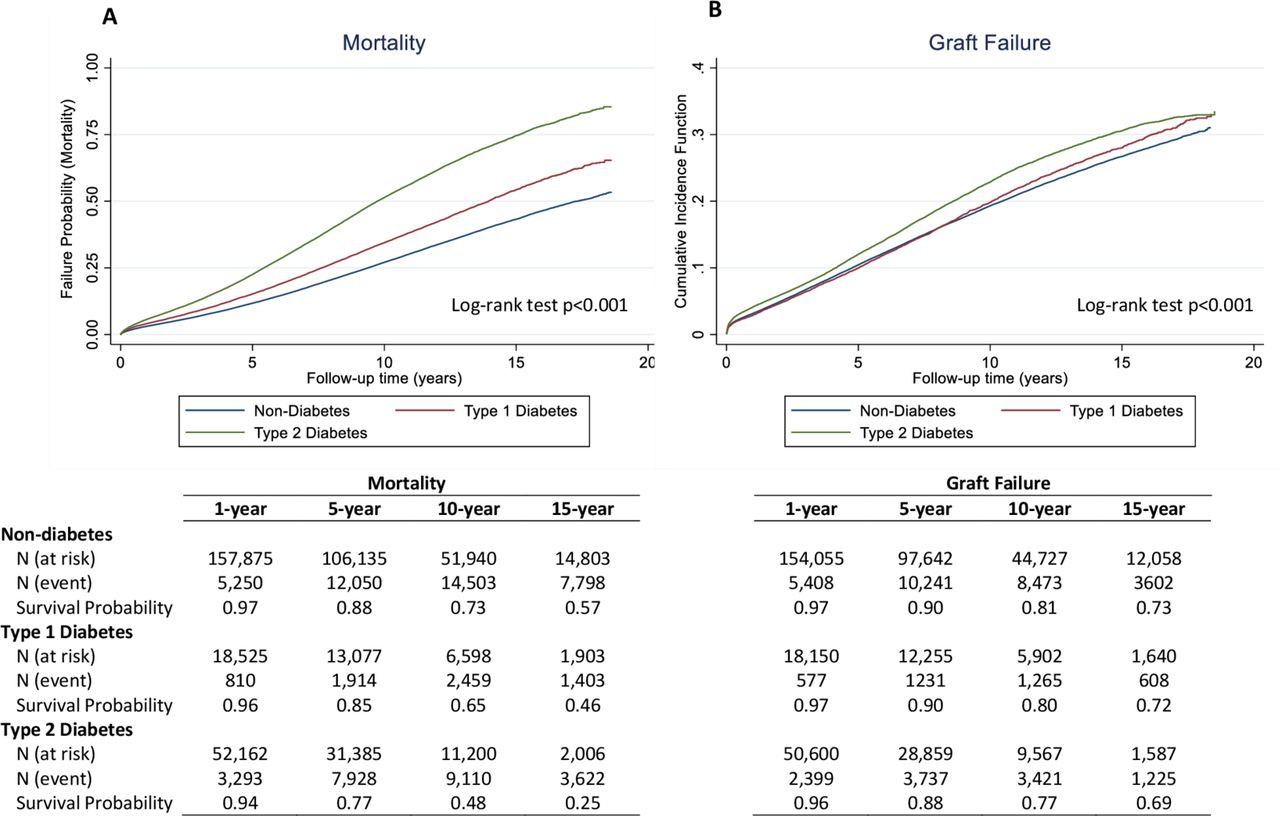
During the study period, a total of 72 175 (28.4%) deaths and 43 006 (16.9%) graft failures occurred. Figure 1A shows the mean (crude) survival of patients without diabetes, with T1D, and with T2D. Median survival time, in years, was 17.31 (95% CI: 17.10 to 17.57), 13.95 (95% CI: 13.67 to 14.15), and 9.73 (95% CI: 9.65 to 9.83) for non-diabetes, T1D and T2D, respectively. Crude survival probabilities at 1, 5, 10 and 15 years following transplant were highest among those with no diabetes and lowest among those with T2D. Figure 1B shows the mean (crude) cumulative incidence function for graft failure. Patterns were similar with those for mortality, whereby patients with no diabetes had greater survival probabilities as compared with those with T1D who had greater survival compared with those with T2D.

Failure probabilities and rates for mortality (A) and graft failure* (B), respectively, by primary cause of ESKD (non-diabetes, type 1 and type 2 diabetes). *Cumulative incidence function is reported for graft failure to account for the competing risk of death. ESKD, end-stage kidney disease.
Adjusted survival of kidney transplant recipients
Table 2 presents the crude and adjusted HRs for the two outcomes (mortality and graft failure) by donor type (DD vs LD). In fully adjusted models, relative mortality risk was highest among people with T1D (HR=1.95, (95% CI: 1.88 to 2.03)) and then T2D (HR=1.65 (95% CI: 1.62 to 1.69)), as compared with those without diabetes. Patterns were similar when stratified by donor type, though HRs for T1D and T2D relative to no diabetes were marginally higher in LD versus DD. Additional stratification by graft failure status showed mortality HRs relative to non-diabetes were higher among transplant recipients with T1D and T2D who did not versus did experience a graft failure (online supplemental table 3). Sensitivity analyses excluding simultaneous kidney and pancreas transplant recipients did not materially alter HRs in crude or adjusted models (online supplemental table 4).
HRs and 95% CI for mortality and graft failure in US transplant recipients (2000–2018), by diabetes and donor status
For graft failure, HRs were similar among people with T2D (HR=1.24 (95% CI: 1.18 to 1.31)) and T1D (HR=1.32 (95% CI: 1.28 to 1.36)), as compared with those with no diabetes in fully adjusted models (table 2). Additional stratification by donor type showed mortality HRs relative to non-diabetes were higher among both transplant recipients with T1D and T2D in LD versus DD. Similar to mortality, exclusion of simultaneous kidney and pancreas transplant recipients did not result in a change to HRs in crude or adjusted models (online supplemental table 4).
Risk factors for mortality and graft failure
Factors significantly associated with mortality and graft failure are shown in table 3. In brief, recipient risk factors for mortality were older (vs younger) age, male (vs female) gender, non-Hispanic white (vs all other) race/ethnicity, Medicare or Medicaid (vs private) insurance, longer (vs shorter) ESKD duration prior to transplant, higher (vs lower) BMI, history (vs no history) of smoking, all comorbidities (yes vs no), and graft failure (vs no graft failure). Donor risk factors for mortality were older (vs younger) age, non-Hispanic black (vs non-Hispanic white) and non-Hispanic white (vs Hispanic) race, low-risk, moderate-risk and high-risk DD (vs LD), and longer (vs shorter) cold ischemic time.
Risk factors for mortality and graft failure in multivariable analysis among US kidney transplant recipients, 2000–2018
Risk factors were similar in analyses examining graft failure as an outcome, with three exceptions: younger age (vs older age), non-Hispanic black (vs non-Hispanic white) race, and male (vs female) donor were associated with an increased risk of graft failure but not mortality (table 3).
Trends in survival of kidney transplant recipients (2000–2017)
The ASMRs (per 1000 persons) among US transplant recipients decreased between 2000 and 2017 for no diabetes (from 55.88 to 25.57), T1D (from 83.53 to 70.34), and T2D (from 61.60 to 41.07) (online supplemental table 5). The SMR relative to the general US population also declined between 2000 and 2017 for non-diabetes, T1D and T2D, though APC declines in the latter part of the time period were smaller for no diabetes and non-significant for T2D (online supplemental table 5 and figure 2). In 2017, SMRs remained 2.38 (95% CI: 2.31 to 2.45), 6.55 (95% CI: 6.07 to 7.06), and 3.82 (95% CI: 3.68 to 3.98) for no diabetes, T1D and T2D, respectively.

Standardized mortality ratios comparing year and age-matched mortality rates in the transplant versus general US populations, by diabetes status, 2000–2017; *ptrend <0.05. APC, annual percentage change.
Discussion
In this study, we report contemporary national US estimates of survival in first-time single kidney transplant recipients by diabetes status, with several important findings. First, in crude models, we show that survival probabilities at 1, 5, 10 and 15 years post-transplant are consistently highest among people with no diabetes and lowest among people with T2D. Second, in fully adjusted models, we show that people with T1D and T2D have a 95% and 65% increased risk of mortality, respectively, as compared with those with no diabetes. This excess risk is not explained by differences in age, graft failure, comorbidities or donor characteristics. Third, we show that age-standardized mortality among transplant recipients has declined since 2000 but remains approximately twofold to sevenfold higher compared with the general population with highest rates among T1D.
Our results of T2D are consistent with other published data. In an Australian/New Zealand study between 1994 and 2012, transplant recipients with T2D had a twofold increased risk of 10-year mortality as compared with those without diabetes, and 5-year survival probabilities of 79% vs 92%, respectively.19 In a regional US study from the Mayo Clinic (Minnesota, 1998–2006), patients with diabetes (majority assumed to be T2D) had reduced survival compared with patients without diabetes (5 years, 70% vs 93%, p<0.0001).7 This was, in part, explained by the population with diabetes being older, heavier, and having a higher prevalence of pre-transplant cardiovascular disease (CVD) (48% vs 16%, p<0.0001) relative to the population without diabetes, consistent with findings in the current study as well as other studies comparing baseline characteristics of transplant recipients with and without diabetes.12 Reduced survival in patients with versus without diabetes in the Mayo Clinic study was shown to be largely driven by a higher risk of CVD and infection-related mortality.7 Other recent studies have similarly shown that infection-related mortality, even more so than CVD-related mortality, is driving the higher mortality rate in transplant patients with versus without diabetes and should be a focus of future outcome studies among transplant recipients with diabetes.10 11 In particular, examining infection-related mortality in transplant recipients with T1D versus T2D may help identify specific subgroups for targeted interventions. Unfortunately, the current study was unable to examine cause-specific mortality due to a high proportion of missing cause of death data. However, in keeping with the growing evidence base, future studies that focus on types and dosage of lowering of immunosuppressive therapies may play a role in elucidating causes for excess mortality in transplant recipients with diabetes.10 11
Our results are consistent with several other studies insofar as we also demonstrate that male (vs female) sex, older (vs younger) age, non-Hispanic white (vs non-Hispanic black and Hispanic) race, longer (vs shorter) ESKD duration, Medicare/Medicaid (vs private) insurance, comorbidities (vs none), and high (vs low) DD risk are associated with increased risks of mortality in kidney transplant recipients.19–22 These risk factors are also associated with graft failure, excluding race, whereby non-Hispanic black people have a greater increased risk of graft failure, also consistent with other findings.23 These risk factors, while independently associated with mortality and graft failure, do not attenuate the association between diabetes status and mortality and graft failure risk in multivariate models. Nonetheless, it is perhaps surprising that non-Hispanic white people have a higher risk of mortality compared with other race and ethnic groups. However, this so-called survival paradox has been observed in several other studies24–26 with the most commonly cited reasons to explain this including: (1) a survival bias among black patients with ESKD who make it to renal replacement therapy; and (2) a lower transplant rate in black patients that artificially inflates the survival advantage as they are a highly select population.
Few studies have compared survival among the transplant population by diabetes status (both T1D and T2D). In Europe, data from the European Renal Association-European Dialysis and Transplant Association (ERA-EDTA), encompassing registry data from 10 European countries, showed that crude 1-year and 5-year patient survival after a first transplant was, respectively, 94% and 79% for T1D, 86% and 61% for patients with T2D, and 96% and 87% for patients without diabetes.20 The lower survival probabilities relative to the current study are likely explained by the differences in study period, 1991–2000 in ERA-EDTA vs 2000–2017 in the current study. ERA-EDTA also reported that mortality risk, adjusted for age, gender, donor type, and country, was higher in patients with T1D (HR: 2.21 (1.98 to 2.47)) and T2D (2.02 (1.68 to 2.43)), as compared with those with no diabetes.20 The higher HR estimates in ERA-EDTA relative to the current USRDS study are likely explained by the limited variables adjusted for in ERA-EDTA. In addition, in the current study we stratified by donor status (LD vs DD) and found that while patterns were similar insofar as T1D and T2D had higher risks of mortality and graft failure relative to non-diabetes, excess risk estimates were greater in LD versus DD groups. Reasons for this are speculative but may include a lower mortality risk overall in LD versus DD groups,27 owing in part to the younger patient population, such that the relative impact of diabetes is greater.
Only one other study that we are aware of has compared mortality rates over time in the transplant population with diabetes relative to the general population. Comparisons with the general population allow us to ascertain whether the improvement in survival seen in transplant patients is greater than or equal to the enhanced survival in the general population. In Finland, among 1100 kidney transplant recipients with T1D, SMRs declined 58% between 1964–1990 and 2006–2016 despite an apparent plateau in SMRs from 2000 onwards.28 In our study, SMRs in the population with T1D declined at a relatively consistent rate (APC: −2.2, p<0.05) between 2000 and 2017. For people without diabetes, we showed a significant decline in SMR between 2000 and 2008 (APC: −5.7, p<0.05), which continued between 2008 and 2017 but at a slower rate (APC: −1.8, p<0.05). For T2D, SMRs declined between 2000 and 2013 (APC: −3.4, p<0.05) but appeared to plateau thereafter (APC: −0.1, p>0.05) which warrants further investigation.
In this study, we are unable to definitively discern if increases in survival are due to improved treatment and management of transplant patients, or changes in the pool of transplant candidates. However, additional post-hoc analyses point to the former. For example, we show that the characteristics (at the time of transplant) among transplant patients between 2000–2005 vs 2010–2015 remain largely unchanged in recipients without diabetes, with T1D, and with T2D (online supplemental table 6). These findings are consistent with the characteristics of the broader US ESKD population reported in other studies.29 Therefore, we believe the overall increase in survival is more likely to be attributable to improvements in the treatment and management of transplant patients.30 31
Despite improved overall survival of the transplant population, disparities in mortality among patients without diabetes and those with T1D/T2D remained throughout the study period. Transplant recipients with T1D and T2D had a 95% and 65% increased risk of mortality, respectively, as compared with those with no diabetes. These disparities were not explained by differences in age, insurance status, recipient or donor characteristics, graft failure, or comorbidities. However, a greater excess risk among T1D versus T2D mirrors what we see in the general population with diabetes and may be explained, in part, by a greater diabetes duration in T1D versus T2D. Several studies have now been able to show that as diabetes duration increases, so too does the risk of several health outcomes including mortality.32–34 We were unable to explore the impact of diabetes duration in this study as data on diabetes diagnosis date are not available in USRDS. Future studies incorporating data on diabetes duration in transplant populations are needed to address this. It is also possible that differences in mortality between non-diabetes and T1D/T2D are due to shortcomings in the management of diabetes or hyperglycemia. Additional research is needed to identify effective interventions to further reduce mortality in those with diabetes who receive a kidney transplant, especially those with T1D where age-standardized mortality remains considerably higher than T2D and non-diabetes-related ESKD. In the interim, adequate management of glycemia35 36 in parallel with blood pressure control and anticipation of effects of immunosuppression31 37 as early as possible may be effective in reducing mortality in kidney transplant recipients with T1D and T2D.
There are important public health implications from this study to be considered. The prevalence of T2D remains high despite evidence that incidence may be declining.38 39 This is largely due to declining mortality in the population with diabetes, leading to increased life expectancy and cumulative exposure to the diabetic state.40 In addition, recent US data show that rates of ESKD among people with diabetes have not declined since 2009/2010, and have in fact increased in young adults.41 Taken together, it is likely that we will see a further rise in the incidence of diabetic ESKD with major impacts on public health. Namely, an increase in diabetic ESKD will increase demand for transplants which is already not matched by the availability of donor organs.1 Patients with diabetes who are typically older and have more comorbidities compared with patients without diabetes4 are already less likely to be considered for a transplant. An increase in diabetic ESKD is likely to exacerbate this existing disparity. As we and others6–8 show, diabetes type is an important modifier in the prognosis of transplant recipients. Therefore, routine reporting of diabetes-specific outcomes in annual reports, such as the USRDS annual data report,1 may assist in future healthcare planning and resource allocation.
Although we use a large, national database of individuals with ESKD linked to mortality, some limitations should be considered. First, we use clinician-assigned ‘primary cause’ of ESKD to assign diabetes status and so it is possible we have overestimated or underestimated the proportion of ESKD attributed to diabetes. The use of ICD codes to distinguish between T1D and T2D also lends itself to the possibility of misclassification. Second, we cannot exclude the possibility of misclassification in the USRDS database more generally. For example, we note that there are 820 (0.5%) dual pancreas and kidney transplant recipients without diabetes in this study which seems unlikely. Unfortunately, without additional information pertaining to other conditions (eg, exocrine insufficiency), we are unable to explore the possible reasons for this observation. Nonetheless, exclusion of dual pancreas/kidney transplant recipients (online supplemental table 4) did not materially change the results of the study. Third, there is the possibility for unmeasured confounding. While our analyses accounted for several possible confounders (eg, prior CVD, donor quality, insurance status), adjustment for these factors in multivariate models did not completely attenuate the association between T1D and T2D and mortality. This suggests there are other factors that may explain the excess mortality in T1D and T2D and elucidating the underlying causal mechanisms should be a focus of future research. For example, data on medications, diabetes duration, and lifestyle factors (eg, physical activity, diet) may provide additional insight into the excess mortality seen in T1D versus T2D. Fourth, more than 30% of cause of death data are missing in USRDS and thus we were unable to examine cause-specific mortality in this population. Ensuring complete cause of death data are captured in USRDS should be a high priority to enable future research in both the transplant population and broader population with ESKD. Last, estimating survival among transplant recipients is hampered by selection bias: younger patients with fewer comorbidities are more likely to be referred for a transplant as compared with the general population with ESKD, and we expect differences by diabetes status.4 For example, transplant candidates with T1D are younger and undergo screening for coronary artery disease, angioplasty or coronary bypass prior to transplant, while transplant candidates with T2D are older and more likely to have comorbid disease, and cohorts without diabetes are populated predominantly by hypertensive, genetic or immunologic glomerulopathy causes of ESKD. While we are able to adjust for several possible confounders such as age and comorbidities, we cannot rule out that these underlying pathologies drive both selection for a transplant and future risk of graft failure and mortality.
Conclusions
In the USA, mortality among people receiving a kidney transplant has declined since 2000 but remains approximately twofold to more than sixfold higher compared with the general population with highest rates among diabetes-related ESKD. Additional research might be considered to identify effective interventions to further reduce mortality in those with diabetes who receive a kidney transplant, especially T1D.
Data availability statement
Data are available in a public, open access repository. The USRDS database is freely available to the public. Therefore, studies conducted under the auspices of the USRDS are exempt from institutional review board approval.
Ethics statements
Ethics approval
This study was approved by the Institutional Review Board at Emory University (IRB00063645).
References
Supplementary materials
Supplementary Data
This web only file has been produced by the BMJ Publishing Group from an electronic file supplied by the author(s) and has not been edited for content.
Footnotes
Contributors JLH conceived and designed the study, performed the statistical analysis and wrote the manuscript. MP, ZW and RP provided technical support and reviewed/edited the manuscript. SB, GI, NRB and ALA revised the manuscript for important intellectual content. JLH is the guarantor of this work and, as such, had full access to all the data in the study and takes responsibility for the integrity of the data and the accuracy of the data analysis.
Funding A portion of this work was supported by the National Institute on Minority Health and Health Disparities (grant U01MD010611).
Disclaimer The data reported here have been supplied by the US Renal Data System (USRDS). The interpretation and reporting of these data are the responsibility of the author(s) and in no way should be seen as an official policy or interpretation of the US government or the Centers for Disease Control and Prevention.
Competing interests None declared.
Provenance and peer review Not commissioned; externally peer reviewed.
Supplemental material This content has been supplied by the author(s). It has not been vetted by BMJ Publishing Group Limited (BMJ) and may not have been peer-reviewed. Any opinions or recommendations discussed are solely those of the author(s) and are not endorsed by BMJ. BMJ disclaims all liability and responsibility arising from any reliance placed on the content. Where the content includes any translated material, BMJ does not warrant the accuracy and reliability of the translations (including but not limited to local regulations, clinical guidelines, terminology, drug names and drug dosages), and is not responsible for any error and/or omissions arising from translation and adaptation or otherwise.