Article Text

Abstract
Introduction Systemic chronic low-grade inflammation has been linked to insulin resistance (IR) and non-alcoholic steatohepatitis (NASH). NOD-like receptor protein 3 (NLRP3) inflammasome and its final product, interleukin (IL)-1β, exert detrimental effects on insulin sensitivity and promote liver inflammation in murine models. Evidence linking hepatic NLRP3 inflammasome, systemic IR and NASH has been scarcely explored in humans. Herein, we correlated the hepatic abundance of NLRP3 inflammasome components and IR and NASH in humans.
Research design and methods Metabolically healthy (MH) (n=11) and metabolically unhealthy (MUH) (metabolic syndrome, n=21, and type 2 diabetes, n=14) subjects were recruited. Insulin sensitivity (homeostatic model assessment of IR (HOMA-IR) and Oral Glucose Sensitivity (OGIS120)), glycemic (glycated hemoglobin), and lipid parameters were determined by standard methods. Plasma cytokines were quantified by Magpix. Hepatic NLRP3 inflammasome components were determined at the mRNA and protein levels by reverse transcription–quantitative PCR and western blot, respectively. Liver damage was assessed by histological analysis (Non-alcoholic Fatty Liver Disease Activity Score (NAS) and Steatosis, Inflammatory Activity, and Fibrosis (SAF) scores). IR and liver histopathology were correlated with NLRP3 inflammasome components as well as with liver and plasma IL-1β levels.
Results Body Mass Index, waist circumference, and arterial hypertension frequency were significantly higher in MUH subjects. These patients also had increased high-sensitivity C reactive protein levels compared with MH subjects. No differences in the plasma levels of IL-1β nor the hepatic content of Nlrp3, apoptosis-associated speck-like (Asc), Caspase-1, and IL-1β were detected between MUH and MH individuals. MUH subjects had significantly higher NAS and SAF scores, indicating more severe liver damage. However, histological severity did not correlate with the hepatic content of NLRP3 inflammasome components nor IL-1β levels.
Conclusion Our results suggest that NLRP3 inflammasome activation is linked neither to IR nor to the inflammatory status of the liver in MUH patients.
- non-alcoholic fatty liver disease
- inflammation
- metabolic syndrome
- obesity
Data availability statement
There are no data in this work.
This is an open access article distributed in accordance with the Creative Commons Attribution Non Commercial (CC BY-NC 4.0) license, which permits others to distribute, remix, adapt, build upon this work non-commercially, and license their derivative works on different terms, provided the original work is properly cited, appropriate credit is given, any changes made indicated, and the use is non-commercial. See: http://creativecommons.org/licenses/by-nc/4.0/.
Statistics from Altmetric.com
Significance of this study
What is already known about this subject?
NLRP3 inflammasome expression in adipose tissue has been linked to insulin resistance (IR) in murine models and humans.
Human liver NLRP3 inflammasome expression has been studied in primary liver diseases.
No studies have ever linked hepatic NLRP3 inflammasome expression with IR and non-alcoholic fatty liver disease severity in humans.
What are the new findings?
Hepatic NLRP3 inflammasome expression is linked neither to human IR determined by the National Cholesterol Education Program Adult Treatment Panel III criteria nor to type 2 diabetes mellitus.
Hepatic NLRP3 inflammasome expression is not associated with the severity of liver pathology in non-alcoholic fatty liver disease.
How might these results change the focus of research or clinical practice?
Quantification of hepatic NLRP3 inflammasome should not be the focus for assessing IR nor non-alcoholic fatty liver disease in humans.
Introduction
Chronic low-grade systemic inflammation has been involved in the pathogenesis of insulin resistance (IR).1–3 In fact, dysregulation of innate immunity is a possible cause of hepatic IR as well as hepatitis in non-alcoholic fatty liver disease (NAFLD).4–9
Innate immunity is triggered by a variety of pathogen and host-derived molecules, including bacterial lipopolysaccharide, single-stranded or double-stranded RNA, cholesterol and uric acid crystals, among others. These ligands activate molecular pattern recognition receptors at the cell surface and cytosol. Inflammasomes are multiprotein cytosolic molecular pattern complexes that catalyze the proteolytic conversion of prointerleukin (IL)-1ß into mature IL-1β.10–14 IL-1β is a potent proinflammatory cytokine that decreases insulin-stimulated glucose uptake in cultured adipocytes.15–17 Notably, pharmacological blocking of the IL-1 receptor with anakinra improves glycemic control in patients with type 2 diabetes (T2D),18 19 suggesting a direct link between IL-1β signaling and IR. Finally, IL-1β may also drive islet β-cell dysfunction and thus promote T2D.20 21
The role of inflammasome on IR has been mostly substantiated by studies in animal models of obesity, diabetes, and NAFLD.22–25 In rodents, nod-like receptor protein 3 (NLRP3) inflammasome gene deletion generates resistance to diet-induced obesity and improves IR in mice.26 Additionally, transgenic overexpression of specific components of NLRP3 inflammasome increases liver inflammation and fibrosis, and, conversely, Nlrp3 gene deletion ameliorates hepatic steatosis and inflammation in models of diet-induced NAFLD.27–29
The level of evidence in human studies is much lower. The role of Nlrp3 in obesity, IR, and T2D has been evaluated mostly at the adipose tissue level, suggesting a positive correlation between Nlrp3 gene expression and IR.25 30 Additionally, hepatic levels of Nlrp3 and IL-1β mRNA are reportedly increased in patients with non-alcoholic steatohepatitis (NASH) compared with patients with pure steatosis, suggesting a role for NLRP3 inflammasome in NAFLD progression.29
Nevertheless, the pathophysiological relevance of hepatic NLRP3 inflammasome on insulin sensitivity as well as in liver inflammation has been assessed only in extremely obese subjects, remaining uncertain whether NLRP3 inflammasome abundance and activity correlate with IR in less obese individuals.29
In this work, we aimed to assess whether the hepatic abundance of NLRP3 inflammasome components correlates with systemic markers of inflammation, IR, and liver histological alterations in a cohort of metabolically healthy (MH) and metabolically unhealthy (MUH) subjects.
Research design and methods
Selection of patients and ethical considerations
This study accomplished the Strengthening the Reporting of Observational Studies in Epidemiology guidelines (https://www.strobe-statement.org/). All subjects were evaluated in the digestive surgery outpatient clinic of Pontificia Universidad Católica de Chile School of Medicine between July 2015 and December 2018. Their original consultations were benign abdominal diseases requiring open or laparoscopic surgery, including gastroesophageal reflux disease, cholelithiasis, obesity, and abdominal wall hernias. Subjects were invited to participate after evaluation of the status of systemic IR according to National Cholesterol Education Program Adult Treatment Panel III (ATP III) criteria for metabolic syndrome (MS), with waist circumference cut-off values adjusted to the Chilean population.31–33 Subjects of both sexes, aged between 18 and 60 years old, were included. This cohort was separated into two groups: (1) MH subjects, corresponding to those with 0 or 1 criteria for MS, but without T2D; and (2) MUH subjects, corresponding to non-diabetic patients with three to five ATP III criteria, and patients with T2D,34 irrespective of their MS status. Individuals with two criteria for MS were excluded because they have an intermediate metabolic status of uncertain pathophysiological meaning.
Patients were invited to participate if they met the described inclusion criteria and the following exclusion criteria: (1) current or past oncological diseases; (2) chronic inflammatory systemic diseases (systemic erythematous lupus, rheumatoid arthritis, and inflammatory bowel disease); (3) chronic infections (HIV, human hepatitis virus B and C, tuberculosis, etc); (4) pregnancy; (5) chronic organ failure syndromes (chronic obstructive lung disease, chronic liver and renal disease, and congestive cardiac failure); (6) patients with T2D under insulin therapy; and (7) subjects with clinically significant alcohol consumption (≥20 g/day for women and ≥30 g/day for men). Exclusion criteria were aimed to prevent conditions that may activate chronic systemic inflammatory mechanisms, induce a different pathway of liver damage, or trigger insulin secretion deficiency or IR by independent mechanisms.
All patients underwent a preoperative evaluation consisting of physical examination (body weight, height, waist circumference, and arterial blood pressure determination) and venous blood draw to determine biochemical markers of MS and systemic inflammation. Liver samples were harvested on the day of the elective surgeries, and no follow-up was performed after surgery for this study.
Laboratory analysis
Complete blood cell count, liver enzymes, lipid profile, glucose, and insulin levels, A1c glycated hemoglobin, thyroid function tests, and highly sensitive C reactive protein (hsCRP) were determined in the central laboratory of Christus Health–Pontificia Universidad Católica de Chile network. Dynamic insulin sensitivity was assessed by an oral glucose tolerance test (75 g) with multiple venous blood sampling to determine glucose and insulin levels and calculate the Oral Glucose Sensitivity (OGIS120) index,35 a validated surrogate for clamping procedures. All tests were performed after 10–12 hours of overnight fasting, between 09:00 and 10:00 in the morning. Plasma and serum samples were stored at −80°C for subsequent analyses.
Plasma levels of IL-1β, tumor necrosis factor alpha (tnf-α), IL-6, macrophage chemoattractant protein-1, resistin, plasminogen activator inhibitor-1 (pai-1), adiponectin, hepatocyte grow factor, IL-8, nerve growth factor, and leptin were measured with MAGPIX system using the HADCYMAG-61K kit (Luminex®).
Liver tissue sampling
On laparoscopy, a wedge liver tissue sample was taken from the lateral liver segment with cold scissors. Tru-cut needle-based biopsies are no longer allowed in the Department of Digestive Surgery of Pontificia Universidad Católica de Chile because of reported severe intraoperative and postoperative hemorrhagic complications.36 Furthermore, excisional liver biopsies have comparable morphological and molecular qualities to deep puncture biopsies when examined by an expert pathologist aware of the excessive fibrosis that occurs near Glisson’s capsule. To further control the histological quality of the biopsies included in this study, only samples with at least 11 complete portal tracts were analyzed.37–39 Liver samples were immediately separated into three pieces: one was stored in RNAlater storage solution; a second was snap-frozen in liquid nitrogen and stored at −80°C; and a third was fixed in formaldehyde for histological analyses.
Western blot analysis
Liver tissue was homogenized in ice-cold RIPA buffer (50 mM, Tris–Cl, pH 7.5, 150 mM NaCl, 1% NP-40, 0.5% sodium deoxycholate, and 1% sodium dodecyl sulfate), supplemented with a protease and phosphatase inhibitor cocktail tablet (Roche Diagnostics, GmbH). Protein concentration was determined with BCA Protein Assay Kit (Pierce Biotechnology, Rockford, Illinois, USA). Forty micrograms of proteins were resolved in 10% sodium dodecyl sulfate–polyacrylamide gel electrophoresis and transferred onto polyvinylidene fluoride or nitrocellulose membranes. Primary antibodies against NLRP3 (monoclonal antibody, Cell Signaling Technology), ASC (Cell Signaling Technology), and caspase-1 (Cell Signaling Technology) were used. A horseradish peroxidase-linked secondary antibody anti-rabbit IgG (Cell Signaling Technology) was used. β-Actin or β-tubulin was used as loading control (Cell Signaling Technology).
Reverse transcription–quantitative PCR (RT-qPCR)
Total RNA was extracted from 100 mg of frozen liver tissue, using the PureLink RNA Mini Kit (Invitrogen), treated with DNase, and reverse transcribed. RT-qPCR was performed according to the protocol provided by TaqMan Universal PCR Master Mix (Applied Biosystems). Amplification curves and specific product detection were quantified and analyzed with ABI PRISM Step One Fast Sequence Detection System (Applied Biosystems). Primers used for reactions were Nlrp3 (Hs00918082_m1), Caspase-1 (Hs00354836_m1), and IL-1β (Hs00174097_m1). Relative mRNA abundances were determined with the delta–delta cycle threshold (Ct) method using β-actin (Hs01060665_g1) as a housekeeping gene, as previously described40–42
Liver histology
Liver tissue samples were fixed in 10% buffered formalin, embedded in paraffin, and sectioned with a microtome. Tissue sections were stained with H&E and Van Gieson staining. Surgical pathologists, blind for the clinical status of the patients, evaluated the specimens and assigned a score for steatosis, inflammation, ballooning, and fibrosis. Steatosis, Inflammatory Activity, and Fibrosis (SAF) score and Non-alcoholic Fatty Liver Disease Activity Score (NAS: steatosis, lobular inflammation, and ballooning) were determined by a different investigator also blind to the clinical status of the patients.
Statistical analysis
To detect statistically significant differences between MH and MUH individuals with an OR=2, level of trust of 0.95, a potency of 0.8, control exposure to the risk factor (systemic inflammation, assessed by hsCRP levels) of 0.2 and case exposure of 0.8, we determined a sample size of 14 patients per group. This sample size is coherent with the sample size reported in the literature for human studies on adipose tissue NLRP3 inflammasome in obese subjects.30
The results are expressed as total numbers, percentages, and mean ± SD. For continuous data, statistical significance was determined with non-paired Student’s t-test or one-way analysis of variance (ANOVA) test for comparisons of two or three groups, respectively. Tukey post-test was applied after ANOVA to compare specific groups. For non-continuous data, a χ2 test was performed. Correlation analysis was performed with Pearson’s test. All statistical analyses were performed with GraphPad Prism software V.8 (http://www.graphpad.com/scientific-software/prism/). Differences were considered significant when the p value was <0.05.
Results
Anthropometric, clinical and laboratory characterization of the patients
Forty-six subjects were included in the study. Based on ATP III criteria for MS and American Diabetes Association (ADA) criteria for T2D diagnosis, individuals were categorized as ‘MH’ (n=11) and ‘MUH’ (n=35). The MH group was composed of subjects with zero or one ATP III criterion. Although subjects with two of the ATP III criteria are considered as not having MS in clinical guidelines, they have a greater frequency of dysglycemia, dyslipidemia, and increased waist circumference. Therefore, we excluded this intermediate group (n=14) to extreme the phenotypical differences between MH and MUH individuals.
MUH group was composed of patients with MS (n=21) and T2D (n=14). The characteristics of these patients are summarized in table 1. We found no differences in gender and age between MH and MUH patients, although individuals in the MH group tended to be younger and have a higher proportion of women. As expected, Body Mass Index (BMI), waist circumference, and arterial hypertension were significantly higher in MUH subjects. Subgroup analysis showed no differences in these parameters between individuals with MS and individuals with T2D.
Anthropometrics, clinical status, and laboratory tests of the study population
As predicted, plasma glucose and insulin levels, homeostatic model assessment of insulin resistance (HOMA-IR), glycated hemoglobin (HbA1c), and hsCRP were significantly higher in MUH as compared to MH individuals (table 1). Dynamic evaluation of insulin sensitivity showed that MUH individuals had a lower OGIS120 index, suggesting higher levels of systemic IR. Subgroup analysis revealed that glycemia and HbA1c were both significantly higher in subjects with T2D as compared to subjects with MS. Interestingly, no differences in total and low-density lipoprotein cholesterol between MUH and MH subjects were detected, likely as a result of the higher use of statins use in subjects with T2D. High-density lipoprotein cholesterol levels were lower (MH: 54±13 vs MS: 41±11 vs T2D: 42±11 mg/dL, p=0.006), and triglycerides levels were higher (MH: 86±26 vs MS: 166±82 vs T2D: 175±102 mg/dL, p=0.01) in MUH patients (table 1).
MUH individuals have increased levels of inflammatory cytokines, but not IL-1β, in circulation
Multiplex analysis of plasma cytokines showed significantly higher levels of adiponectin in MH as compared with MUH subjects, whereas on the contrary, inflammatory cytokines PAI-1, IL-6, and TNF-α were all significantly increased in MUH individuals (table 2). These findings are concordant with the elevated hsCRP levels in these patients (table 1) and support the hypothesis that MUH patients had a low-grade chronic systemic inflammatory status, as previously reported.8 Unexpectedly, we found that plasma levels of IL-1β were equivalent between MH and MUH subjects (0.68±0.25 vs 0.79±0.35 vs 0.8±0.37, for healthy subjects, subjects with MS and subjects with T2D, respectively, p=0.62), suggesting that either systemic IL-1β formation rates are not increased or the degradation rate is elevated in MUH subjects compared with MH subjects.
Plasma cytokine levels of healthy controls and subjects with metabolic syndrome and T2D
Hepatic levels of NLRP3 inflammasome components are not elevated in MUH individuals
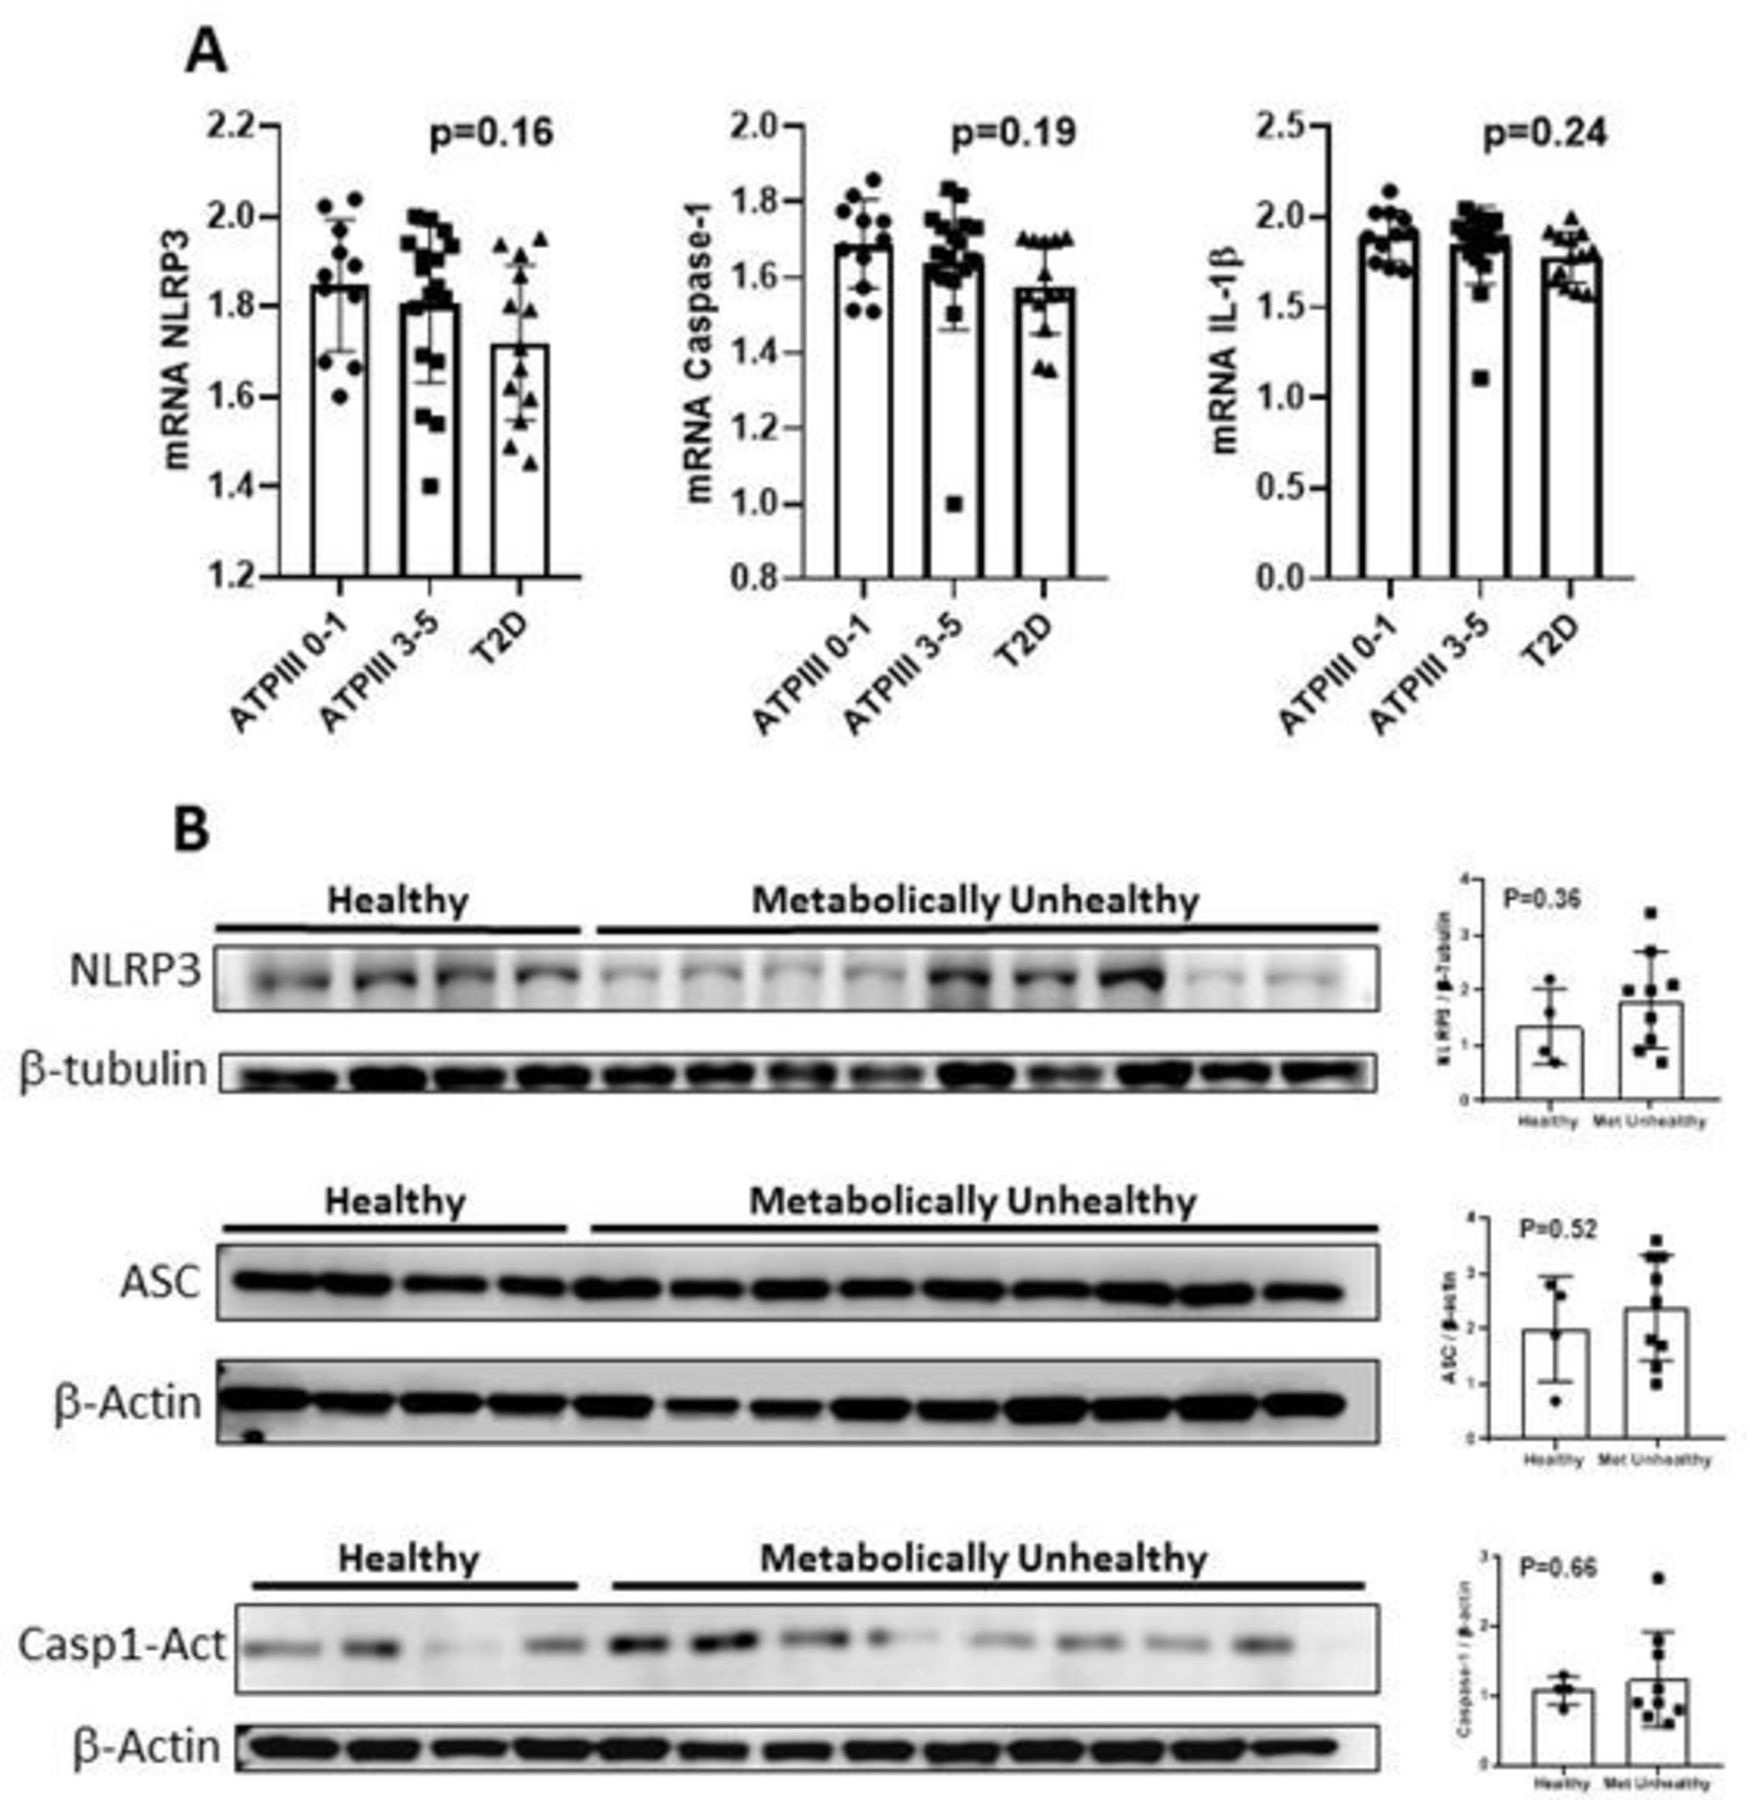
Murine models of obesity and diabetes suggest that NLRP3 inflammasome is a key pathogenic player for both hepatic inflammation and IR, by generating increased levels of IL-1β. Therefore, we aimed to assess whether the hepatic abundance of NLRP3 inflammasome components was increased in MUH patients. As shown in figure 1A and contrary to our expected results, we observed no differences in the hepatic abundance of Nlrp3, Caspase-1, and IL-1β at the mRNA level between MUH and MH patients. Similarly, we found no correlation between hepatic Nlrp3, Caspase-1 and IL-1β mRNA levels, and systemic insulin sensitivity markers (online supplemental table 1).
Supplemental material

Hepatic mRNA and protein expression of the inflammasome components in healthy and metabolically unhealthy subjects. (A) Hepatic mRNA levels of Nlrp3, Caspase-1, and IL-1β. Each row shows the mean and SD values. Additionally, each row shows single values per group. Statistical analysis performed with one-way analysis of variance. There were no differences in the liver expression of Nlrp3, Caspase-1 or IL-1ß between groups. Excluding the outlier in group ATP III 3–5 did not change the results. (B) Western blots of nlrp3, asc and active caspase-1. Graphs of the expression of the western blots of nlrp3, asc and active caspase-1. Statistical analysis performed with Student t-test. There were no differences between groups in any protein expression. ATP III, Adult Treatment Panel III; IL, interleukin; Nlrp3, nod-like receptor protein 3; T2D, type 2 diabetes.
Because the abundance of the NLRP3 inflammasome components are regulated also at the post-transcriptional level, we assessed nlrp3, asc, and caspase-1 protein levels in whole liver homogenates. As shown in figure 1B, protein levels of nlrp3 and asc, the two main components of the NLRP3 inflammasome, and cleaved caspase-1,43 44 a proxy for inflammasome activation, were equivalent between MUH and MH individuals. Importantly, our western blotting analysis revealed great variability in NRLP3 inflammasome components in the liver of the analyzed individuals (figure 1B), suggesting interindividual differences in the regulation of the levels of NLRP3 inflammasome components.
MUH patients have a more severe hepatic tissue damage that does not correlate with NLRP3 inflammasome levels
Histological analysis showed a higher frequency of normal histology and simple steatosis in MH compared with MUH individuals. On the contrary, MUH patients, either with MS or T2D, had a higher frequency of NASH (table 3). Also, subjects with T2D showed a significantly higher frequency of ballooning, lobular inflammation, and fibrosis as compared with MS subjects. Concordantly, NAS and SAF scores were higher in MUH individuals as compared with MH patients (table 3).
Liver enzymes and histological analysis of healthy controls and subjects with metabolic syndrome and T2D
To assess the role of the NLRP3 inflammasome in liver pathology, we performed correlation analysis between the abundance of Nlrp3, Caspase-1, and IL-1β mRNA with histological markers of liver damage. As shown in figure 2, we found no correlation between the abundance of inflammasome components and NAS and SAF scores as neither with steatosis, lobular inflammation, ballooning, or fibrosis (online supplemental table 1), regardless of the metabolic health status of the patients.

Correlation between mRNA expression of the NLRP3 inflammasome components and NAS and SAF scores. Pearson correlation test did not demonstrate a significant correlation between hepatic mRNA levels of the components of the inflammasome (NLRP3, caspase-1, and IL-1β) with hepatic NAS and SAF scores. IL, interleukin; NAS, Non-alcoholic Fatty Liver Disease Activity Score; NLRP3, nod-like receptor protein 3; SAF, Steatosis, Inflammatory Activity, and Fibrosis.
Discussion
Chronic low-grade inflammation correlates and possibly causes hepatic and systemic IR, and the activation of NLRP3 inflammasome is a possible mechanism for hepatic IR and inflammation. Herein, we quantified the hepatic abundance of NLRP3 inflammasome components and the inflammatory status at the systemic and hepatic level in subjects with MS and T2D compared with MH individuals.
Our results show that, as previously reported, MUH subjects have increased circulating levels of several proinflammatory cytokines as well as hsCRP in comparison with MH individuals, suggesting a state of chronic low-grade systemic inflammation. Also, MUH individuals have a higher frequency of hepatic histopathological indicators of NASH. Nevertheless, in our study, we found no elevations of plasma IL-1β in MUH patients, suggesting that this cytokine is not implicated in the systemic complications of these patients. Because IL-1β is the product of NLRP3 inflammasome, we speculate that this inflammasome has no pathophysiological actions in the circulating levels of this cytokine in MUH patients. Nevertheless, it is well possible that inflammasome activation still plays a role in IR and inflammatory processes at specific tissue levels. In fact, it has been reported that increased abundance of NLRP3 inflammasome components in the adipose tissue of obese patients correlates with increased IR in these individuals. However, our results show that the hepatic abundance of NLRP3 inflammasome components at the mRNA and protein levels was not different between MH and MUH subjects, and that NLRP3 inflammasome component abundance did not correlate with static and dynamic indicators of IR (HOMA-IR and OGIS120, respectively) nor glycemic control (HbA1c). These results are coherent with our finding that the hepatic abundance of cleaved caspase-1, a surrogate indicator of inflammasome activity,43 44 was equivalent between MH and MUH individuals, suggesting that MS and T2D do not increase the abundance nor the activity of hepatic NLRP3 inflammasome. Similarly, we found no correlation between NLRP3 inflammasome component abundance and NAS or SAF scores in the liver, suggesting that the inflammasome is not implicated in the progression of NAFLD. Nevertheless, it must to be noted that the small sample size of this study and the lack of direct determinations of inflammasome activity in the liver of the analyzed patients limit the strength of our conclusions.
NLRP3 inflammasome and IL-1β have been mechanistically linked to IR in murine models of obesity. Mice lacking components of NLRP3 inflammasome are resistant to high-fat diet-induced obesity and IR,25 and the pharmacological inhibition of NLRP3 inflammasome ameliorates the metabolic abnormalities induced by a high-fat diet feeding.45 Thus, it is currently proposed that the NRLP3 inflammasome is pathophysiologically linked to T2D by promoting IR as well as by triggering beta-cell dysfunction.20 21 24 25
However, it has been noted that evidence connecting NLRP3 inflammasome and human metabolic diseases is scarce and indirect, and it is mostly centered in the adipose tissue but not the liver.
The role of NLRP3 inflammasome in human adipose tissue was studied by Esser et al, who reported that MUH obese subjects have increased levels of NLRP3 inflammasome components in the visceral adipose tissue compared with MH obese and lean subjects.30 Additionally, these authors observed increased caspase-1 activity and IL-1β levels in cultured human adipocytes, indirectly supporting a role for this inflammasome in the metabolic complications of obesity. Additionally, Vandanmagsar et al described that bodyweight reduction was associated with a reduction in the levels of Nlrp3 and IL-1β mRNA in the subcutaneous adipose tissue of subjects with T2D, correlating with improved glycemia and insulin sensitivity surrogates.25 On the contrary, Moschen et al described that bariatric surgery did not significantly change liver nor subcutaneous adipose tissue Nlrp3 and IL-1β mRNA levels,46 highlighting the controversial roles of the inflammasome in adipose tissue and liver IR.
In HepG2 or L02 cell lines, NLRP3 inflammasome inhibition with molecules such as betaine, liraglutide, Wu Mei Wan and andrographolide, ameliorates IR,47–50 suggesting a role for this inflammasome in hepatic insulin action. However, only studies of primary hepatic diseases such as alcoholic liver disease, liver ischemia/reperfusion, or autoimmune hepatitis51 have substantiated more direct roles for hepatic NLRP3 inflammasome in human diseases.
In patients with NAFLD and NASH, Wree et al reported that hepatic NLRP3 inflammasome components, as well as Col1A gene expression, are elevated in patients with extreme obesity (BMI above 50 kg/m2) and NASH compared with patients with simple steatosis.29 However, these authors did not describe the metabolic status of these individuals, which had a much higher BMI and circulating transaminases levels than the patients included in our study. Therefore, although our study does not support an increase in the hepatic levels of NLRP3 components in MUH patients, it remains possible that hepatic NLRP3 inflammasome is increased in severely obese individuals. Nonetheless, it must be noted that even in this subset of patients, the relationship between inflammasome activity, IR, and liver pathology remains formally untested.
In recent years, several post-transcriptional modifications have been described regulating NLRP3 inflammasome activity, including ubiquitination, phosphorylation, nitrosylation, as well as various NLRP3-interacting proteins.52 53 Therefore, it is possible that significant changes in inflammasome activity can be present even with unchanged inflammasome component abundance.
In summary, we found that the abundance of hepatic NRLP3 inflammasome components does not correlate with systemic IR and inflammation nor with the histological damage in the liver of MUH patients.
Considering the limitations of this study (small sample size, lack of prospective follow-up, no direct determination of inflammasome activity, and limited ethnical diversity), further studies are required to fully evaluate the role of the hepatic inflammasome system in patients with obesity and its role in IR and NASH.
Data availability statement
There are no data in this work.
Ethics statements
Ethics approval
This study was approved by the ethics committee of the Faculty of Medicine, Pontificia Universidad Católica de Chile, on December 1, 2015 (number of approval 15–313). All patients were included only after they provided their informed consent.
Acknowledgments
We thank Marco Arrese, MD, for reading this article.
References
Supplementary materials
Supplementary Data
This web only file has been produced by the BMJ Publishing Group from an electronic file supplied by the author(s) and has not been edited for content.
Footnotes
Contributors NQ: study design, patient recruitment, surgery on patients, data analysis, and manuscript writing. IV and JT: histological analysis. GM: filling of databases. JC: statistical analysis. JPA: statistical analysis and data analysis. JJF: sample processing, reverse transcription–quantitative PCR analysis. CP: sample processing and western Blotting. DT: patient recruitment and study coordination. VC: study design, data analysis, and manuscript writing and editing.
Funding This study was supported by grants from Fondo Nacional para el Desarrollo Científico y Tecnológico FONDECYT (#11 150 329, awarded to NQ, and #1 181 214, awarded to VC).
Competing interests None declared.
Provenance and peer review Not commissioned; externally peer reviewed.
Supplemental material This content has been supplied by the author(s). It has not been vetted by BMJ Publishing Group Limited (BMJ) and may not have been peer-reviewed. Any opinions or recommendations discussed are solely those of the author(s) and are not endorsed by BMJ. BMJ disclaims all liability and responsibility arising from any reliance placed on the content. Where the content includes any translated material, BMJ does not warrant the accuracy and reliability of the translations (including but not limited to local regulations, clinical guidelines, terminology, drug names and drug dosages), and is not responsible for any error and/or omissions arising from translation and adaptation or otherwise.