Article Text

Abstract
Introduction South Asians (SA) and Pima Indians have high prevalence of diabetes but differ markedly in body size. We hypothesize that young SA will have higher diabetes incidence than Pima Indians at comparable body mass index (BMI) levels.
Research design and methods We used prospective cohort data to estimate age-specific, sex, and BMI-specific diabetes incidence in SA aged 20–44 years living in India and Pakistan from the Center for Cardiometabolic Risk Reduction in South Asia Study (n=6676), and compared with Pima Indians, from Pima Indian Study (n=1852).
Results At baseline, SA were considerably less obese than Pima Indians (BMI (kg/m2): 24.4 vs 33.8; waist circumference (cm): 82.5 vs 107.0). Age-standardized diabetes incidence (cases/1000 person-years, 95% CI) was lower in SA than in Pima Indians (men: 14.2, 12.2–16.2 vs 37.3, 31.8–42.8; women: 14.8, 13.0–16.5 vs 46.1, 41.2–51.1). Risk of incident diabetes among 20–24-year-old Pima men and women was six times (relative risk (RR), 95% CI: 6.04, 3.30 to 12.0) and seven times (RR, 95% CI: 7.64, 3.73 to 18.2) higher as compared with SA men and women, respectively. In those with BMI <25 kg/m2, however, the risk of diabetes was over five times in SA men than in Pima Indian men. Among those with BMI ≥30 kg/m2, diabetes incidence in SA men was nearly as high as in Pima men. SA and Pima Indians had similar magnitude of association between age, sex, BMI, and insulin secretion with diabetes. The effect of family history was larger in SA, whereas that of insulin resistance was larger in Pima Indians
Conclusions In the background of relatively low insulin resistance, higher diabetes incidence in SA is driven by poor insulin secretion in SA men. The findings call for research to improve insulin secretion in early natural history of diabetes.
- diabetes mellitus
- type 2
- epidemiology
- insulin secretion
- insulin resistance
This is an open access article distributed in accordance with the Creative Commons Attribution Non Commercial (CC BY-NC 4.0) license, which permits others to distribute, remix, adapt, build upon this work non-commercially, and license their derivative works on different terms, provided the original work is properly cited, appropriate credit is given, any changes made indicated, and the use is non-commercial. See: http://creativecommons.org/licenses/by-nc/4.0/.
Statistics from Altmetric.com
Significance of this study
What is already known about this subject?
South Asians and Pima Indians have a high prevalence of type 2 diabetes at younger ages, although they differ markedly in body size.
What are the new findings?
Young South Asians are, on average, less obese, less insulin resistant, and more insulin deficient than similar aged Pima Indians. Overall, diabetes incidence was higher in Pimas than in South Asians.
Intriguingly, diabetes incidence is higher in non-obese South Asian men than in Pima men but not in women.
The relative effect of insulin resistance on diabetes incidence was greater in Pima Indians than in South Asians, while the effect of insulin secretory dysfunction was similar.
How might these results change the focus of research or clinical practice?
The pathophysiology of type 2 diabetes in non-obese South Asians may imply the need to investigate strategies at improving insulin secretion for diabetes prevention.
Introduction
South Asians (SA), people residing in or with origins in India, Pakistan, Bangladesh, Sri Lanka, Nepal, Bhutan, and Maldives, comprise of nearly 2 billion people worldwide and experience a very high prevalence of type 2 diabetes, even at younger ages and low body mass index (BMI).1 A number of studies comparing SA with other ethnic groups have reported a higher diabetes prevalence in this population after accounting for age and body mass indices.2–6
These observations have led to various postulates as to why SA may be at higher risk of type 2 diabetes. A dominant hypothesis is that this population may be susceptible to visceral fat deposition, and consequently, higher insulin resistance.7 8 Yet, some recent data have raised doubts about this hypothesis.9 A cross-sectional study comparing SA with Pima Indians, a population who also exhibit high diabetes risk at younger ages, reported that despite the SA being 8 kg/m2 lighter and 23 cm smaller in waist circumference compared with Pima Indians, they had roughly similar diabetes prevalence.9 This suggests that factors other than obesity and obesity-driven insulin resistance may be important to consider when investigating the high risk of diabetes in young SA. Other cross-sectional studies have also suggested high risk of diabetes in non-obese SA compared with other populations.6 10 11 However, the stark difference between SA and Pima Indians, especially even at younger ages, makes for intriguing further investigations.12 A careful longitudinal study of diabetes incidence and pathophysiology in young SA compared with Pima Indians, two high risk populations separated by obesity risk, may shed further light on these issues.
Using data from the prospective population-based Center for Cardiometabolic Risk Reduction in South Asia Study (CARRS),13 we report the age-specific and BMI-specific diabetes incidence by gender for urban SA, aged 20–44 years (n=6676), and compare them with 20–44 year old Pima Indians of Arizona (n=1852), a North American population with an extraordinarily high incidence of type 2 diabetes14
Research design and methods
Methods details of CARRS13 and Pima studies14 15 are published elsewhere. Brief descriptions of study population, analytical samples, and measurements are provided below.
Study populations and analytical samples
CARRS
CARRS is a representative sample of adult residents aged ≥20 years living in Chennai and Delhi (India) and Karachi (Pakistan) recruited in 2010–2011, with follow-up assessments in 2012–2013 (first), 2013–2014 (second), 2014 (third), and 2016–2017 (fourth). The first, second, and fourth follow-up assessments were done in person and the third by telephone. At baseline a 75 g oral glucose tolerance test was conducted with samples taken at fasting, 30 min and 2 hours after the glucose load, and HbA1c was also measured. Fasting blood samples and HbA1c were also collected at the second and fourth follow-up assessments. Trained field teams collected data using standardized techniques, and all sites used accredited laboratories and participated in an external quality assurance scheme that standardized findings to a central laboratory (All India Institute of Medical Sciences (AIIMS)). Data were collected from participants through interviews in local languages, clinical examinations, and laboratory analysis of blood samples. The study received approval for human subjects’ research from the ethics committees of the Public Health Foundation of India and AIIMS (Delhi), Madras Diabetes Research Foundation (Chennai), Aga Khan University (Karachi), and Emory University (Atlanta).
The present analysis includes participants with baseline data collected between October 2010 and December 2011 with at least one follow-up assessment by February 2017 (n=3136) with a median (interquartile interval (p25, p75)) follow-up of 4.8 (3.8–5.1) years. Participants with diabetes at baseline (n=1135) were excluded from the analysis.
Pima study
From 1965 to 2007, a longitudinal study of diabetes was conducted in a central Arizona community where most of the residents are Pima Indians.14 15 Individuals who were 5 years of age or older were invited to participate in a health examination every 2 years. Each examination included a 75 g oral glucose tolerance test with glucose measurements taken fasting and 2 hours after the glucose load. The study was approved by the Institutional Review Board of the National Institute of Diabetes and Digestive and Kidney Diseases. For the present analyses, examinations were selected if the participant was 20–44 years old and without diabetes at baseline. Only participants whose baseline assessments occurred after September 1989, when measurement of HbA1c was initiated in the study were included. Analyses of diabetes incidence included individuals with at least one follow-up examination (n=1852, median (interquartile interval, p25, p75) follow-up was 6.7 (3.7, 10.3) years).
Measurements
Both the CARRS and Pima cohorts collected sociodemographic data, anthropometry (height, weight, waist circumference), history of smoking, diabetes status, family history of diabetes, and measured systolic (SBP) and diastolic (DBP) blood pressures. Body mass index (BMI) was calculated as weight in kilograms divided by height in meter squared. Waist circumference in CARRS was measured at the smallest horizontal girth between the costal margins and the iliac crests. In the Pima study, waist circumference was measured at the umbilicus with the participant supine. In CARRS, participants were rested for 5 min, and blood pressure was measured twice using an electronic sphygmomanometer (Omron HEM-7080 and HEM-7080IT-E; Omron, Tokyo, Japan). A third measurement was taken if the difference between the first two systolic or diastolic measurements was more than 10 mm Hg or 5 mm Hg, respectively. The mean of the last two blood pressure measurements was used for analyses. In the Pima study, blood pressure was measured once with a manual sphygmomanometer, and the first and fourth Korotkoff sounds were used for SBP and DBP readings.
In both cohorts, lipids (low density lipoprotein (LDL)-cholesterol, high density lipoprotein (HDL)-cholesterol, triglycerides) were measured in fasting serum; LDL cholesterol was calculated using the Friedewald equation. In CARRS, fasting plasma glucose (FPG) was estimated by the hexokinase/kinetic assay in Chennai and Delhi and by the glucose oxidase/endpoint method in Karachi. Glycated hemoglobin (HbA1c) was estimated by the high performance liquid chromatography method in all three sites and standardized to the Diabetes Control and Complications Trial assay.
Plasma glucose concentration was measured by the glucose oxidase method in Pima Indians. To validate measures, glucose assays from the MDRF laboratory were exchanged and evaluated against a US reference laboratory, the Northwest Lipid Metabolism and Diabetes Research Laboratories (NWRL). High concordance for glucose was found; values ranged from 3.8 to 10.1 mmol/L (n=20, y=1.03x − 1.8), the correlation, r, was 0.996, and the % bias ranged 0.5%–5.5%.
In CARRS, serum insulin concentrations were measured using the electrochemiluminescence method (COBAS E 411; Roche Diagnostics).
In the Pima study, plasma insulin concentrations were determined by two different insulin assays over the course of data collection: (a) the modification of Yalow and Berson’s radioimmunoassay through charcoal method15 from 1982 to 1987 and (b) the Concept 4 analyser (Concept 4 ICN, Costa Mesa, California, USA) from 1987 to 1998. Pima study investigators used a regression equation, derived among individuals in whom both assays had been performed, to make values comparable across assays.
In both studies, BMI was categorized as <25, 25–29.9, and ≥30.0 kg/m2 (normal weight, overweight, and obese). Homeostasis model assessment of insulin resistance (HOMA-IR) was calculated as=fasting insulin (µU/L) × fasting glucose (nmol/L)/22.5 or (I0(µIU/mL) * G0 (mmol/L)/22.5) and insulin secretion as HOMA-B = (20 × Insulin)/(Glucose − 3.5) or (20*I0(µIU/mL)/G0 (mmol/L) − 3.5).16
Incident diabetes
In CARRS, all participants with self-reported diabetes or fasting blood glucose ≥7.00 mmol/L (126 mg/dL) or HbA1c≥6.5% (48 mmol/L) at baseline were excluded from the analysis. To ensure that measurements in Pima Indians were comparable with those in SA, we did not use the 2-hour glucose values for defining diabetes and excluded those with FPG ≥7.00 mmol/L, HbA1c≥6.5% or use of glucose lowering medication. Incident diabetes was defined as FPG ≥7.00 mmol/L (126 mg/dL), HbA1c≥6.5% (48 mmol/mol), or self-reported/physician diagnosed diabetes or glucose lowering medication use at any follow-up visit.
Statistical analysis
Baseline participant characteristics were examined for SA and Pima Indians. Incidence rates with 95% CI were computed over the time period from baseline to final available follow-up, excluding participants with diabetes at baseline according to any criteria. Person-years were estimated from the date of enrolment to the time of diabetes diagnosis or the last date of visit or death, whichever was documented earlier. Age-specific incidence (cases/1000 person-years) by sex and ethnicity was calculated. Age-standardized diabetes incidence (per 1000 person-years) standardized to World population by sex was also reported.17 BMI-specific incidence (cases/1000 person-years) of diabetes adjusted for age and stratified by sex and ethnicity was calculated using a Poisson model. The relative risks (incidence rate ratio (IRR)) and absolute risks (incidence rate difference) with 95% CI for Pimas versus SA (using SA as referent group) were estimated for all comparisons. Multivariable Cox proportional hazards models were used to assess the association of HOMA-IR and HOMA-B with incident diabetes, separately in the CARRS and Pima studies. Proportionality hazards assumptions (proportionality, interaction among predictors, time dependence) were evaluated and were satisfied.
We also conducted supplementary analyses among those without self-reported diabetes and with FPG <7.00 mmol/L (126 mg/dL) at baseline, with incident diabetes defined as those with FPG ≥7.00 mmol/L (126 mg/dL), or self-reported/physician diagnosed diabetes, or medication use at any time during follow-up (ie, without the HbA1c criterion). These supplementary analyses were undertaken as HbA1c may vary by ethnicity.18 All analyses were done using STATA V.16.0 (College Station, Texas, USA) or SAS V.9.4 (SAS Institute, Cary, North Carolina, USA).
Results
Baseline characteristics of the cohorts are shown in table 1. The median age (years) of SA and Pima Indians was 33.0 and 27.4 years, respectively. Overall, SA were considerably less obese (median BMI, SA: 24.4 kg/m2, and Pima Indians: 33.8 kg/m2; waist circumference, SA 82.5 cm, and Pima Indians: 107.0 cm), less insulin resistant (fasting insulin, SA: 53.5 pmol/L, and Pima Indians: 132.0 pmol/L). The baseline characteristics of the participants who developed incident diabetes during follow-up and those who remained diabetes free is shown in online supplemental table S1.
Supplemental material
Characteristics of study populations (excluding baseline diabetes)
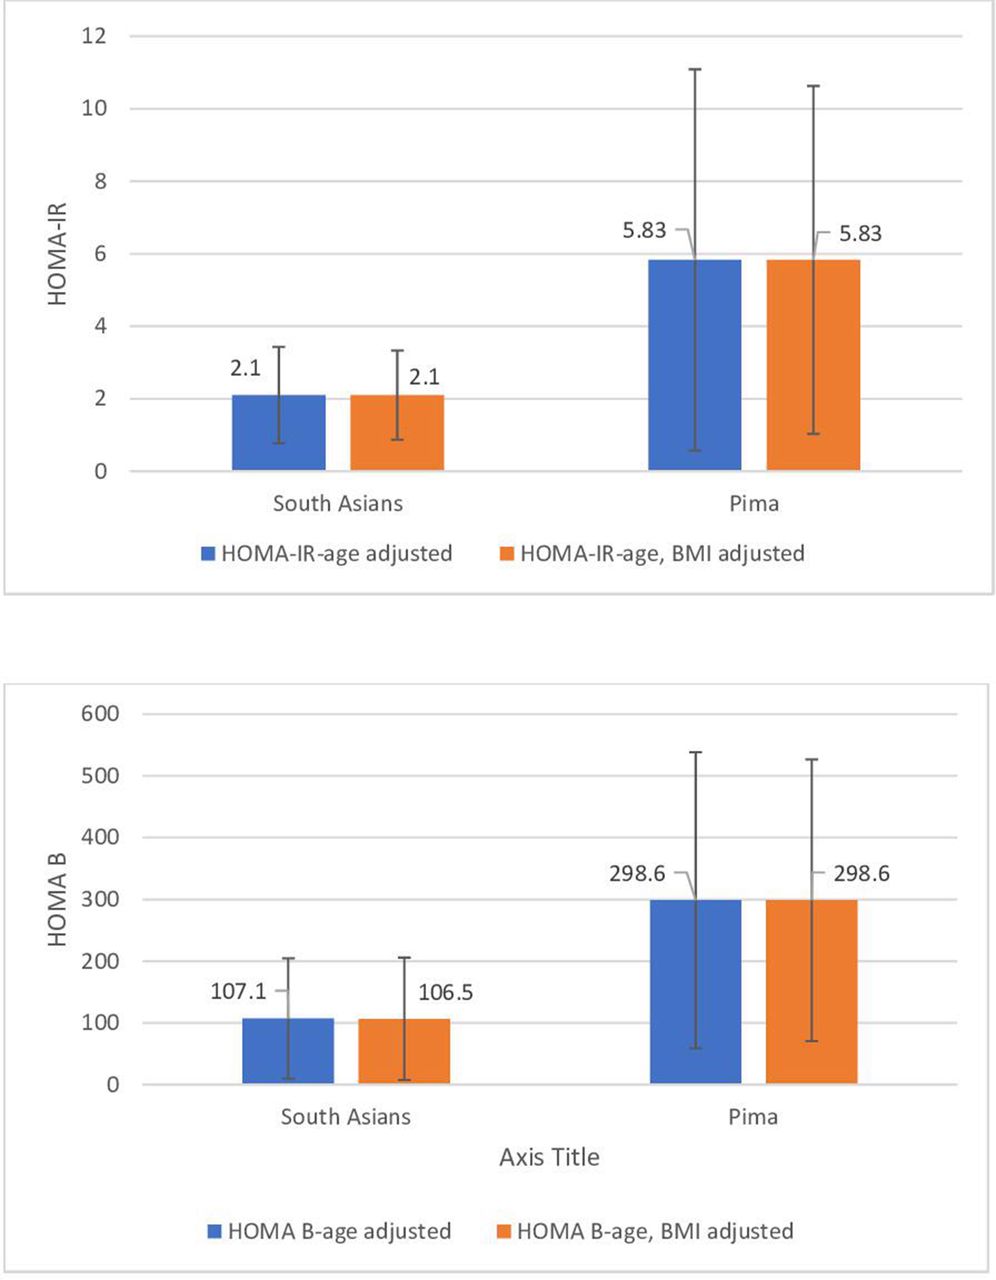
SA had lower HOMA-IR and had lower insulin secretion then Pima Indians (age-BMI adjusted HOMA-IR—SA: 2.1 µIU/mL/mmol/L and Pimas: 5.83 µIU/mL/mmol/L; age-BMI adjusted HOMA-B—SA: 106.5 µIU/mL/mmol/L and Pimas: 298.6 µIU/mL/mmol/L) (figure 1). Pima Indians had a higher prevalence of a positive family history of type 2 diabetes than SA (SA: 28.7% and Pimas: 69.3%).
Mean values for HOMA-IR (µIU/mL/mmol/L) and HOMA B (µIU/mL/mmol/L) adjusted by age and age/BMI HOMA-IR, homeostatic model assessment of Insulin resistance. BMI, body mass index; HOMA-B, homeostasis model assessment of β-cell dysfunction; HOMA-IR, homeostasis model assessment of insulin resistance.
The median (interquartile interval) duration of follow-up for SA and Pima Indians was 4.8 (3.8, 5.1) and 6.7 (3.7, 10.3) years, respectively. Among 6676 SA participants without diabetes at baseline (41.4% men), 461 incident cases of diabetes developed during follow-up. Among 1852 Pima Indian participants without diabetes at baseline (34.5% men), 510 incident cases of diabetes developed during follow-up. Table 2 details the age-specific diabetes incidence by sex in SA and Pima Indians, and also the relative risk and risk difference (using SA as reference). Age categories were defined by baseline age. In both populations, diabetes incidence increased with age. Overall age-standardized diabetes incidence (cases/1000 person-years, 95% CI) was lower in SA than in Pima Indians (men: 14.2 (12.2–16.2) vs 37.3 (31.8–42.8)); women: 14.8 (13.0–16.5) vs 46.1 (41.2–51.1)) (table 2). Overall, Pima men and women had 2.3 and 2.4 times higher diabetes incidence compared with SA (IRR (95% CI) (men: 2.31 (1.88, 2.86); women: 2.46 (2.09, 2.90)). Diabetes incidence was higher in Pima Indians in all age groups among both men and women. The risk of incident diabetes among participants aged 20–24 years in Pima Indians was six times and seven times higher in men and women as compared with SA men and women, respectively. However, the relative risk attenuated at older ages. Overall, the absolute risk difference of incident diabetes (cases/1000 person years) was higher in Pima Indians (ARD (95% CI: 22.9 (19.2 to 26.5)) compared with SA.
Age-specific Incidence (cases/1000 person-years) of diabetes by sex and ethnicity
Table 3 shows the age-adjusted diabetes incidence by BMI strata in both populations, and the relative risk and risk differences using SA as reference. In those with BMI <25 kg/m2, the risk of diabetes was over five times higher in 20–44-year-old SA men than in Pima men (SA vs Pimas-Men: 10.6 (8.1, 13.1) vs 2.0 (0, 6.0)), whereas in women with BMI <25 kg/m2, there was little difference between the two groups (SA vs Pimas-Women 8.3 (6.0, 10.6) vs 8.9 (1.1, 16.9)) (table 3). Among those with BMI ≥30 kg/m2, diabetes incidence in SA men was nearly as high as in Pima men (SA vs Pimas-Men: 45.6 (30.6, 60.5) vs 48.1 (40.4, 55.8)).
BMI-specific incidence (cases/1000 person-years) of diabetes by sex and ethnicity
Given that >85% of Pima Indian participants were obese by BMI classification, we also performed analysis based on strata of waist circumference, using several definitions of cut-points (table 4). Similar to findings based on BMI strata, the number of incident cases and incidence rates were consistently lower in the normal waist circumference strata among Pima than in SA.
Waist circumference-specific Incidence (cases/1000 person-years) of diabetes by sex and ethnicity
In multivariable analysis (table 5), using Cox’s proportional hazards models, adjusting for age, sex, BMI, family history of diabetes, HOMA-IR (standardized), and HOMA-B (standardized), the effect of age, sex, and BMI were similar for both SA and Pima Indians. Family history had a larger hazard rate ratio (HRR) (HR (95% CI)-SA: 2.02 (1.56 to 2.61); Pimas: 1.15 (0.94 to 1.40)) and insulin resistance a smaller HRR for incident diabetes in SA compared with Pima Indians (HR (95% CI)-SA: 2.86 (2.28 to 3.58); Pimas: 14.40 (3.49 to 5.56)).
Factors associated with diabetes incidence by ethnicity, Cox proportional hazards analysis
We repeated all analyses using diabetes defined as FPG≥7.00 mmol/L (126 mg/dL) or glucose lowering medication, and the pattern of results was similar to the primary analyses (online supplemental tables).
Discussion
In the prospective cohort analysis of young SA compared with similar aged Pima Indians, we found that the overall age-standardized diabetes incidence was lower in SA than in Pima Indians. SA were considerably less obese and less insulin resistant but significantly more insulin deficient than Pima Indians. Among those aged 20–24 year old, the risk of incident diabetes was six to seven times in Pima Indians than in SA, but the relative risk attenuated at older ages. However, in those with BMI <25 kg/m2, the risk of diabetes was over five times higher in SA men than in Pima Indian men, and in those with BMI ≥30 kg/m2, diabetes incidence in SA men was nearly as high as in Pima men.
Our estimates for diabetes incidence in Pima Indians and SA appear to be in line with existing literature on diabetes risk across these high-risk ethnicities. First, the diabetes incidence rates for Pima Indians reported in our study were consistent with other published longitudinal studies in this community of Pima Indians, at approximately 25 cases per 1000 person years. These estimates have remained consistent since 1965.19 Similarly, diabetes incidence rates in SA reported in this study appear to be consistent with smaller, external data sources. The CURES study in Chennai, India20 suggested an annual progression rate of 6.8% for those with impaired glucose tolerance, a rate that was similar to rates in control groups of diabetes prevention trials in India.21–23 Both SA and Pima Indians have substantially higher incidence rates of diabetes compared with that observed in people of non-Hispanic white populations with impaired glucose tolerance (IGT).24 25
The results of our study found consistent trends when comparing incidence rates between SA and Pima Indians, with one notable exception: diabetes incidence rates in normal weight individuals. Here, we found that SA men have greater incidence rates of diabetes than Pima Indian men at non-obese BMI levels. Existing literature on diabetes risk in normal weight individuals suggests that the most frequent metabolic abnormality among unhealthy, normal weight individuals may be poor insulin secretion,26 and SA may disproportionately have poorer beta cell reserve compared with other ethnicities4 6 27 due to fasting hyperglycemia,9 which, when present, may represent a loss of beta cell function by 75%.28 It is possible that without the metabolic burden of insulin resistance that is correlated with high BMI, SA men may still be predisposed to poor beta cell function and hepatic glucose over production, thereby leading to diabetes development even at low body weight.
We note that non-obese SA men, but not women, were found to have higher diabetes incidence compared with Pima Indians. Men may be more likely to develop fasting hyperglycemia, whereas women may be more likely to develop hyperglycemia through postprandial glucose excursions compared with men (and fasting state glucose excursions),29–32 and in a non-obese state, SA men (but not women) may be more likely to develop hyperglycemia due to higher occurrence of fasting hyperglycemia. Differences in men versus women may be driven by several factors, including enhanced glucose effectiveness and improved insulin secretion for any given level of insulin action, as observed in women,33 and elevated sex hormones (ie, circulating estrogens before menopause).34 While sex differences were observed, non-obese diabetes rates in SA women are still high and would be considered ‘high-risk’ compared with other ethnicities.
The limitations of this study included a lack of full spectrum of ages across adults. We were limited to ages 20–44, as relatively few new cases existed in the Pima Indian data above the age of 45. The period of data collection in the two cohorts also differed; however, our analysis is focused on pathophysiological differences (insulin action, insulin deficiency) in two populations, and furthermore, the explosion of diabetes in India is recent while that in the Pima Indians occurred three decades earlier. We, however, standardized for age to improve comparison. Our measures of insulin resistance and insulin secretion were limited to epidemiological measures of HOMA-IR and HOMA-B. However, these measures are considered relatively robust and useful in population studies and have been validated against gold standards.9 Insulin assays were not done at the same time or using the same methods in the two populations, and, thus, the comparisons of insulin measures at baseline are potentially biased. However, HRs of variables standardized within population show a stronger effect of HOMA-IR in Pima Indians than in SA, and a comparable HR for HOMA-B. This suggests a greater relative contribution of insulin resistance to incident diabetes in Pimas and a greater relative contribution of insulin secretory dysfunction in SA.
Our study has a number of important strengths. Building on the hypotheses generated from a previous cross-sectional comparison of the two populations,9 we have now extended the investigations to prospective analyses of cohort data across weight and glucose spectrum. The cohorts have objective measures of weight and height, and diabetes is defined through measurements of glycemia and not reliant on self-report. To account for population differences in HbA1c, we also conducted supplementary analyses with definitions of diabetes without HbA1c and found similar patterns of differences between SA and Pima Indians.
Intriguingly, diabetes incidence is higher in non-obese SA than Pima men but not women. In obese SA, diabetes incidence is perilously close to that in Pima Indians. This is a cause for major concern, as obesity levels continue to rise in South Asia.35–37 However, SA are also at high risk for diabetes at low levels of BMI, and several studies point to the increased prevalence of diabetes in SA at lower BMI compared with other race/ethnic groups.3 38–40 There is also evidence to suggest that SA are at high risk for incident diabetes at low BMI. A study comparing the incidence rates of diabetes across race/ethnic groups and BMI strata in Ontario, Canada found that the incidence rate of diabetes was three times higher in normal weight (BMI 18.5–25 kg/m2) SA than in White Canadians.38 In our study comparing the age, sex, and BMI specific incidence of diabetes in two high risk groups, Pima Indians and SA, we found that while Pima Indians had overall higher rates of diabetes, at BMI ≤25 kg/m2 the incidence rate for SA men was five times greater than that for Pima Indian men. These results suggest that interventions aimed at diabetes prevention in SA populations may need to target all BMI strata including those with normal weight or underweight BMI.
The results of our study also indicate differing pathophysiological mechanisms of diabetes development between Pima Indians and SA. A previous cross-sectional analysis examining insulin resistance and insulin secretion in the same population of Pima Indians and SA noted that SA had considerably lower mean BMI compared with Pima Indians and that the association of insulin resistance with newly diagnosed diabetes was stronger in Pima Indians whereas the association with insulin secretory dysfunction was stronger in SA.9 Our present study indicates that insulin resistance is more strongly associated with incident diabetes in Pima Indians compared with SA, thereby indicating differences in the primary defect of diabetes development between the two groups. This has major implications for race/ethnicity-specific diabetes treatment guidelines.41
In conclusion, in this study of prospective data from two longitudinal cohorts of high-risk individuals, we found that Pima Indians had a high age-standardized diabetes incidence at all ages compared with SA, although the risk ratio narrowed at older ages. However, diabetes incidence was higher in non-obese SA men than in Pima Indian men but not in women. In obese SA, diabetes incidence is perilously close to that in Pima Indians. The effect of family history was larger in SA, whereas that of HOMA-IR was larger in Pima Indians, thereby indicating a differential need for therapeutics and prevention efforts in these two high-risk populations.
Acknowledgments
The authors thank the staff and participants of the CARRS and Pima study for their important contributions.
References
Supplementary materials
Supplementary Data
This web only file has been produced by the BMJ Publishing Group from an electronic file supplied by the author(s) and has not been edited for content.
Footnotes
Contributors Conceptualization: KMVN, MKA, DP, NT, VM, SAP, DK, DM, RS, RMA, and RH. Data curation: DK and SK. Formal analysis: DK, SK, and HHC. Writing—original draft: KMVN; writing—review and editing: DK, SAP, UPG, LRS, DP, NT, MKA, ES, VM, RH, SK, ND, HHC, MK, DM, RS, and RMA. All authors have read and agreed to the published version of the manuscript.
Funding The CARRS Study was funded in part by the National Heart, Lung, and Blood Institute (NHLBI), National Institutes of Health (NIH), Department of Health and Human Services, under Contract No. HHSN268200900026C and the United Health Group, Minneapolis, MN, USA. KMVN, MKA, UPG, and SAP were funded in part by the National Institute of Diabetes and Digestive and Kidney Diseases of the National Institutes of Health under Award Number P30DK111024. KMVN was funded in part for ‘Worksite Lifestyle Program for Reducing Diabetes and Cardiovascular Risk in India’ project funded by NHLBI, NIH Department of Health and Human Services under Award number R01HL125442. SAP was funded in part by Department of Health and Human Services, National Institutes of Health, NHLBI under Award Number 5U01HL138635-02. SAP, KMVN, MKA, NT, and DP were supported in part by the National Heart, Lung, and Blood Institute (NHLBI) of the National Institutes of Health (NIH), award number 5U01HL138635 under the Hypertension Outcomes for T4 Research within Lower Middle-Income Countries (Hy-TREC) program. RS was supported by a Wellcome Trust Capacity Strengthening Strategic Award Extension phase to the Public Health Foundation of India and a consortium of UK universities (WT084754/Z/08/A) and was supported by grant number 1 D43 HD065249 from the Fogarty International Center and the Eunice Kennedy Shriver National Institute of Child Health and Human Development at the National Institutes of Health. DK has been supported by Fogarty International Center for PH leader Course, National Institutes of Health under grant number (D43TW009135). The Pima Indian study was supported by the intramural research program of the National Institute of Diabetes and Digestive and Kidney Diseases.
Competing interests None declared.
Patient consent for publication Not required.
Ethics approval CARRS-surveillance study has been approved by the Institutional Review Boards (IRBs) of Public Health Foundation of India, New Delhi; All India Institute of Medical Sciences (IEC/NP-17/07.09.09), New Delhi; Madras Diabetes Research Foundation (MDRF/EC/EPI/2009/10), Chennai, India; Aga Khan University (1468-CHS-ERC-2010), Karachi, Pakistan; and Emory University, Atlanta, USA. In addition, the study has received regulatory approval from the National Heart, Lung, and Blood Institute (NHLBI), National Institutes of Health (NIH), USA and the Health Ministry Screening Committee of India, New Delhi.
Provenance and peer review Not commissioned; externally peer reviewed.
Data availability statement Data are available on reasonable request. Please contact KMVN for data request.
Supplemental material This content has been supplied by the author(s). It has not been vetted by BMJ Publishing Group Limited (BMJ) and may not have been peer-reviewed. Any opinions or recommendations discussed are solely those of the author(s) and are not endorsed by BMJ. BMJ disclaims all liability and responsibility arising from any reliance placed on the content. Where the content includes any translated material, BMJ does not warrant the accuracy and reliability of the translations (including but not limited to local regulations, clinical guidelines, terminology, drug names and drug dosages), and is not responsible for any error and/or omissions arising from translation and adaptation or otherwise.