Article Text

Abstract
Introduction It is increasingly recognized that type 2 diabetes (T2D) is a heterogenous disease with ethnic variations. Differences in insulin secretion, insulin resistance and ectopic fat are thought to contribute to these variations. Therefore, we aimed to compare postprandial insulin secretion and the relationships between insulin secretion, insulin sensitivity and pancreatic fat in men of black West African (BA) and white European (WE) ancestry.
Research design and methods A cross-sectional, observational study in which 23 WE and 23 BA men with normal glucose tolerance, matched for body mass index, underwent a mixed meal tolerance test with C peptide modeling to measure beta cell insulin secretion, an MRI to quantify intrapancreatic lipid (IPL), and a hyperinsulinemic-euglycemic clamp to measure whole-body insulin sensitivity.
Results Postprandial insulin secretion was lower in BA versus WE men following adjustment for insulin sensitivity (estimated marginal means, BA vs WE: 40.5 (95% CI 31.8 to 49.2) × 103 vs 56.4 (95% CI 48.9 to 63.8) × 103 pmol/m2 body surface area × 180 min, p=0.008). There was a significantly different relationship by ethnicity between IPL and insulin secretion, with a stronger relationship in WE than in BA (r=0.59 vs r=0.39, interaction p=0.036); however, IPL was not a predictor of insulin secretion in either ethnic group following adjustment for insulin sensitivity.
Conclusions Ethnicity is an independent determinant of beta cell function in black and white men. In response to a meal, healthy BA men exhibit lower insulin secretion compared with their WE counterparts for their given insulin sensitivity. Ethnic differences in beta cell function may contribute to the greater risk of T2D in populations of African ancestry.
- diabetes mellitus
- type 2
- ethnic groups
- insulin secretion
- body fat distribution
This is an open access article distributed in accordance with the Creative Commons Attribution Non Commercial (CC BY-NC 4.0) license, which permits others to distribute, remix, adapt, build upon this work non-commercially, and license their derivative works on different terms, provided the original work is properly cited, appropriate credit is given, any changes made indicated, and the use is non-commercial. See: http://creativecommons.org/licenses/by-nc/4.0/.
Statistics from Altmetric.com
Significance of this study
What is already known about this subject?
People of black African ancestry demonstrate hyperinsulinemia in response to intravenous glucose.
This is thought to represent ‘beta cell upregulation’, an exaggerated insulin secretory response.
Pancreatic fat accumulation is thought to be closely related to insulin hypersecretion in this ethnic group.
What are the new findings?
In response to a physiological stimulus, when insulin sensitivity and insulin clearance are taken into account, black West African men secrete less insulin than their white European peers.
Ethnicity is independently associated with insulin secretion.
Pancreatic fat does not appear to play an independent role in insulin secretory response in either ethnic group.
How might these results change the focus of research or clinical practice?
This study highlights the importance of methodology in the investigation of ethnic differences in beta cell function.
The findings generate the hypothesis that relative impairments in beta cell function may contribute to the greater risk of type 2 diabetes in populations of African ancestry.
The findings raise awareness of the heterogeneity of metabolic phenotypes in different ethnic groups.
Introduction
Populations of black African (BA) ethnicity have a higher prevalence1 2 of type 2 diabetes (T2D) compared with those of white European (WE) ethnicity. While there is evidence that part of the disparity is due to environmental and cultural factors such as socioeconomic status, diet and rates of obesity, the latter particularly in African-American women,3–5 studies which adjust for these variables have found persistently higher rates of T2D in BA populations.6 7
Not only is the prevalence of T2D in BA higher compared with the general population, there are also distinctive features in their phenotype. BA develop T2D at an earlier age (up to 10 years younger)8 9 and at a lower body mass index (BMI) than WE, with modeling of UK Biobank data demonstrating that the risk of T2D in a WE subject with a BMI of 30 kg/m2 is equivalent to the risk in a BA subject with a BMI of 26 kg/m2.10 BA exhibit a more aggressive phenotype of disease, with poorer glycemic control at diagnosis11 and higher rates of complications.12 They may have poorer responses to certain standard therapies13 and they are more likely to have atypical presentations of T2D such as ketosis-prone diabetes. These differences have important implications for screening, diagnosis and effective treatment in this ethnic group.
Physiological studies have identified characteristic features of insulin dynamics in BA ancestry populations which may help account for some of these differences. Healthy BA subjects are reported to exhibit ‘beta cell upregulation’, with hypersecretion of insulin in excess of what is required to overcome their prevailing insulin resistance.14–16 It has also been shown that in BA subjects, intrapancreatic lipid (IPL) is more strongly associated with greater compensatory insulin secretion17 and is a better predictor of glucose intolerance compared with other ethnic groups.18
However, the majority of these studies have been undertaken in African-American subjects and it is not known whether their findings can be equally applied to other populations of African ancestry, who are of diverse genetic admixture and who may have been exposed in utero or early life to undernutrition rather than energy excess.19 20 Furthermore, study methodologies may have a significant impact on the findings made. Beta cell hypersecretion in BA has been demonstrated largely using intravenous glucose stimulation techniques,21 but the intravenous route does not take account of the effects of factors such as neural and gut signals (including the incretin system), protein and fat ingestion, carbohydrate absorption rates, or first-pass splanchnic glucose extraction rates, all of which influence the complex dynamic system of beta cell insulin response in vivo. Second, multiple studies which have reported insulin hypersecretion in BA populations are based on measurements of peripheral insulin concentrations only.14 22 23 Insulin clearance is lower in BA compared with WE subjects24 25; therefore measurement of peripheral insulin levels alone may overestimate beta cell insulin secretion in BA populations. The measurement of C peptide, which enables the effect of insulin clearance to be taken into account, is necessary when assessing beta cell function in this ethnic group.
Hence, our aim was to assess beta cell insulin secretion and its relationship with pancreatic fat in healthy men of black West African and white Northern European ethnicity using physiological methods which account for insulin clearance. To our knowledge, this is the first examination of the relationship between beta cell function and IPL in healthy BA adults which uses modeled C peptide data from mixed meal tolerance test (MMTT).
Materials and methods
Study design
The data were collected as part of ‘Soul-Deep II’, a cross-sectional study of ethnic differences in the development of T2D in men from two ethnic groups, WE and BA. Metabolic assessments were performed at the Clinical Research Facility, King’s College Hospital, London, UK, while MRI took place at Guy’s Hospital, London, UK. Recruitment of subjects and data collection took place between April 2016 and May 2018. Recruitment was carried out through advertising in the local press and via general practice surgeries. All subjects provided written informed consent prior to the study.
Subjects
Subjects were invited to a screening assessment at the Clinical Research Facility at King’s College Hospital, following a 10-hour fast, in order to undertake a screening questionnaire, anthropometric measurements and a 2-hour 75 g oral glucose tolerance test. Eligible subjects self-identified as either white (Northern) European or black (West) African (reporting four grandparents in the relevant ethnic group) and were normally glucose-tolerant according to the WHO criteria.26 Anthropometric measurements included height, weight, waist circumference and seated blood pressure.
Exclusion criteria were a diagnosis of diabetes or impaired glucose tolerance; treatment with oral hypoglycemics, glucagon-like peptide 1 analogs, insulin, systemic steroids or beta blockers; any condition or medication considered by the investigators to have significant impact on the study protocol or outcomes; serum creatinine of >150 mmol/L; serum alanine transaminase level >2.5-fold above the upper limit of the reference range; and sickle cell disease (trait permitted). Participants were instructed to refrain from (1) strenuous physical activity for 48 hours, (2) alcohol consumption for 24 hours, and (3) food and drink (other than water) for at least 10 hours prior to the study visits. Study visits were completed in random order with a minimum of 7 days between visits. Participants were mandated to complete all study visits within a maximum period of 6 months.
MMTT assessment of insulin secretion
Following an overnight fast, a cannula was inserted into the antecubital fossa vein of the subject’s non-dominant arm and two fasting blood samples drawn 10 min apart (−10, 0). A specified volume of Ensure Plus milkshake drink (63% carbohydrate, 22% protein and 15% fat) (Abbott Nutrition, UK) was calculated based on six calories (4 mL) per kilogram body weight. The drink was consumed by the subject within a 5 min period. Blood samples were taken at 10, 20, 30, 40, 50, 60, 75, 90, 120, 150, and 180 min for assessment of glucose, C peptide, insulin, glucagon and non-esterified fatty acid (NEFA) concentrations. Glucagon-like peptide 1 (GLP-1) and gastric inhibitory peptide (GIP) were assessed at −10, 0, 30, 60, and 120 min.
Hyperinsulinemic-euglycemic clamp assessment of insulin sensitivity
The method has been reported.27 In brief, participants were admitted to the Clinical Research Facility following an overnight fast and weighed in light clothing. Blood samples were taken at −30, –20, −10 and 0 min for basal assessments. A 240 min two-step clamp began at 0 min. Euglycemia (5.0 mmol/L) was achieved using variable rate 20% (wt/vol) dextrose. Blood was drawn at 150, 180, 210, 220, 230 and 240 min for assessment of plasma glucose concentration and insulin concentration. Whole-body insulin sensitivity was assessed in the second half of the 240 min two-step clamp (high-dose insulin phase; 40 mU/m2 body surface area/min) and expressed as the M value corrected for steady-state insulin concentrations during this phase of the clamp (M/I).
MRI assessment of IPL and visceral fat
The MRI protocol has been reported.28 In brief, a Dixon-based MRI sequence was used on a 1.5 Tesla Siemens scanner to obtain images from the neck to the knee (excluding the arms), and 384 contiguous, axial T1-weighted, gradient-echo images with a slice thickness of 3 mm were acquired, from which fat and water images were produced as part of the Dixon sequence. MRI data were analyzed using the open source image analysis software Horos V.1.1.7 (www.horosproject.org; accessed October 21, 2017) by a single analyst who was blinded to clinical data.
IPL was measured by selecting three circular regions of interest (ROIs) of approximately 1 cm2, placed on each of the head, body and tail regions of the pancreas. In each ROI, pancreatic fat fraction was quantified using the formula: %IPL=(F/(F+W))×100, where F is the pixel signal intensity of the fat image and W is the pixel signal intensity of the water image. Mean IPL was calculated as the mean of the head, body and tail IPL.
Areas of visceral adipose tissue were quantified from an axial MRI at the L4–L5 spinal anatomical position.
Biochemical analyses
Plasma glucose concentrations were determined by an automated glucose analyzer (2300 STAT Glucose Analyzer, Yellow Springs Instrument, Ohio, USA); serum insulin concentrations by immunoassay using chemiluminescent technology (ADVIA Centaur System, Siemens Healthcare, Camberley, UK); serum C peptide concentrations by radioimmunoassay (Millipore, Hertfordshire, UK); GLP-1 and GIP (total) concentrations by fluorescent ELISA methods (EGLP-35K and EZHGIP-54K, Merck Millipore, UK); plasma glucagon by immunoassay (Meso Scale Discovery, Maryland, USA); and NEFA concentrations by enzymatic colorimetric assay (Wako Diagnostics, Richmond, Virginia), on an automated clinical chemistry analyzer (ILab 650; Instrument Laboratories, Holliston, Massachusetts).
Calculations
The incremental areas under the curve (iAUC) were calculated using the trapezoid rule for glucose, insulin, C peptide, glucagon, GIP, GLP-1 and NEFAs.
The glucose and C peptide curves during the meal tolerance test were modeled using reported methods in order to determine total postprandial endogenous beta cell insulin secretion (AUCISR).29 30 Model assessments were carried out using SAAM II V.1.2 software (SAAM Institute, Seattle, Washington).
During the meal test, mean (endogenous) insulin clearance was calculated according to the following formula30:

where AUCISR is the area under the curve of insulin secretion rate, AUCI is the area under the curve of insulin concentration, IFinal is the insulin concentration at the end of the study, IBasal is the insulin concentration at the beginning of the study, and MRTIns is the mean residence time of insulin, which was assumed to be 18 min as reported in Navalesi et al.31
Statistical analysis
Data were collected as part of the SouL-Deep II study, which included 20 samples per group to allow the detection of a difference of 1 SD with a power of 90% and two-sided significance in the primary outcome variable of beta cell insulin secretory function. Log transformation was used on skewed variables that showed a significant deviation from normality to achieve a normal distribution prior to the use of parametric tests. Significance of differences in variables between the two ethnic groups was made using independent samples t-test. Insulin clearance was adjusted for insulin sensitivity (M/I) with one-way analysis of covariance.
The strength of linear relationships between variables of interest was assessed using Pearson’s correlation. Interactions by ethnicity were assessed using a linear regression with ethnicity*IPL. Partial correlation analysis controlling for M/I was performed.
A multiple regression model was run to predict insulin secretion (AUCISR) with covariates of ethnicity, insulin sensitivity (M/I) and IPL. Analyses were conducted with SPSS V.25.0, and p values <0.05 were considered statistically significant.
Results
Participant characteristics
The characteristics of the 23 BA and 23 WE participants are presented in table 1. Nine out of 23 BA men were born in either Nigeria or Ghana, with the remainder born in the UK. The two ethnic groups were similar in age, weight and BMI and showed no differences in fasting glucose, blood pressure or low-density lipoprotein (table 1). BA men had lower fasting triglyceride levels (table 1) and lower visceral fat (table 2).
Clinical characteristics of study participants
Metabolic measurements in BA and WE men
Beta cell insulin secretory function
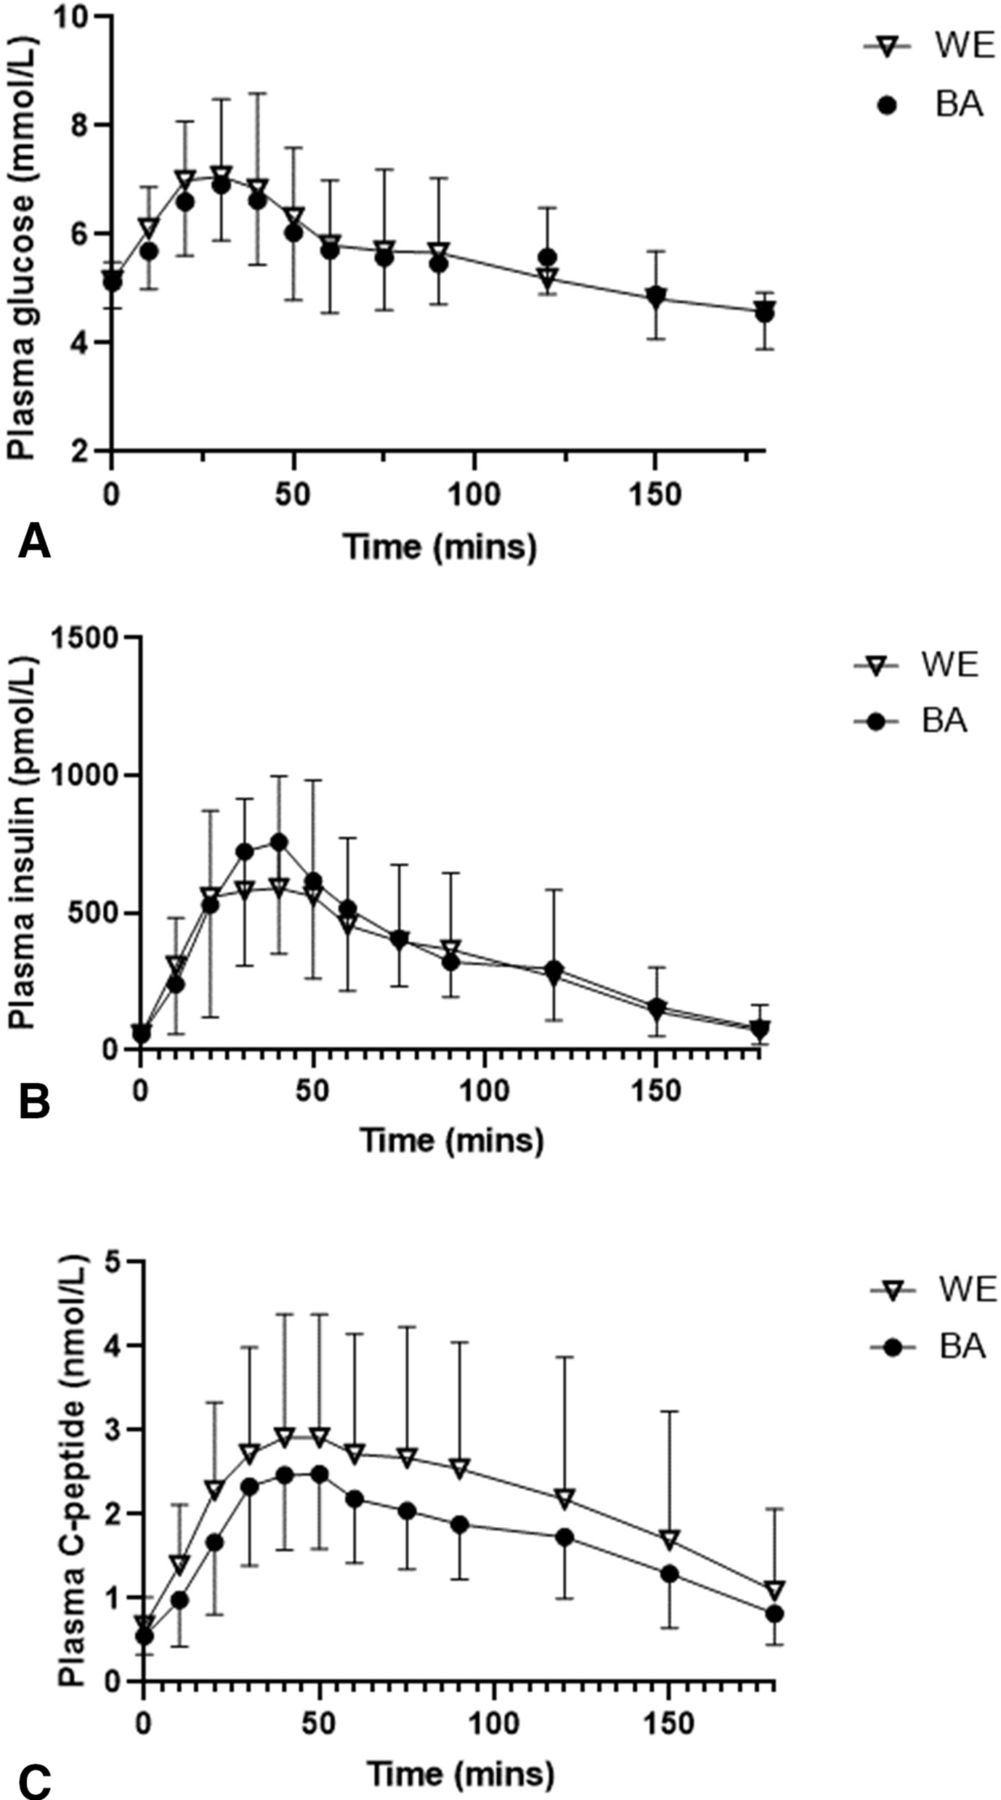
The glucose, insulin and C peptide responses to the meal test are shown in figure 1. There were no ethnic differences in the fasting or postprandial responses (iAUC) of glucose, insulin, C peptide or beta cell insulin secretion (AUCISR) (figure 1, table 2). However, after adjusting for insulin sensitivity (M/I), beta cell insulin secretion (AUCISR) was lower in BA men (estimated marginal mean in BA vs WE: 40.5 (95% CI 31.8 to 49.2) × 103 vs 56.4 (95% CI 48.9 to 63.8) × 103 pmol/m2 body surface area × 180 min, p=0.008).

Plasma (A) glucose, (B) insulin and (C) C peptide responses by ethnic group during the mixed meal tolerance test (data shown are mean and SD). BA, black African; WE, white European.
Insulin clearance
The mean whole-body endogenous insulin clearance was significantly lower in BA men before and after adjustment for insulin sensitivity (M/I) (p=0.006).
Whole-body insulin sensitivity
As previously reported,27 there were no significant ethnic differences in mean whole-body insulin sensitivity (expressed as M/I, included in table 2 for reference).
Pancreatic fat
As previously reported,28 there were no significant ethnic differences in mean IPL (included in table 2 for reference).
Incretin, glucagon and NEFA responses
Fasting and postprandial GIP, GLP-1, glucagon and NEFAs are shown in table 2; there were no ethnic differences in either the fasting or postprandial responses.
Relationships between beta cell insulin secretory function and IPL
IPL was positively correlated with endogenous insulin secretion (AUCISR; r=0.59, p=0.003) in WE men; however, this correlation was not statistically significant in BA men (r=0.32, p=0.206) and a significant interaction by ethnicity was found (interaction test, p=0.036; figure 2A). Following adjustment for insulin sensitivity (M/I), there was no significant association between IPL and insulin secretion in either WE men (r=−0.067, p=0.767) or BA men (r=0.063, p=0.816). IPL was negatively correlated with insulin sensitivity in WE alone (r=−0.68, p<0.005), but there was no interaction by ethnicity (p=0.114) (figure 2B).

Relationships between IPL and (A) insulin secretion and (B) insulin sensitivity by ethnicity. AUCISR, area under the curve of beta cell insulin secretion rate; BA, black African; BSA, body surface area; FFM, fat-free mass; IPL, intrapancreatic lipid; M/I, insulin sensitivity corrected for insulin concentrations; WE, white European.
A linear multiple regression model was run to predict insulin secretion (AUCISR), with ethnicity, pancreatic fat (IPL) and insulin sensitivity (M/I) as covariates (model 1; see table 3). Overall, the model (r2=0.728) significantly predicted insulin secretion (p<0.005); both insulin sensitivity (p<0.005) and ethnicity (p=0.01) were independent predictors of insulin secretion, but pancreatic fat did not contribute significantly to the variation. Tests for multicollinearity between these variables were within tolerance levels (all variance inflation factors <2.0). Inclusion of age and visceral fat as covariates (model 2) did not significantly alter the model outputs.
Multiple regression analysis of predictors of beta cell insulin secretion
Discussion
Role of IPL in beta cell insulin secretion in WE and BA men with normal glucose tolerance
The role of pancreatic steatosis in metabolic disorders has received much attention, with the observation of the recovery of beta cell function and the reversal of T2D in association with the mobilization of pancreatic fat.32 There is evidence that the accumulation of intracellular triglyceride induces metabolic stress in the beta cells of the pancreas, leading to beta cell dysfunction and apoptosis.33 34 Clinical studies have also demonstrated an association between levels of IPL and impaired insulin responses in vivo.17 35 36
In this context, the pathogenesis of glucose intolerance in BA populations appears paradoxical, as they demonstrate a relatively higher prevalence of T2D,1 2 despite lower levels of pancreatic fat when compared with WE populations.17 37 38 We observed a positive correlation between IPL and insulin secretion in WE men, which was not found in BA men. However, following adjustment for the impact of insulin sensitivity, the association between IPL and insulin secretion was not significant in either ethnic group. In this study, with the acknowledgment that this was a healthy and non-obese population, pancreatic fat appears to be a proxy of insulin sensitivity and plays a surrogate role rather than directly affecting beta cell function. The role of IPL in the determination of beta cell function remains disputed, and other clinical studies have also failed to find a direct relationship in multiple ethnic groups,37 39–42 regardless of glucose tolerance status.
In contrast to our findings, Szczepaniak et al17 found that in BA subjects without diabetes, small increments in pancreatic fat were accompanied by a large linear increase in insulin secretion. They suggested that the strong relationship they observed between pancreatic triglyceride and insulin secretion in African ancestry adults was consistent with free fatty acid stimulation of the beta cell, either directly or secondarily to the promotion of insulin resistance.17 This was not the case in our subjects, in keeping with other investigations,37 despite the comparable numbers of participants. The reasons for our contrasting findings may be related to the populations under investigation; our BA subjects were mildly overweight with a mean BMI of 26.7 (SD=3.6) kg/m2, while the BA subjects in Szczepaniak et al17 were obese with a mean BMI of 32.2 (SD=2.2) kg/m2. Different techniques were used in the two studies; we used fat-water MRI to measure pancreatic fat fraction rather than magnetic spectroscopy; the former may be a superior modality for fat quantification owing to the irregular size and morphology of the pancreas.43 We modeled C peptide responses following an MMTT in place of using AIRg (acute insulin response to glucose) as a measure of insulin secretory response. The use of AIRg without C peptide measurement may overestimate beta cell insulin secretion due to the significantly lower rates of insulin clearance in subjects of African ancestry21 24; hence, our methods overcame this particular limitation. Lastly, we adjusted our findings for insulin sensitivity, enabling examination of the relationship between IPL and insulin secretion while taking prevailing insulin sensitivity into account as a confounding factor.
Ethnic comparison of postprandial insulin secretion
In BA subjects with both normal glucose tolerance and T2D, studies have consistently recognized a hyperinsulinemic response to glucose in comparison with their WE peers.14 22 44–46 While the hyperinsulinemia of BA populations is in part a compensation for insulin resistance, they also appear to have an exaggerated beta cell response, with excessive insulin secretion independent of insulin sensitivity.14–16 47 Such an observation has led to the hypothesis of ‘upregulated beta cell function’ in BA subjects, whereby the beta cell appears to be excessively responsive to glucose.16 47 48
By contrast, in this study we found that there was no evidence of postprandial insulin hypersecretion in BA men and, against our expectations, insulin secretion was lower in BA compared with WE men following adjustment for insulin sensitivity. Furthermore, the peripheral insulin response to oral nutrients in BA subjects did not replicate the very marked hyperinsulinemia both we and others have seen in response to intravenous glucose challenges in this ethnic group and indeed in these same study subjects.24 49–51 The absence of hyperinsulinemia in BA in response to a mixed meal—in comparison with the profound hyperinsulinemia of the same study subjects in response to intravenous glucose24—has also been reported elsewhere.52
The discrepancy may be explained by the multiple variables which do not come into play during intravenous glucose stimulation tests, predominantly gut signals, although in this study no significant ethnic differences were found in either fasting or postprandial GLP-1 or GIP. Intravenous and oral challenges also differ in the magnitude, duration and kinetics of the glycemic load which is delivered to the beta cell and which during the MMTT is not under direct control of the investigator. Evidence for beta cell hypersecretion in BA is far more variable following oral compared with intravenous tests,21 perhaps because of these factors. None of the studies to date which have used the MMTT have shown hypersecretion of total endogenous insulin in BA adults,49 53–56 while multiple investigators have documented relatively lower C peptide responses in response to oral glucose in BA subjects.57–59 Therefore, the preponderance of intravenous studies in the literature may not be wholly representative of the underlying physiology of BA populations.
Examining the data following adjustment for insulin sensitivity, it appears that BA men exhibit lower beta cell insulin secretion during the meal in the context of lower insulin clearance, thereby maintaining a postprandial glucose and insulin profile very similar to that of WE men. The lower rates of insulin clearance in BA subjects, a widely and consistently reported phenomenon,16 25 60 may from this perspective be an appropriate and adaptive response to maintain peripheral insulin levels in the face of lower beta cell insulin secretion. We have previously demonstrated comparatively greater insulin secretory deficits in BA compared with WE men with T2D.30 We postulate that the comparatively reduced insulin secretion in healthy BA men may contribute to their risk of glucose intolerance should insulin resistance develop, a hypothesis that has also been proposed by others.61
The reasons for the marked differences between our study findings and many others should be addressed. The majority of the literature in this area pertains to African-American populations (30 out of 41 studies in a systematic review21), with relatively few studies in other populations of African ancestry; our participants were strictly of direct West African ancestry, reporting both parents and four grandparents born in countries of West Africa (Ghana and Nigeria). Differences in both genetic traits and environment (such as diet and obesity rates) may underlie distinct metabolic phenotypes in BA. A recently identified novel genomic locus associated with T2D in a population consisting of Nigerians, Ghanaians and Kenyans is linked to beta cell apoptosis and impaired insulin secretory responses,62 and the typical phenotype of sub-Saharan Africans with T2D is leaner, younger and characterized by insulin deficiency.61 63 A comparative study has identified insulin responses two to three times higher in African-Americans without diabetes compared with native Nigerians,64 while insulin deficiency rather than insulin hypersecretion has been identified in healthy black South Africans compared with their white counterparts.65 66 In accordance with these observations, it is hypothesized that indigenous BA populations are more vulnerable to beta cell dysfunction, possibly due to the transgenerational effects of perinatal malnutrition.67
Sex differences in BA populations may also come into play. The preponderance of literature in this area pertains to women, who make up approximately 75% of BA subjects studied.21 For example, in contrast to our findings, Chung et al53 found a relative peripheral hyperinsulinemia in African immigrant/African-American women in response to a mixed meal.68 This may be explained by different responses to glucose in BA men and women, with studies consistently finding greater hyperinsulinemia in women.55 69–72 We note with interest that in a recent investigation by Armiyaw et al15 it was only the African-American women who contributed to ethnic differences observed in beta cell responsivity, not the men. As their study was neither designed nor powered to examine interactions by sex, Armiyaw et al15 rightly advised caution when interpreting these findings. Further work examining the interactions between sex and ethnicity in BA groups is warranted.
Strengths and limitations
The strengths of this study include the well-matched, strictly characterized subject groups and the use of a physiological method, the mixed meal test, to assess insulin secretory function. Another strength is the use of sophisticated techniques, including C peptide modeling and the reference standard hyperinsulinemic-euglycemic clamp, to determine beta cell function in the context of insulin sensitivity and to take ethnic differences in insulin clearance into account. In terms of limitations, while the study was powered for the main outcome variable of beta cell insulin secretion, we were not powered to examine the associations between variables and therefore we may have been unable to detect some relationships. We also acknowledge that, as the study was performed in men only, there are limitations to its generalizability; however, the majority of the literature on ethnic differences between WE and BA has examined women21 and therefore our choice to study men only was a conscious attempt to address this potential bias in the literature.
Conclusions
This detailed metabolic investigation of a well-matched group of normally glucose-tolerant men of European and African ancestry found that healthy black West African men do not hypersecrete insulin in response to a meal stimulus; indeed following adjustment for insulin sensitivity, both their endogenous insulin secretion and insulin clearance rates are lower in comparison with their WE counterparts, resulting in similar postprandial systemic insulin and glucose profiles in both ethnic groups. While ethnicity and insulin sensitivity were independently associated with insulin secretion rates, pancreatic fat content was not.
We recognize that our findings run counter to much of the literature, where the consensus is that BA populations hypersecrete insulin and that pancreatic fat is a powerful determinant of their beta cell function; emerging evidence, however, shows that these established findings are not necessarily as consistent as initially thought.24 73 In some African ancestry populations, a relative deficiency of beta cell insulin secretion in the context of their insulin sensitivity may contribute to their risk of developing glucose intolerance. A better understanding of ethnic-specific differences in metabolism in both health and early disease will be key to refining prevention and treatment options, allowing an evidence-based prediction of responses which can then be tested in interventional studies.
Acknowledgments
The authors would like to thank A Pernet, B Wilson and M Henderson-Wilson (Diabetes Research Group, King’s College Hospital, London, UK) for assisting with the metabolic assessments; T Dew (ViaPath, King’s College Hospital) for assistance with sample processing and laboratory analysis; L Coppin and N Jackson (University of Surrey, Guildford, UK) for assistance with analysis of the glucose enrichments; E Giemsa (Clinical Research Facility, King’s College Hospital) for accommodating participant visits; the staff of the Clinical Research Facility at King’s College Hospital for help in performing the studies; and the study participants for their time and commitment.
References
Footnotes
Contributors LMG formulated the research question, designed the study, and supervised the data collection and interpretation. SAA formulated the research question and designed the study. JP formulated the research question, designed the study, and provided statistical advice. AMU formulated the research question and designed the study. RCB supervised the modeling analysis and contributed to interpretation. OB supervised the data collection, performed the metabolic assessments and undertook data analysis. FS-M supervised the data collection and undertook data analysis. ML supervised the data collection, performed the metabolic assessments, undertook data analysis and interpretation, and drafted the manuscript. OH undertook MRI data analysis. GC-E coordinated MRI data acquisition. MLB undertook modeling analysis. All authors contributed to the intellectual content and reviewed the final version of the submitted manuscript. LMG is the guarantor of this work, had full access to all the data and takes full responsibility for the integrity of the data and the accuracy of data analysis.
Funding This work was funded by a Diabetes UK project grant (14/0004967). JP is supported by the NIHR Biomedical Research Centre based at Guy’s and St Thomas’ NHS Foundation Trust and King’s College London and is an NIHR Senior Investigator.
Competing interests SAA has served on advisory boards for Novo Nordisk, Medtronic and Roche. The other authors declare no conflict of interest.
Patient consent for publication Not required.
Ethics approval The study was approved by the London Bridge National Research Ethics Committee (15/LO/1121).
Provenance and peer review Not commissioned; externally peer reviewed.
Data availability statement Data are available upon reasonable request to LMG at louise.goff@kcl.ac.uk.