Article Text

Abstract
Introduction As a key event leading to tubulointerstitial fibrosis in diabetic kidney disease (DKD), epithelial–mesenchymal transition (EMT) has drawn increasing attention from researchers. The antiaging protein Klotho attenuates renal fibrosis in part by inhibiting ERK1/2 signaling in DKD. Early growth response factor 1 (Egr-1), which is activated mainly by ERK1/2, has been shown to play an important role in EMT. However, whether Klotho prevents EMT by inhibiting ERK1/2-dependent Egr-1 expression in DKD is unclear.The aim of this study was to investigate whether Klotho prevents EMT through Egr-1 downregulation by inhibiting the ERK1/2 signaling pathway in DKD.
Research design and methods Male C57BL/6J mice fed an high-fat diet for 4 weeks received 120 mg/kg streptozotocin (STZ), which was injected intraperitoneally. Klotho and Egr-1 expression was detected in the renal cortices of these mice on their sacrifice at 6 and 12 weeks after STZ treatment. In In vitro studies, we incubated HK2 cells under high-glucose (HG) or transforming growth factor-β1 (TGF-β1) conditions to mimic DKD. We then transfected the cells with an Klotho-containing plasmid, Klotho small interfering RNA.
Results Klotho expression was significantly decreased in the renal cortices of mice with diabetes mellitus (DM) compared with the renal cortices of control mice at 6 weeks after treatment and even more significantly decreased at 12 weeks. In contrast, Egr-1 expression was significantly increased in mice with DM compared with control mice only at 12 weeks. We also found that Klotho overexpression downregulated Egr-1 expression and the (p-ERK1/2):(ERK1/2) ratio in HG-treated or TGF-β1-treated HK2 cells. Conversely, Klotho silencing upregulated Egr-1 expression and the (p-ERK1/2):(ERK1/2) ratio in HG-treated or TGF-β1-treated HK2 cells. Moreover, the effects of si-Klotho were abolished by the ERK1/2 inhibitor PD98059.
Conclusions Klotho prevents EMT during DKD progression, an effect that has been partially attributed to Egr-1 downregulation mediated by ERK1/2 signaling pathway inhibition.
- diabetes mellitus
- experimental
- diabetes complications
- diabetes mellitus
- type 2
- kidney diseases
Data availability statement
All data relevant to the study are included in the article or uploaded as supplemental information.
This is an open access article distributed in accordance with the Creative Commons Attribution Non Commercial (CC BY-NC 4.0) license, which permits others to distribute, remix, adapt, build upon this work non-commercially, and license their derivative works on different terms, provided the original work is properly cited, appropriate credit is given, any changes made indicated, and the use is non-commercial. See: http://creativecommons.org/licenses/by-nc/4.0/.
Statistics from Altmetric.com
Significance of this study
What is already known about this subject?
Early growth response factor 1 (Egr-1), which is activated mainly by ERK1/2, has been shown to play an important role in epithelial–mesenchymal transition.
Klotho attenuates renal fibrosis in part by inhibiting ERK1/2 signaling in diabetic kidney disease (DKD).
What are the new findings?
Decreased expression of Klotho appeared earlier than increased expression of Egr-1 in the renal cortices of mice with diabetes mellitus.
Klotho silencing upregulated Egr-1 expression and the (p-ERK1/2):(ERK1/2) ratio in HG-treated or TGF-β1-treated HK2 cells. Moreover, the effects of si-Klotho were abolished by the ERK1/2 inhibitor PD98059.
How might these results change the focus of research or clinical practice?
Klotho downregulates Egr-1 via the ERK1/2 signaling pathway, a novel mechanism in DKD progression.
Klotho might be a potential early marker and new therapeutic target for DKD.
Introduction
Diabetic kidney disease (DKD) has become the leading cause of end-stage renal disease not only in high-income countries1 but also in low-income countries.2 Although glomerular dysfunction is considered the trigger for DKD, a series of studies have revealed that renal tubulointerstitial fibrosis (TIF) correlates with the progression of the disease better than glomerular injury and that TIF is commonly present during the final stages of many chronic kidney diseases, including DKD.3–5 Recent studies suggest that the proximal tubule may also contribute to glomerulopathy in DKD development.6–8 Epithelial–mesenchymal transition (EMT) is characterized by the loss of epithelial markers, such as E-cadherin, zonula occludens-1 and cytokeratin, and the acquisition of mesenchymal markers, such as vimentin, α-smooth muscle actin (α-SMA), fibroblast-specific protein-1 and fibronectin (FN).9 EMT is the transdifferentiation of tubular epithelial cells into myofibroblasts, an event that underlies the progression of chronic kidney disease in diabetes, which results in TIF. EMT, which has been described mainly in the proximal regions of the nephron, is now recognized as a key contributor to the loss of renal function throughout the nephron in DKD.10 However, the molecular mechanisms underlying the role of tubular EMT in early DKD progression remain largely unknown.
Klotho was originally discovered as an antiaging factor11 and is highly expressed in renal distal tubular cells, as well as the brain, parathyroid gland and heart.12 13 It has been reported that plasma-soluble Klotho deficiency is a key event in and a novel biomarker of the early stages of nephropathy in patients with diabetes.14–17 Renal Klotho protein expression levels are decreased in rats with streptozotocin (STZ)-induced diabetes, a phenomenon associated with kidney destruction.18 Klotho deficiency exacerbated STZ-induced increases in urine albumin levels and blood urea nitrogen levels, STZ-induced mesangial matrix expansion in the renal glomerulus, and STZ-induced kidney hypertrophy in KL±mutant mice, suggesting that Klotho has protective effects on kidney function and structure.19 It was reported that exogenous Klotho attenuates high glucose (HG)-induced profibrotic gene expression, transforming growth factor-β (TGF-β) signaling and cell hypertrophy in NRK-49F cells, and Klotho attenuates HG-induced FN expression and cell hypertrophy via the ERK1/2 pathway.20 Moreover, Klotho overexpression prevents mesangial extracellular matrix (ECM) production in HG-treated human mesangial cells (MCs) by downregulating early growth response factor 1 (Egr-1) expression.21 In addition, Klotho inhibits cyclosporine A-induced EMT and renal fibrosis in rats22 and secreted Klotho suppresses the expression of transforming growth factor-β1 (TGF-β1)-induced EMT markers, such as α-SMA and vimentin, in cultured NRK52E cells.23 Therefore, DKD may be considered a state of Klotho deficiency, and Klotho may prevent EMT in DKD progression.
Egr-1, an 80–82-kD zinc-finger transcription factor in the immediate early gene family, has been found to be expressed in renal epithelial cells, tubular fibroblasts, glomerular MCs and endothelial cells.24 Egr-1 contributes to renal fibrosis, perhaps by promoting MC proliferation,25 26 ECM synthesis,27 TGF-β upregulation,28 29 and primary tubular epithelial cell EMT.30 31 Recent studies indicate that Egr-1 also plays a key role in DKD progression by promoting ECM synthesis and MC proliferation,32 binding directly to the TGF-β promoter33 and promoting TIF development.32 34 Moreover, Egr-1 is a substrate for various protein kinases,35 36 and ERK1/2 signaling pathway activation enhances Egr-1 transcriptional activity.37 38
As mentioned earlier, Klotho attenuates HG-induced profibrotic gene expression and cell hypertrophy via the ERK1/2 pathway in NRK-49F cells.20 However, whether Klotho prevents EMT by downregulating ERK1/2-dependent Egr-1 expression during early DKD progression has not been elucidated.
Methods
Animals
Models
A total of 24 male C57BL/6J mice at postnatal weeks 3–4 and weighing 15–16 g were obtained from the Experimental Animal Center, Guangdong Academy of Medical Sciences, for use in this study. The mice were housed at a stable temperature (22°C±1°C) and humidity under a 12/12-hour light–dark cycle. The animals were separated into a control group, which was fed normal chow diet (control group, n=12) and a diabetes mellitus (DM) group, which was fed a high-fat diet (HFD) (composition: carbohydrates, 20%; protein, 20%; and fat, 60%; D12492, Guangdong Academy of Medical Sciences, China) (DM group, n=12). After 4 weeks, the mice with DM received a single injection of STZ (120 mg/kg, intraperitoneal, in citrate buffer, pH=4.5; Sigma, USA), and the control mice were injected with an equal volume of vehicle.
Metabolic profile analysis
The animals were assessed once every 2 weeks. The health, body condition and well-being of the animals were assessed during each evaluation. No adverse events occurred during the experiments described herein. The mice were weighed at 2-week intervals, and their random blood glucose levels were measured using an Accu-Chek glucometer (Roche Diagnostics). Only animals with a random blood glucose level of >16.7 mmol/L were considered diabetic. The mice were placed in metabolic cages, and 24-hour urine collection was performed 2 days before they were sacrificed. Urine albumin levels were determined using a Murine Microalbuminuria ELISA Kit (Exocell, Philadelphia, Pennsylvania, USA).
Tissue harvesting occurred at weeks 6 and 12, and all specimens were harvested while the animals were fasted overnight. Before being sacrificed, 0.5 mL blood samples were obtained from the medial canthus and collected into EDTA tubes, after which they were placed on ice. Euthanasia was performed by deep anesthetization with isoflurane (4%), followed by cardiac puncture. Organ perfusion was performed with phosphate-buffered saline to collect blood after cardiac puncture. The kidneys were collected and weighed, and then each kidney was fixed in 10% buffered formalin for histological examination or stored in liquid nitrogen until needed for additional analyses. The samples were then centrifuged, and the plasma was collected and stored at −80℃. Triglyceride, total cholesterol, low-density lipoprotein cholesterol and glucose levels were measured by ELISA (R&D Systems, UK) according to the manufacturer’s instructions. Urinary albumin levels were also measured by ELISA (Bethyl Laboratories Inc., Montgomery, Texas, USA).
Renal histopathology
The kidney was removed from each mouse, fixed in 4% paraformaldehyde for 24 hours, and embedded in paraffin. Each sample was then cut into sectioned 3 µm-thick sections. The sections were then stained with periodic acid–Schiff (Loogene, Beijing, China) and Masson’s trichrome stain kit (Maiwei, Xiamen, China), as previously described.39 Immunohistochemical staining was performed to assess the renal tissue protein expression of Klotho and Egr-1. Briefly, the tissue sections were incubated with a mouse anti-Klotho polyclonal antibody (1:500 dilution; Abcam, USA) or a mouse anti-Egr-1 polyclonal antibody (1:700 dilution; Santa Cruz Biotechnology, Santa Cruz, California, USA) overnight, after which they were incubated with a horseradish peroxidase-conjugated anti-rabbit secondary antibody (DAKO, Glostrup, Denmark). Hematoxylin was applied as the counter stain. All sections were analyzed under an Olympus B ×40 photomicroscope (Olympus, Tokyo, Japan).
Cell culture
The indicated human proximal tubule cell line (HK-2) was obtained from the Cell Bank of Type Culture Collection (Chinese Academy of Sciences, Shanghai, China). All cells were incubated at 37°C in a humidified atmosphere of 5% CO2 and were cultured in Dulbecco’s modified Eagle low-glucose (LG) medium (containing 5.5 mM D-glucose) (Gibco, Carlsbad, California, USA) containing 10% fetal bovine serum (Gibco, Australia). The medium was changed every 48 hours. All cells were grown to 60%–70% confluence and were serum deprived for 24 hours before being used for the experiments, in which they were incubated in serum-free culture medium and treated with HG (30 mM; Sigma, Saint Louis, Missouri, USA), mannitol (30 mM; Fuchen, Tianjin, China), which served as a control for osmolality, or TGF-β1 (10 ng/mL; Invitrogen, California, USA), depending on the experiment.
Transfections
Plasmid transfection
HK2 cells were seeded in 12-well cell culture plates. After the cells reached approximately 80% confluence, they were transfected with plasmids expressing Klotho (Addgene plasmid #17712, USA) or empty vectors (pcDNA3.1; Vigenebio, Shandong, China). Transient plasmid transfection was conducted with 1 µg/well Lipofectamine 3000 (Invitrogen), according to the manufacturer’s instructions. After 24 hours of transfection, the cells were cultured in medium containing LG (5.5 mmol/L), HG (30 mmol/L) or TGF-β1 (10 ng/mL) for 0.5, 1.5 or 48.0 hours. Some of the aforementioned cells were harvested after 24 hours of transfection to test Klotho and protein expression, and additional cells were harvested after 48 hours of incubation under LG, HG or TGF-β1 conditions to test the expression of EMT-related proteins.
Small interfering RNA (siRNA) transfection
HK2 cells were seeded in 12-well cell culture plates. After the cells reached approximately 60% confluence, they were transfected with siRNAs targeting Klotho or negative-control siRNAs (RiBoBio, Guangzhou, China). The Klotho siRNAs were as follows: si-Klotho 1 (ACACCATCCTGCAGTACTA), si-Klotho 2 (GCAGGCTGATTGGATAGAA), and si-Klotho 3 (GCAGAATTACATAAACGAA). Transient siRNA transfection was conducted with 50 nM Lipofectamine 3000 (Invitrogen), according to the manufacturer’s instructions. After 24 hours of transfection, the cells were cultured in medium containing LG (5.5 mmol/L), HG (30 mmol/L) or TGF-β1 (10 ng/mL) for 0.5, 1.5 or 48.0 hours. Additionally, two groups of cells that were transfected with si-Klotho were exposed to serum-free medium supplemented with PD98059 (25 mM; Abcam, Shanghai, China) for 0.5 hour before being cultured in LG, HG or TGF-β1-medium. Some of the cells were harvested after 24 hours of transfection to test Klotho mRNA and protein expression, and additional cells were harvested after 48 hours of incubation under LG, HG or TGF-β1 conditions to test the expression of EMT-related proteins.
Quantitative real-time PCR
Total RNA was extracted from renal cortices and HK2 cells with Trizol reagent (Takara Biotechnology, Dalian, China), according to the manufacturer’s instructions, and RNA quality was determined using a Nanodrop ND-1000 Spectrophotometer (Thermo Fisher Scientific, Massachusetts, USA). Reverse transcription was performed with an M-MLV Kit (Invitrogen). Real-time quantitative PCR (RT-qPCR) was conducted in a Roche 480 Thermal Cycler using 40 ng of cDNA, SYBR Select Master Mix (Invitrogen) and appropriate primers (Invitrogen, Shanghai, China). PCR was performed under following cycling conditions: 50°C for 2 min and 95°C for 2 min, followed by 40 cycles of 95°C for 15 s and 60°C for 1 min. The relative expression level of each gene was calculated using the comparative 2−ΔΔCt method. β-actin was used as an internal control.
Western blotting
Total protein was extracted from renal cortices and HK2 cells using RIPA Lysis Buffer (KeyGEN BioTECH, China), and protein concentrations were estimated by bicinchonininc acid (BCA) assay (Takara Biotechnology). Equal amounts of protein were fractionated by 10%–12% sodium dodecyl sulfate- polyacrylamide gel electrophoresis (SDS-PAGE) (Bio-Rad Laboratories, Hercules, California, USA) and then electrotransferred onto polyvinylidene fluoride membranes (Merck Millipore, MA, USA), which were blocked with Tris-buffered saline containing 0.1% Tween-20 and 5% skim milk before being incubated with primary antibodies against Klotho (1:500 dilution, Abcam), Egr-1 (1:500 dilution, Santa Cruz Biotechnology), E-cadherin (1:500 dilution; BD, USA), α-SMA (1:500 dilution; Boster, USA), FN (1:1000 dilution; R&D, USA), ERK1/2 (1:1000 dilution; CST, USA), phosphorylated ERK1/2 (p-ERK1/2) (1:500 dilution, CST) and β-actin (1:1000 dilution, ZSGB-BIO, China) overnight. The membranes were then incubated with a fluorescent secondary antibody (1:10 000 dilution; LI-COR, USA) for 1 hour. The signal was visualized using an Odyssey Infrared Imaging System (LI-COR) and quantified using Quantity One V.4.4.0 software (Bio-Rad Laboratories).
Statistical analysis
Data were expressed as the mean±SD. Two-tailed Student’s t tests were used for pairwise comparisons of independent groups, and one-way analysis of variance was used for comparisons of three or more independent groups. Dunnett’s test or the least significant difference test was used for multiple comparisons. Statistical analysis was performed using SPSS V.20.0. A p value of <0.05 was considered significant.
Results
Klotho and Egr-1 expression in the renal cortices of mice with diabetes induced by an HFD and STZ
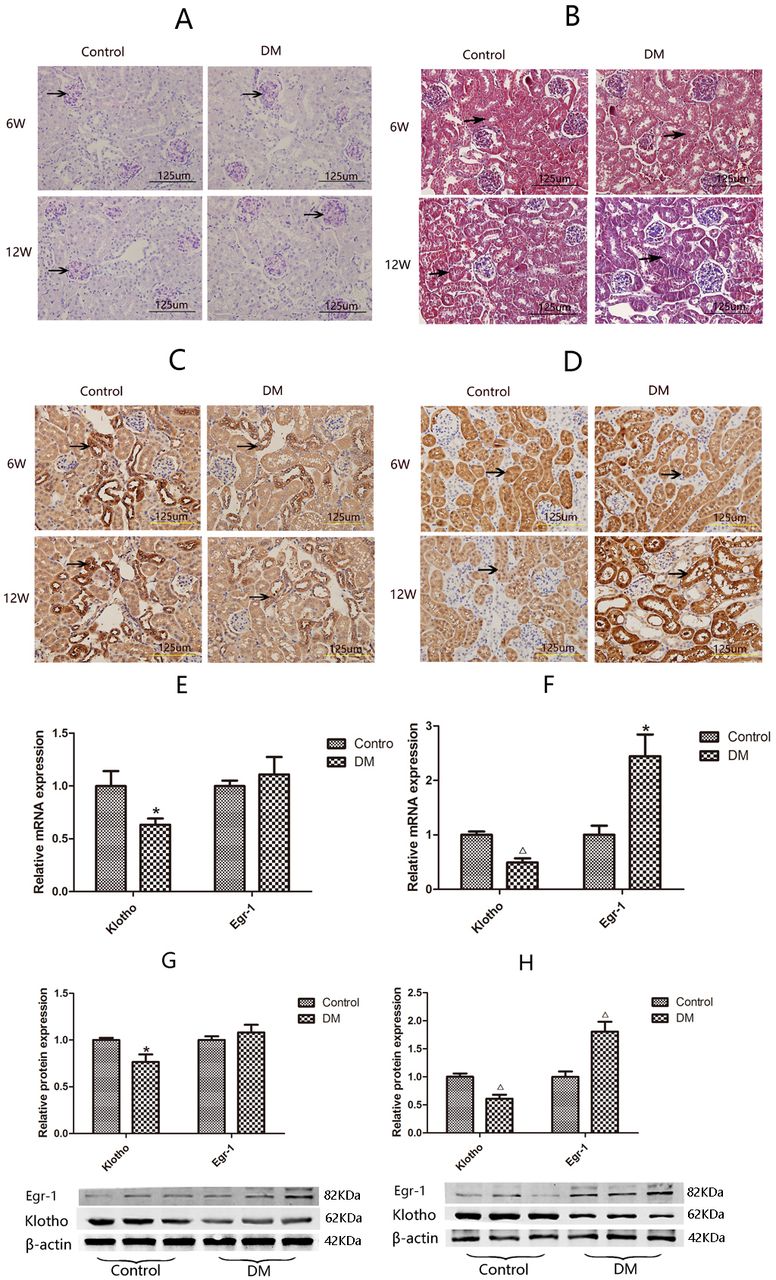
The 24-hour urine microalbumin level of mice with DM was 4.5-fold higher than that of control mice at 6 weeks after treatment and 10.8-fold higher than that of control mice at 12 weeks after treatment (table 1), suggesting that the early DKD mouse model was successfully established.40 41 Periodic Acid-Schiff (PAS) staining and Masson staining showed there were no differences in mesangial matrix size or tubular interstitial collagen between the two groups of mice at 6 weeks after treatment; however, the mesangial matrix was enlarged in mice with DM compared with the control mice at 12 weeks (figure 1A), and mice with DM displayed more extensive tubular interstitial collagen deposition than control mice at 12 weeks (figure 1B). Immunohistochemistry showed that Klotho expression was significantly decreased in the renal cortices of mice with DM compared with the renal cortices of control mice at 6 weeks after treatment. Klotho expression was even more significantly decreased in the renal cortices of mice with DM compared with the renal cortices of control mice at 12 weeks after treatment (figure 1C). In contrast, Egr-1 was significantly higher in mice with DM than in control mice only at 12 weeks after treatment (figure 1D).
Result of metabolic parameters between two groups( ±SD)
±SD)

Histopathology and expression of Klotho and Egr-1 in the kidneys of mice with DM and control mice. Kidney sections from 6W and 12W diabetic mice (DM, n=6) and control mice (control, n=6) are stained with (A) periodic acid–Schiff (darker purple color indicates positive staining) or (B) Masson trichrome (blue staining indicates positive staining; black arrows indicate renal tubular interstitial collagen deposition), and analyzed by immunohistochemistry using antibodies against (C) Klotho or (D) Egr-1. Magnification, ×400. Expression of Klotho and Egr-1 in mice renal cortices by RT-qPCR and western blotting. Klotho and Egr-1 mRNA expression at 6 w (E) and at 12W (F), Klotho and Egr-1 protein expression at 6 w (G) and at 12W (H). Values are mean±SD. *P<0.05 vs control, △P<0.01 vs control. DM, diabetes mellitus; Egr-1, early growth response factor 1; RT-qPCR, real-time quantitative PCR; 6W, 6 weeks; 12W, 12 weeks.
The gene and protein expression levels of Klotho and Egr-1 in the renal cortices of mice with DM and control mice were compared by RT-qPCR and western blotting, respectively. Klotho mRNA and protein expression levels in the renal cortices of mice with DM were 63.36% (p<0.05) and 76.61% (p<0.05) of those in the renal cortices of control mice, respectively, at 6 weeks after treatment and 49.03% (p<0.01) and 61.03% (p<0.01) of those in the renal cortices of control mice, respectively, at 12 weeks after treatment (figure 1E,G). Egr-1 expression was significantly increased in mice with DM compared with control mice at 12 weeks after treatment. Specifically, Egr-1 mRNA expression levels were 2.44-fold higher in mice with DM than in control mice (p<0.05), and Egr-1 protein expression levels were 1.81-fold higher in mice with DM than in control mice (p<0.05). There was no significant difference in Egr-1 mRNA or protein expression between the two groups at 6 weeks after treatment (figure 1F,H).
HG and TGF-β1 induced Egr-1 expression in HK2 cells
HK2 cells treated with HG (30 mmol/L) and TGF-β1 (10 ng/mL) for 48 hours displayed transient Egr-1 upregulation. Egr-1 mRNA expression initially increased to a level that was 38.41-fold higher than that of baseline at 0.5 hour after HG treatment initiation (p<0.01) and then decreased to levels that were 9.99-fold higher than that of baseline at 1.5 hours after HG treatment initiation (p<0.01), 1.98-fold higher than that of baseline at 3 hours after treatment initiation (p<0.01) and 1.43-fold higher than that of baseline at 6 hours after treatment initiation (p<0.05) before decreasing to baseline at 12 hours after treatment initiation (figure 2A). Western blotting assays of Egr-1 protein expression revealed that Egr-1 protein expression initially increased to a level that was 1.31-fold higher than that of baseline at 0.5 hour after HG treatment initiation (p<0.05) and then increased to a level that was 2.20-fold higher than that of baseline at 1.5 hours after HG treatment initiation (p<0.01) before decreasing to a level that was 1.44-fold higher than that of baseline at 3 hours after treatment initiation (p<0.01) and then decreasing to baseline at 6 hours after treatment initiation (figure 2D).

Egr-1 expression at the indicated time points in HG-treated or TGF-β1-treated HK2 cells. The Egr-1 mRNA (A) and Egr-1 protein (D) levels are determined at the indicated time points after HG treatment initiation. The Egr-1 mRNA (B) and Egr-1 protein (E) levels are determined at the indicated time points after TGF-β1 treatment initiation. The results are expressed as fold change over baseline (0 hour). Egr-1 expression in HK2 cells treated with LG, HG and TGF-β1. Levels of Egr-1 mRNA (C) and Egr-1 protein (F) are assessed in HK2 cells treated for 0.5 hour/1.5 hours with LG, HG, TGF-β1 and HG+TGF-β1, and HK2 cells treated with mannitol serve as an osmotic control. Values are mean±SD. *P<0.05 vs 0 hour, △P<0.01 vs 0 hour. Egr-1, early growth response factor 1; HG, high-glucose; LG, low-glucose; TGF-β1, transforming growth factor-β1.
Similarly, Egr-1 mRNA expression initially increased to a level that was 3.69-fold higher than that of baseline at 0.5 hour after TGF-β1 treatment initiation (p<0.01) and then decreased to levels that were 2.91-fold higher than that of baseline at 1.5 hour after treatment initiation (p<0.01) and 1.32-fold higher than that of baseline at 3 hours after treatment initiation (p<0.05) before decreasing to baseline at 6 hours after treatment initiation (figure 2B). Western blotting assays of Egr-1 protein expression revealed that Egr-1 protein expression initially increased significantly to a level that was 1.89-fold higher that of baseline at 1.5 hours after TGF-β1 treatment initiation (p<0.05) and then decreased to a level that was 1.24-fold higher than that of baseline at 3 hours after treatment initiation (p<0.01) before decreasing to baseline at 6 hours after treatment initiation (figure 2E).
To rule out the influence of hyperosmotic stress on the aforementioned results, we cultured HK2 cells with LG (5.5 mmol), LG (5.5 mmol)+mannitol (24.5 mmol/L), HG (30 mmol/L), TGF-β1 (10 ng/mL) or HG (30 mmol/L)+TGF-β1 (10 ng/mL) for 0.5 or 1.5 hours. We found that HG alone significantly upregulated Egr-1 mRNA and protein expression (p<0.01), while LG+mannitol did not significantly affect Egr-1 expression (p>0.05) (figure 2C,F). Although Egr-1 expression levels in the HG+TGF-β1 group were higher than those in the TGF-β1 group (p<0.01), there was no significant difference in Egr-1 expression between the HG+TGF-β1 and HG groups (p>0.05) (figure 2C,F). Therefore, there was no need to use an HG+TGF-β1 group in subsequent experiments.
Effects of pcDNA-Klotho on Egr-1 expression and the (p-ERK1/2):(ERK1/2) ratio in HG-treated and TGF-β1-treated HK2 cells
We verified the overexpression efficiency of pcDNA-Klotho. We found that transfection with pcDNA-Klotho for 24 hours was effective, as we noted significant increases in Klotho mRNA and protein expression after transfection with pcDNA-Klotho compared with transfection with pcDNA-Vector (p<0.01 and p<0.01) (figure 3G,H).
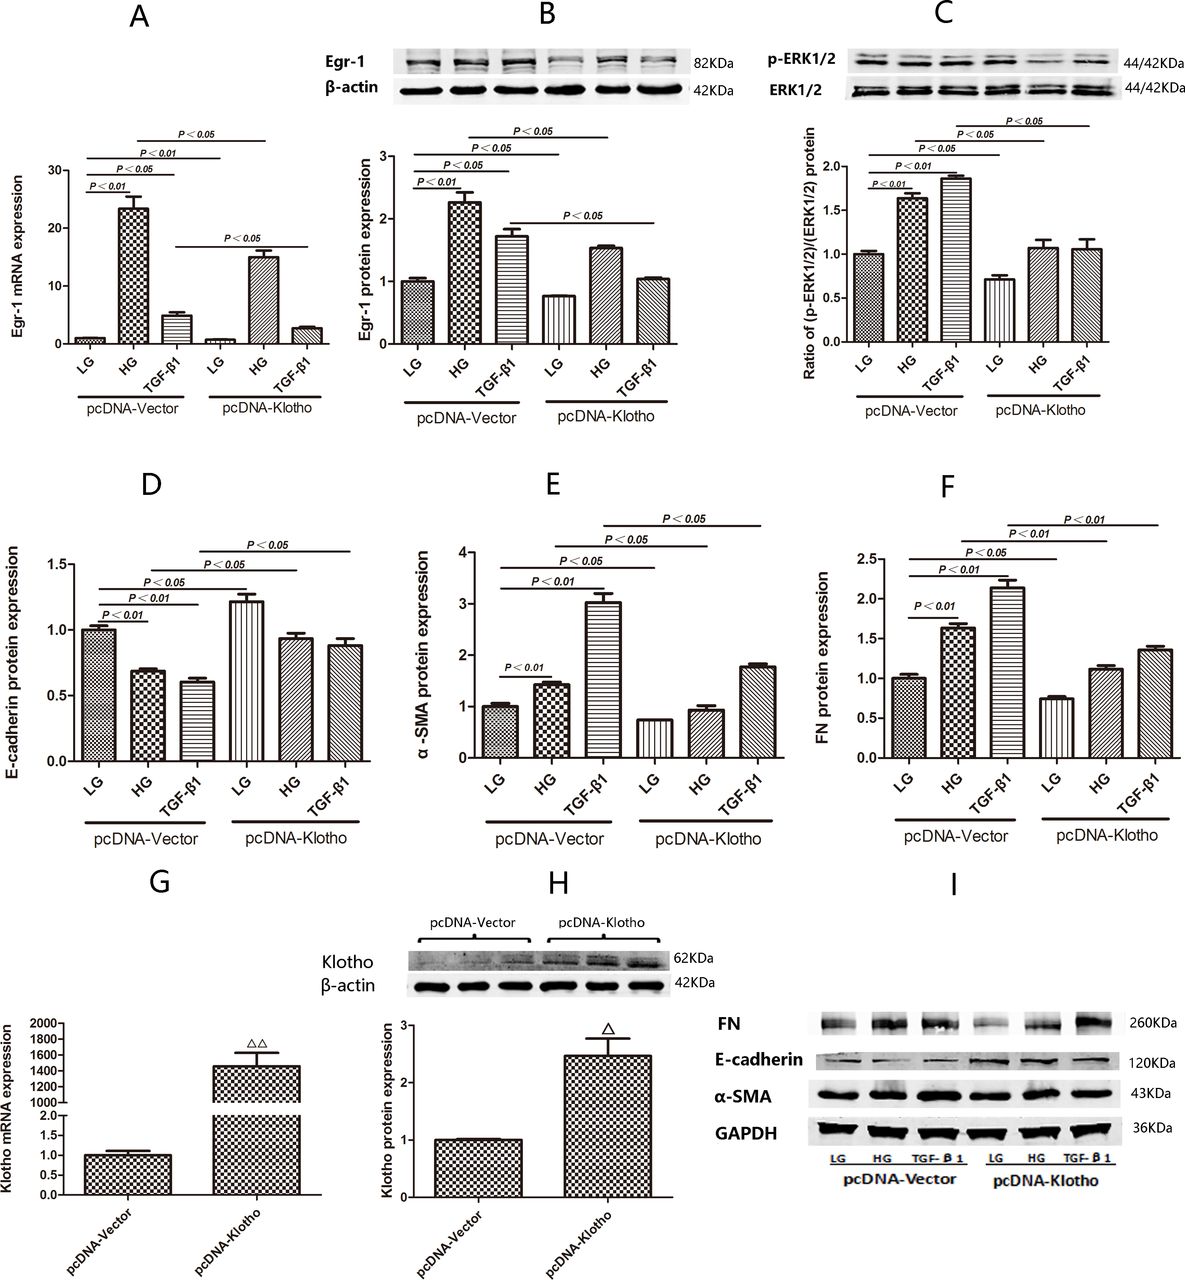
Expression of Egr-1, E-cadherin, α-SMA and FN and (p-ERK1/2)/(ERK1/2) ratio in HK2 cells transfected with pcDNA-Klotho under LG, HG and TGF-β1 conditions. (G,H) Comparisons of pcDNA-Klotho overexpression efficiency by RT-qPCR and western blotting after transient transfection for 24 hours. (A) Egr-1 mRNA expression in HK2 cells treated with LG, HG and TGF-β1 for 0.5 hour after being transfected with pcDNA-Klotho for 24 hours. (B) Egr-1 protein expression and (C) (p-ERK1/2):(ERK1/2) ratio in HK2 cells treated with LG, HG and TGF-β1 for 1.5 hours after being transfected with pcDNA-Klotho for 24 hours. (D,E,F,I) E-cadherin, α-SMA and FN protein expression in HK2 cells treated with LG, HG and TGF-β1 for 48 hours after being transfected with pcDNA-Klotho for 24 hours. Values are mean±SD. △P<0.05 vs pcDNA-vector, △△P<0.01 vs pcDNA-vector. Egr-1, early growth response factor 1; FN, fibronectin; HG, high-glucose; LG, low-glucose; RT-qPCR, real-time quantitative PCR; α-SMA, α-smooth muscle actin; TGF-β1, transforming growth factor-β1.
Egr-1 mRNA expression was significantly decreased in HK2 cells treated with HG or TGF-β1 for 0.5 hour after being transfected with pcDNA-Klotho for 24 hours compared with HK2 cells treated with HG or TGF-β1 for 0.5 hour after being transfected with pcDNA-Vector for 24 hours (p<0.01 and p<0.05) (figure 3A).
Egr-1 protein expression and the (p-ERK1/2):(ERK1/2) ratio were both significantly decreased in HK2 cells treated with HG for 1.5 hours after being transfected with pcDNA-Klotho for 24 hours compared with HK2 cells treated with HG for 1.5 hours after being transfected with pcDNA-Vector for 24 hours (p<0.01 and p<0.05) (figure 3B,C). Egr-1 protein expression and the (p-ERK1/2):(ERK1/2) ratio were also both significantly decreased in HK2 cells treated with TGF-β1 for 1.5 hours after being transfected with pcDNA-Klotho for 24 hours compared with HK2 cells treated with TGF-β1 for 1.5 hours after being transfected with pcDNA-vector for 24 hours (p<0.05 and p<0.05) (figure 3B,C)
E-cadherin expression was significantly increased in HK2 cells treated with HG and TGF-β1 for 48 hours after being transfected with pcDNA-Klotho for 24 hours compared with HK2 cells treated with HG for 48 hours after being transfected with pcDNA-vector for 24 hours. α-SMA and FN expression were significantly decreased in HK2 cells treated with HG and TGF-β1 for 48 hours after being transfected with pcDNA-Klotho for 24 hours compared with HK2 cells treated with HG and TGF-β1 for 48 hours after being transfected with pcDNA-vector for 24 hours (figure 3D–F,I).
Effects of si-Klotho on Egr-1 expression and the (p-ERK1/2):(ERK1/2) ratio in HK2 cells cultured under HG or TGF-β1 conditions
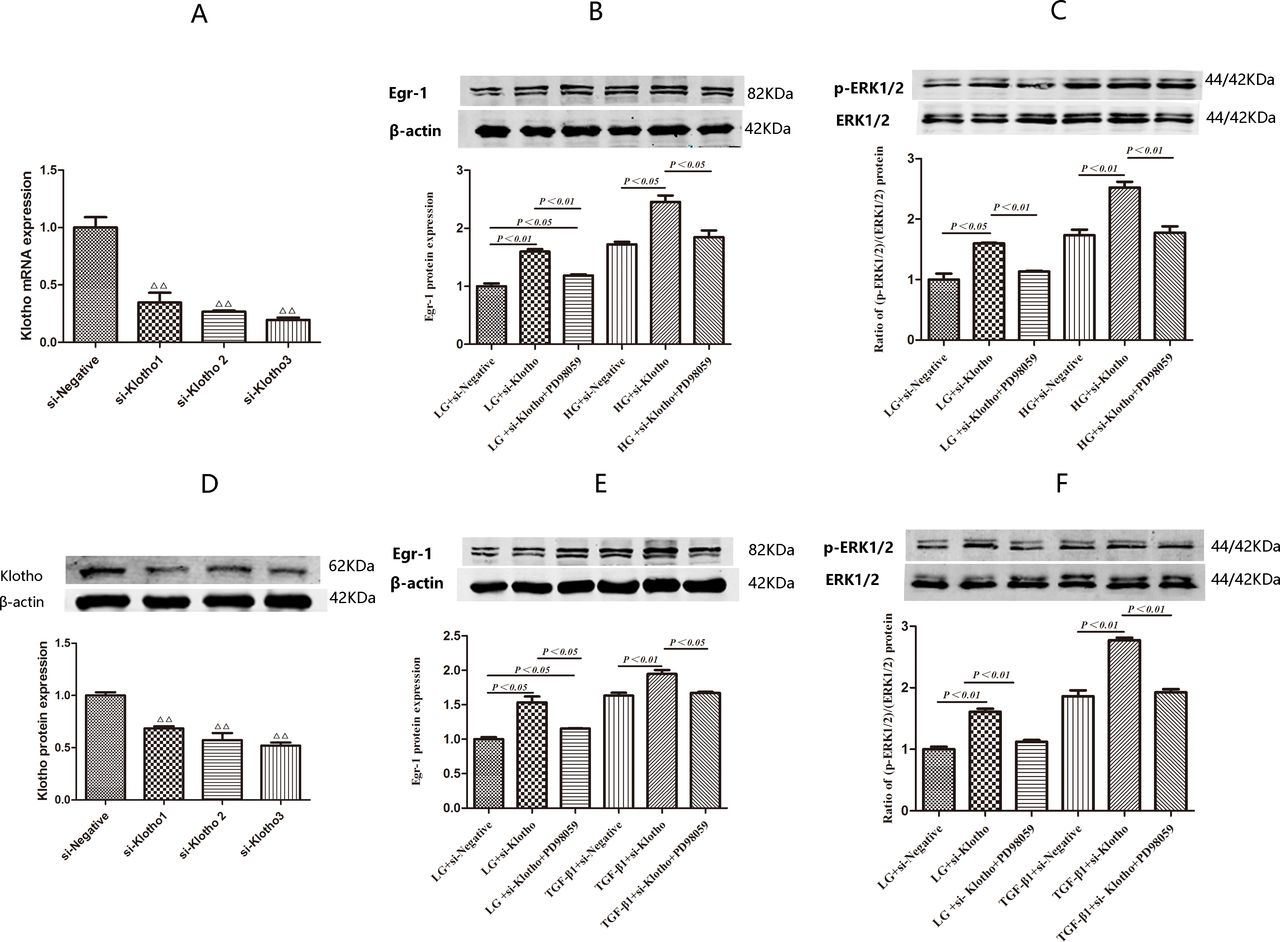
We performed screening studies to identify the most efficient Klotho siRNA. We found that Klotho mRNA expression decreased to levels that were 34.72% (p<0.01), 26.70% (p<0.01) and 19.58% of baseline in HK2 cells treated with si-Klotho 1, 2 and 3, respectively, for 24 hours compared with si-negative-treated HK2 cells. Klotho protein expression levels were similar among the four groups (figure 4A,D). Thus, si-Klotho 3 was ultimately used in subsequent experiments.
Expression of Egr-1 and (p-ERK1/2):(ERK1/2) ratio in HK2 cells transefected with si-Klotho under LG, HG and TGF-β1 conditions with or without PD98059-pretreatment for 0.5 hour. (A,D) Comparisons of Klotho siRNAs silencing efficiency by RT-qPCR and western blotting after transient transfection for 24 hours. (B) Egr-1 protein expression and (C) (p-ERK1/2):(ERK1/2) ratio in HK2 cells treated with LG and HG with or without PD98059-pretreatmen for 1.5 hours after being transfected with si-Klotho for 24 hours. (E) Egr-1 protein expression and (F) (p-ERK1/2):(ERK1/2) ratio in HK2 cells treated with LG and TGF-β1 with or without PD98059-pretreatment for 1.5 hours after being transfected with si-Klotho for 24 hours. Values are mean±SD. △P<0.05 vs si-negative, △△P<0.01 vs si-negative. Egr-1, early growth response factor 1; HG, high glucose; LG, low glucose; TGF-β1, transforming growth factor-β1.
HK2 cells were treated with HG or TGF-β1 for 1.5 hours to assess the effects of these treatments on Egr-1, p-ERK1/2 and ERK1/2 protein expression after being transfected with si-Klotho for 24 hours. Egr-1 protein expression level was 1.43-fold higher in the HG+si-Klotho group than in the HG+si-negative group (p<0.05). However, there was no significant difference in Egr-1 protein expression levels between the HG+si-negative and HG+si-Klotho+PD98059 groups (figure 4B). Egr-1 protein expression levels were 1.36-fold higher (p<0.01) in the TGF-β1+si-Klotho group than in the TGF-β1+si-negative group. However, there was no significant difference in Egr-1 protein expression levels between the TGF-β1+si-negative and TGF-β1+si-Klotho+PD98059 groups (figure 4E).
The (p-ERK1/2):(ERK1/2) ratio in the HG+si-Klotho group was 1.46-fold higher than that in the HG+si-negative group (p<0.01). However, there was no significant difference in the (p-ERK1/2):(ERK1/2) ratio between the HG+si-negative and HG+si-Klotho+PD98059 groups (figure 4C). The (p-ERK1/2):(ERK1/2) ratio in the TGF-β1+si-Klotho group was 1.49-fold higher than that in the TGF-β1+si-negative group (p<0.01). However, there was no significant difference in the (p-ERK1/2)/(ERK1/2) ratio between the TGF-β1+si-negative and TGF-β1+si-Klotho+PD98059 groups (figure 4F).
Discussion
Increasing numbers of studies have focused on the role of tubulopathy in the development of DKD.3–8 EMT plays a key role in the development of TIF. Thus, studies exploring the molecular mechanisms underlying the role of EMT in DKD progression are urgently needed. Both Klotho and Egr-1 are closely associated with DKD, as well EMT in various chronic kidney diseases. Recently, Rafael Kramann’s team profiled the transcriptomes of proximal tubule and non-proximal tubule cells in healthy and fibrotic human kidneys using single cell RNA-seq, and revealed distinct subpopulations of pericytes and fibroblasts as the major cellular sources of scar forming myofibroblasts during human kidney fibrosis. They identified NKD2 as a myofibroblast-specific target in human kidney fibrosis, which further confirms that myofibroblasts represent the main source of ECM during kidney fibrosis.42 In this study, we first observed the relationship between Klotho and Egr-1 expression in the renal cortex in an early DKD mouse model and then explored the effects of Klotho and Egr-1 on EMT in HG-treated or TGF-β1-treated HK2 cells. E-cadherin is the main marker of epithelial cells; α-SMA is the main marker of myofibroblasts; and FN is the main maker of the ECM. All of these entities play an important role in the pathogenesis of tubular EMT in DKD; therefore, we measured Egr-1, E-cadherin, a-SMA and FN expression in HK2 cells treated with HG or TGF-β1 after transient transfection with the Klotho-containing plasmid pcDNA-Klotho.
In this study, Renal Klotho mRNA expression levels in STZ-induced diabetic mice decreased significantly to levels that were approximately 70% of those in non-diabetic control mice at 6 weeks post-treatment and approximately 50% of those in non-diabetic control mice at 12 weeks post-treatment. Moreover, a previous study showed that renal Klotho protein expression levels were significantly decreased in the former group compared with the latter group at 5 weeks post-treatment.19 Other studies showed that renal Klotho protein expression levels in the kidneys of STZ-induced diabetic rats were significantly reduced compared with those in the kidneys of control rats at 9 weeks post-treatment.18 43 Moreover, Egr-1 mRNA expression levels in STZ-induced diabetic mice were significantly higher than those in non-diabetic control mice at 10 weeks post-treatment.32 The results of these studies indicate that renal Klotho expression levels may decrease earlier than renal Egr-1 expression levels increase in DKD. Similarly, our study showed that Klotho expression decreased, and Egr-1 expression increased in the renal cortices of mice with DM induced by an HFD and STZ, suggesting that Klotho and Egr-1 are both involved in early DKD progression. Moreover, Klotho expression was significantly decreased in the renal cortices of mice with DM compared with the renal cortices of control mice at 6 weeks after treatment. Klotho expression was even more significantly decreased in mice with DM compared with control mice at 12 weeks after treatment. In contrast, Egr-1 expression was significantly increased in mice with DM compared with control mice only at 12 w after treatment.
Our previous study showed that transient Egr-1 expression can be induced by HG in HK2 cells,34 rat MCs33 and human MCs.21 We observed a similar finding in HK2 cells treated with HG or TGF-β1. Specifically, we noted that Egr-1 mRNA and protein expression levels peaked at 0.5 and 1.5 hours post-HG or TGF-β1 treatment, respectively, and then decreased to baseline. In addition, we verified that the expression of the EMT markers α-SMA and FN was induced by HG or TGF-β1 and that the expression of the epithelial marker E-cadherin was downregulated by HG or TGF-β1 in HK2 cells.
Klotho can mitigate cyclosporine A-induced EMT and renal fibrosis in rats. Administration of cyclosporine A for 28 days induced renal damage, decreased Klotho expression and activated EMT, changes that were accompanied by increases in TGF-β1 and α-SMA expression and a decrease in E-cadherin expression. Treatment with Klotho significantly ameliorated the pathological effects of cyclosporine A by modulating the expression of EMT-associated proteins in the kidney.22 Klotho suppresses TGF-β1-induced EMT responses in cultured NRK52E cells, as the protein increases epithelial marker expression, decreases mesenchymal marker expression, and/or decreases cell migration. These results suggest that secreted Klotho functions as an endogenous anti-EMT factor by inhibiting multiple growth factor signaling pathways simultaneously.23 In this study, we found that pcDNA-Klotho-mediated Klotho overexpression inhibited Egr-1, α-SMA and FN upregulation and E-cadherin downregulation in HK2 cells treated with HG or TGF-β1. These results suggested that Klotho downregulated Egr-1 and prevented EMT in HG-treated and TGF-β1-treated HK2 cells. As mentioned earlier, ERK1/2 is the main protein kinase responsible for activating Egr-1, while Klotho attenuates HG-induced FN expression and cell hypertrophy via the ERK1/2-dependent pathway.20 It was reported that ERK 1/2 is activated by various stimuli, including HG,44 45 TGF-β,46 and angiotensin II,47 in both cultured renal resident cells and experimental diabetic nephropathy models. However, whether Klotho prevents EMT by downregulating ERK1/2-dependent Egr-1 expression in DKD remains unknown.
To answer this question, we first observed Egr-1, E-cadherin, a-SMA and FN expression in HK2 cells treated with HG or TGF-β1 after transient transfection with Klotho siRNA. To confirm that Klotho downregulated Egr-1 expression by inhibiting the ERK1/2 signaling pathway in HK2 cells under HG or TGF-β1 conditions, we used si-Klotho to knock down the Klotho gene in HK2 cells. In addition, we exposed transfected HK2 cells to PD98059 for 0.5 hour before exposing them to HG or TGF-β1. Klotho deficiency promoted Egr-1 expression and triggered an increase in the (p-ERK1/2):(ERK1/2) ratio. However, the ERK1/2 signaling inhibitor PD98059 abolished the effects of si-Klotho on Egr-1 expression in HG-treated and TGF-β1-treated HK2 cells. These results suggested that Klotho siRNA-mediated Klotho deficiency promoted ERK1/2 phosphorylation, resulting in Egr-1 upregulation.
Conclusions
In summary, Klotho downregulation appeared earlier than Egr-1 upregulation in the renal cortices of early DKD mice. Klotho might be a potential early marker for DKD progression. Klotho prevented the development of EMT in HG-treated and TGF-β1-treated HK2 cells. Most importantly, Klotho downregulated Egr-1 expression by inhibiting ERK1/2 signaling in HG-treated and TGF-β1-treated HK2 cells. The preventative effects of Klotho on EMT in DKD progression are partially attributable to this phenomenon.
Data availability statement
All data relevant to the study are included in the article or uploaded as supplemental information.
Ethics statements
Ethics approval
All procedures performed in this study were approved by the Institutional Animal Care and Use Committee of the Laboratory Animal Center, Nanfang Hospital, Southern Medical University.
Acknowledgments
We thank Ling Wang of the Department of Endocrinology and Metabolism, Nanfang Hospital, Southern Medical University, Guangzhou, Guangdong, China for technical support.
References
Footnotes
Contributors YuY and YW conceived and designed research; YL, MX, and FH contributed equally to this work, performed the experiments and drafted the manuscript; YaY, FH, YJ, and ZZ analyzed the data; YL, YJ, ZZ, and YW interpreted the results of the experiments; YaY, MX, and FH prepared the figures; YL, YuY, and XL edited and revised the manuscript; XL, YuY and YW approved the final version of the manuscript.
Funding This work was supported by grants from the National Natural Science Foundations of China (grant numbers 81603472 and 81900738), the Natural Science Foundation of Guangdong Province (grant number 2018A0303130216), and the Medical Scientific Research Foundation of Guangdong Province (grant number A2018158).
Competing interests None declared.
Provenance and peer review Not commissioned; externally peer reviewed.