Article Text

Abstract
Introduction Sleep disorders and short sleep duration are common symptoms among people with diabetes. However, the evidence is limited about the associations of post-challenge hyperglycemia and sleep quality or quantity with all-cause mortality in the US general population.
Research design and methods Our study included 8795 adults from the National Health and Nutrition Examination Survey 2005–2014. Mortality data were ascertained through 2015. Multivariable Cox proportional-hazards models were used to estimate adjusted HRs (aHRs) for all-cause mortality according to 2-hour plasma glucose levels during the 75 g oral glucose tolerance test—normal glucose tolerance (NGT), <140 mg/dL; impaired glucose tolerance (IGT), 140–199 mg/dL; and diabetes, ≥200 mg/dL. We then examined the associations of glucose tolerance status and self-reported physician-diagnosed sleep disorders (yes vs no) or sleep duration (<7 vs ≥7 hours) with all-cause mortality.
Results During follow-up (median, 5.6 years), the diabetes group had a higher risk of all-cause mortality compared with the NGT group (aHR (95% CI)=1.93 (1.41 to 2.64)), but not the IGT group (aHR (95% CI)=1.19 (0.90 to 1.59)). When we categorized participants according to glucose tolerance status and sleep disorders, the IGT group with sleep disorders had a higher risk of all-cause mortality (aHR (95% CI)=2.03 (1.24 to 3.34)) compared with the NGT group without sleep disorders. Both diabetes groups with and without sleep disorders also showed high mortality risks. The results were consistent when we used sleep duration instead of sleep disorders.
Conclusions Using the most updated US national data, we found a high risk of all-cause mortality among individuals with IGT having sleep disorders or short sleep duration as well as those with diabetes. Future investigations are needed to identify whether and what kind of sleep management is beneficial for people with impaired glucose metabolism to prevent early death.
- glucose intolerance
- diabetes mellitus
- type 2
- mortality
- epidemiology
Data availability statement
Data are available in a public, open access repository. All data are publicly available at https://wwwn.cdc.gov/nchs/nhanes.
This is an open access article distributed in accordance with the Creative Commons Attribution Non Commercial (CC BY-NC 4.0) license, which permits others to distribute, remix, adapt, build upon this work non-commercially, and license their derivative works on different terms, provided the original work is properly cited, appropriate credit is given, any changes made indicated, and the use is non-commercial. See: http://creativecommons.org/licenses/by-nc/4.0/.
Statistics from Altmetric.com
Significance of this study
What is already known about this subject?
Sleep disorders and short sleep duration are common symptoms among people with impaired glucose metabolism.
It is still unclear whether and to what extent sleep quality and quantity contribute to the risk of all-cause mortality due to impaired glucose tolerance (IGT) among the US general population.
What are the new findings?
Using nationally representative data of US adults, over a median follow-up of 5.6 years, we found no evidence about the association between IGT and increased risk of all-cause mortality.
However, the IGT group with self-reported physician-diagnosed sleep disorders or short sleep duration had a significantly increased risk of all-cause mortality compared with the normal glucose tolerance group without such sleep problems.
How might these results change the focus of research or clinical practice?
Our findings highlight the importance of considering the adverse influence of self-reported sleep problems among individuals with IGT.
Future research is needed to evaluate the clinical benefit of careful monitoring and management of sleep quality and quantity to prevent IGT complications leading to an early death.
Introduction
In 2019, 463 million adults were estimated to have diabetes, and its prevalence is expected to rise to 700 million by 2045.1 Diabetes is an independent risk factor for cardiovascular disease (CVD), cancer, and all-cause mortality,2 3 making it the ninth leading cause of death worldwide according to the WHO.4 The 75 g oral glucose tolerance test (OGTT) is a gold-standard test for diagnosing not only diabetes but also intermediate hyperglycemia such as impaired glucose tolerance (IGT).5 Previous meta-analyses conducted in 1999 and 2004 reported that the risk of CVD was more strongly associated with 2-hour plasma glucose levels during the 75 g OGTT than with fasting plasma glucose levels,6 7 indicating the clinical usefulness of OGTT results in predicting and managing diabetic complications. Given the substantial advancement in diabetes management including antihyperglycemic therapies over the last two decades, it is important to update the evidence linking OGTT results and long-term adverse health outcomes.
Sleep disorders and short sleep duration are common symptoms among people with diabetes and have been major public health issues in modern 24-hour society.8 9 Ample evidence has suggested the critical role of sleep quality and quantity in the management of metabolic disorders including IGT.10 In addition, previous epidemiological studies have shown that sleep disorders and short sleep duration increased the risk of diabetes, CVD, and mortality.11–14 However, it is unclear whether the potential effect of diabetes or IGT on long-term adverse health outcomes differs by sleep quality and quantity in the US general population.
Using the most recent data on nationally representative samples of US adults, we investigated the association between 2-hour plasma glucose levels during the 75 g OGTT and all-cause mortality. We then examined the joint association of post-challenge hyperglycemia and sleep disorders or sleep duration with all-cause mortality.
Research design and methods
Data sources and study population: National Health and Nutrition Examination Survey
Data were obtained from the national representative data from the National Health and Nutrition Examination Survey (NHANES) 2005–2014, in which 75 g OGTT results were available. The NHANES was established by the National Center for Health Statistics (NCHS), designed to evaluate the general health and nutritional status of representative samples of the non-institutionalized civilian population in the USA.15 The NHANES includes data on health interviews, nutrition surveys, physical examinations, and biosample collections in a mobile examination center (MEC). During 2005–2014, the response rate of MEC was 73%. Although the NHANES itself is a cross-sectional design, we created a cohort with follow-up mortality by linking the national mortality data as previous studies did.16 17
Among 9192 adults aged ≥20 years who underwent the 75 g OGTT in the NHANES 2005–2014, we excluded participants receiving antihyperglycemic therapies (n=286) and those with missing data on the covariates described below (n=111). The final analytical sample included 8795 adults. Complete details of each survey have been described elsewhere.15
Exposure ascertainment (OGTT)
The OGTT was administered to subjects who underwent morning laboratory testing after a 9-hour fast. The MEC phlebotomist first assessed an interview and a fasting questionnaire to check for exclusion criteria and ensure fasting compliance. The NHANES excluded participants who were pregnant, had hemophilia, received recent chemotherapy, used insulin or oral medication for diabetes, fasted for <9 hours, refused the test, and did not drink the entire glucose solution within 10 min. After the participants’ initial blood draw, they were asked to drink 75 g of dextrose within a maximum of 10 min. A second blood draw sample was collected 2 hours (±15 min) after drinking the glucose solution.18 Based on the results of the 75 g OGTT, we classified participants into three groups5 —normal glucose tolerance (NGT), <140 mg/dL (<7.8 mmol/L); IGT, 140–200 mg/dL (7.8–11.1 mmol/L); and diabetes (post-challenge hyperglycemia), ≥200 mg/dL (≥11.1 mmol/L).
Sleep disorders
The participants were asked the following two sleep-related questions at their home by trained interviewers using the computer-assisted personal interviewing system: ‘Have you ever told a doctor or other health professionals that you have trouble sleeping?’ and ‘Have you ever been told by a doctor or other health professionals that you have a sleep disorder?’. If the participants answered ‘yes’ to either question, we defined them as reporting a physician diagnosis of sleep disorders. Sleep duration was also self-reported by answering the question ‘How much sleep do you get (hours)?’. Then, we categorized participants into two groups based on the recommended amount of sleep: <7 hours vs ≥7 hours, a lower limit of recommended sleep duration by Centers for Disease Control and Prevention19 and the American Academy of Sleep Medicine.20
Outcome ascertainment
Our outcome of interest was all-cause mortality. We used the NHANES Linked Mortality File, in which the NCHS has linked the NHANES data with data on death certificate records from the National Death Index matching by social security number, name, date of birth, race/ethnicity, sex, state of birth, and state of residence. These files contain mortality follow-up data on NHANES participants through December 31, 2015.21
Covariate ascertainment
Demographic characteristics of the study participants such as age, sex (male or female), races/ethnicities (non-Hispanic white, non-Hispanic black, Mexican-American, or others), education status (<9th grade, 9th–11th grade, high school or general education degree, or more than high school), marital status (married or single), smoking status (never, current, or former), and history of comorbidities (eg, cancer, hypertension, CVD, and stroke) were self-reported at the household interview. Statin intake in the past 30 days was ascertained by in-person examination of the participants’ pill bottles. The Chronic Kidney Disease Epidemiology Collaboration equation was used to calculate the estimated glomerular filtration rate (eGFR) as previously described.22
Statistical analysis
Demographic data are expressed as numbers with proportions (%) or as means with SDs. Baseline characteristics across NGT, IGT, and diabetes groups were compared using analysis of variance for continuous variables and Χ2 tests for categorical variables. Multivariable Cox proportional-hazards models were used to estimate the adjusted HRs (aHRs) and their 95% CIs for all-cause mortality according to the 2-hour glucose levels during the 75 g OGTT. We first adjusted the model for age and sex and then adjusted for race/ethnicity, education status, marital status, and smoking status (model 1). In the fully adjusted model, we included body mass index (BMI), eGFR, history of cancer, CVD, stroke, hypertension, statin prescription in addition to covariates in model 1 (model 2). Trend tests were performed using the median value of the 2-hour plasma glucose levels during the 75 g OGTT in each glucose tolerance category (ie, NGT, IGT, and diabetes) as a continuous variable. To evaluate the mortality risk according to continuous 2-hour glucose levels during the OGTT, we also used a restricted cubic spline regression model using three knots (10th, 50th, and 90th percentiles).
To examine the joint associations of glucose tolerance and self-reported physician-diagnosed sleep disorders with all-cause mortality, we re-analyzed the data by categorizing participants into six groups—NGT without sleep disorders (reference), NGT with sleep disorders, IGT without sleep disorders, IGT with sleep disorders, diabetes without sleep disorders, and diabetes with sleep disorders. Similarly, we examined the joint association of glucose tolerance and self-reported sleep duration with all-cause mortality using the following six categories: NGT with sleep duration ≥7 hours (reference), NGT with sleep duration <7 hours, IGT with sleep duration ≥7 hours, IGT with sleep duration <7 hours, diabetes with sleep duration ≥7 hours, and diabetes with sleep duration <7 hours. The mortality risk according to continuous 2-hour glucose levels during the OGTT was also assessed in each category of sleep disorders and sleep duration, using the restricted cubic spline regression models.
We did the following two additional analyses. First, to evaluate the possible influence of sleep disorders or short sleep duration on mortality risks within the same glucose tolerance levels, we investigated the association between sleep problems and mortality among NGT, IGT, and diabetes group, respectively. Second, given the potential burden of long sleep duration on health,23 we re-analyzed the data categorizing the sleep duration into three groups (ie, <7 hours, 7–<8 hours (reference levels), and ≥8 hours) rather than two groups (ie, <7 hours (reference levels) and ≥7 hours).
We employed survey weights provided by the NCHS to account for unequal probabilities of selection and non-responses; therefore, this study provides unbiased national estimates representative of the US general population. All statistical analyses were conducted using Stata (V.15).
Results
The baseline characteristics of the participants are shown in table 1. Of the 8795 participants, 6754 (76.8%) had NGT, 1471 (16.7%) had IGT, and 570 (6.5%) had diabetes. The mean age of the study participants was 47.8 years, and 50% of the participants were men. Compared with participants with lower 2-hour plasma glucose levels during the 75 g OGTT, those with higher 2-hour plasma glucose levels were predominantly older, Mexican-Americans, married, and former smokers and more likely to have a low education level. They also had higher BMI, lower eGFR, and a higher statin intake, and a higher prevalence of comorbidities, including cancer, hypertension, CVD, and stroke. The difference in baseline characteristics between the eligible NHANES participants who were included in this study (n=8795) and those who were excluded due to missing information on covariates (n=111) can be found in the online supplemental table S1.
Supplemental material
Baseline characteristics according to between 2-hour plasma glucose during the 75 g oral glucose tolerance test (OGTT) in NHANES 2005–2014 followed through 2015 (N=8795)
Two-hour plasma glucose levels during the 75 g OGTT and all-cause mortality
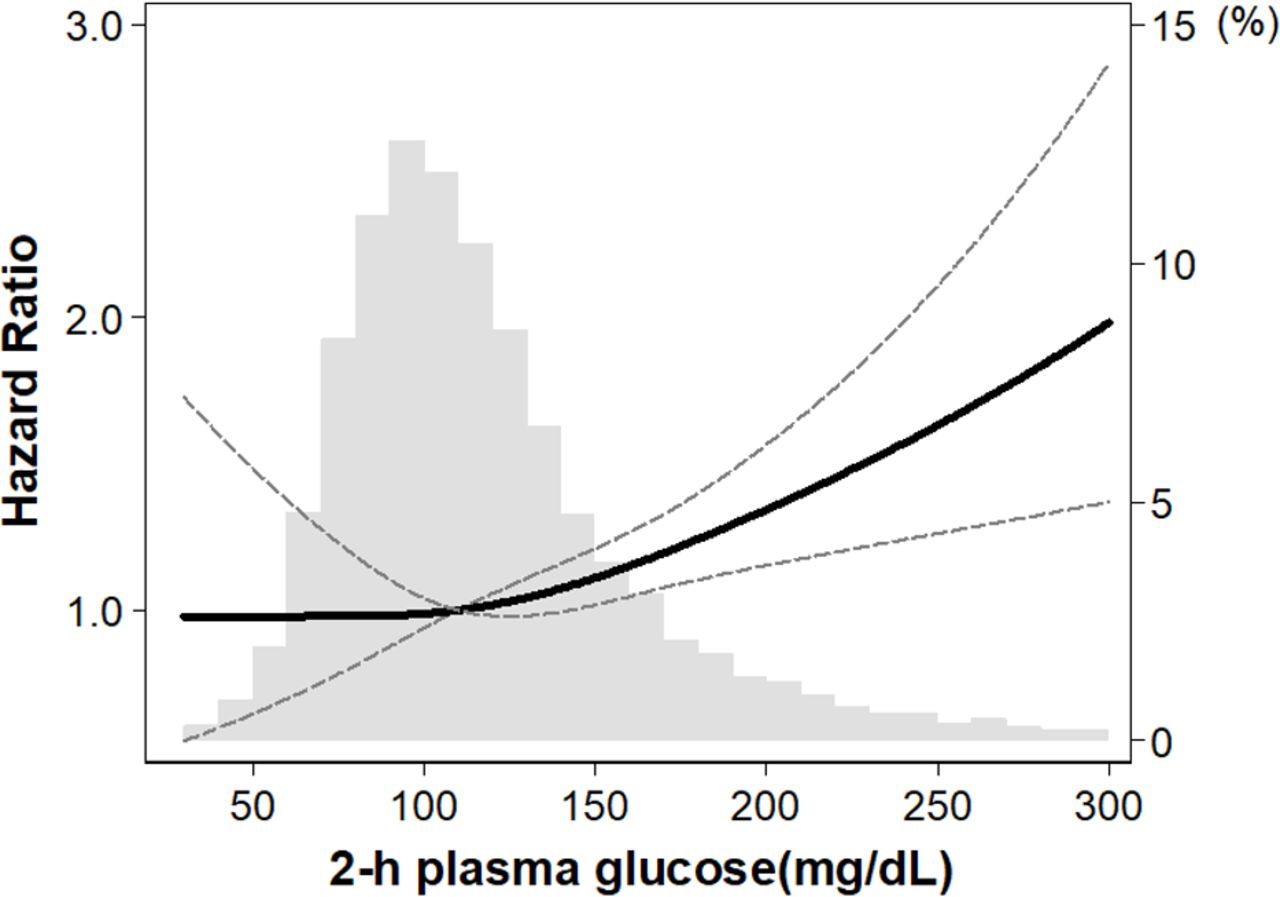
There were 507 (5.8%) deaths during the 49 548 person-years of follow-up (median, 5.6 years). The numbers of cardiovascular and cancer deaths are shown in the online supplemental table S2. Higher 2-hour plasma glucose levels during the 75 g OGTT showed a higher risk of all-cause mortality (aHR (95% CI)=1.03 (1.01 to 1.05) per 10 mg/dL increase in 2-hour plasma glucose levels; table 2). The diabetes group had a higher risk of mortality (aHR (95% CI)=1.93 (1.41 to 2.64)) than the NGT group after adjusting for potential confounders. We found no evidence of the association between the IGT group and all-cause mortality risk (aHR (95% CI)=1.19 (0.90 to 1.59)). However, the increasing trends in aHR were observed with increasing 2-hour plasma glucose levels during the 75 g OGTT (p for trend<0.001). Our flexible model using a restricted cubic spline curve showed the curvilinear association between 2-hour plasma glucose and all-cause mortality risks; we observed a positive relationship above glucose levels of 110 mg/dL, whereas the relationship was null below that level (figure 1).
Associations between 2-hour plasma glucose during the 75 g oral glucose tolerance test (OGTT) and all-cause mortality in NHANES 2005–2014 followed through 2015

Associations between 2-hour plasma glucose during the 75 g oral glucose tolerance test (OGTT) and all-cause mortality using a restricted cubic spline regression model in NHANES 2005–2014 followed through 2015. Y-axis (left) shows HR of all-cause mortality adjusted for age, sex, race/ethnicity, education status, marital status, smoking, BMI, eGFR, history of cancer, hypertension, cardiovascular disease, stroke, and statin prescription. Y-axis (right) shows prevalence of each 2-hour plasma glucose level during the 75 g OGTT among study population. The dashed lines represent the CIs for the restricted cubic spline model (reference is 110 mg/dL (6.1 mmol/L)). The range of 2-hour plasma glucose was restricted to ≤300 mg/dL because of too few data points >300 mg/dL. BMI, body mass index; eGFR, estimated glomerular filtration rate; NHANES, National Health and Nutrition Examination Survey.
Glucose tolerance, sleep disorders, and all-cause mortality
We found the strongest association for all-cause mortality among participants with 2-hour plasma glucose levels ≥200 mg/dL (ie, diabetes group) and no sleep disorders (aHR (95% CI)=2.40 (1.71 to 3.38)), followed by those with diabetes and sleep disorders (aHR (95% CI)=2.18 (1.23 to 3.85)), compared with participants with NGT and no sleep disorders (figure 2A). Among participants with IGT, those who had sleep disorders had a significantly increased risk of all-cause mortality (aHR (95% CI)=2.03 (1.24 to 3.34)), but the association was not significant among those who had no sleep disorders (HR (95% CI)=1.21 (0.88 to 1.67)). We also found an increased risk of all-cause mortality among participants with NGT and sleep disorders (aHR (95% CI)=1.63 (1.20 to 2.20)). Our restricted cubic spline curve revealed that higher 2-hour plasma glucose levels during the OGTT had higher aHRs among people with and without sleep disorders (figure 3A,B). When we analyzed the data in each glucose tolerance status, we found the increased risk of mortality due to sleep disorders among NGT and IGT groups but not among diabetes group (online supplemental table S3).

Associations between 2-hour plasma glucose during the 75 g oral glucose tolerance test and all-cause mortality according to the presence of (A) sleep disorder or (B) short sleep duration in NHANES 2005–2014 followed through 2015. Y-axis shows HR of all-cause mortality adjusted for age, sex, race/ethnicity, education status, marital status, smoking, BMI, eGFR, history of cancer, hypertension, cardiovascular disease, stroke, and statin prescription. BMI, body mass index; eGFR, estimated glomerular filtration rate; IGT, impaired glucose tolerance; NGT, normal glucose tolerance; NHANES, National Health and Nutrition Examination Survey.

Associations between 2-hour plasma glucose during the 75 g oral glucose tolerance test (OGTT) and all-cause mortality according to the presence of sleep disorder or short sleep duration using a restricted cubic spline regression model in NHANES 2005–2014 followed through 2015. In each figure (A, B, C, and D), y-axis (left) shows HR of all-cause mortality and y-axis (right) shows prevalence of each 2-hour plasma glucose level during the 75 g OGTT. The dashed lines represent the CIs for the restricted cubic spline model (reference is 110 mg/dL (6.1 mmol/L)). NHANES, National Health and Nutrition Examination Survey.
Glucose tolerance, sleep duration, and all-cause mortality
We found the strongest association for all-cause mortality in the diabetes group with sleep duration ≥7 hours (aHR (95% CI)=2.17 (1.43 to 3.31)) followed by the diabetes group with sleep duration <7 hours (aHR (95% CI)=1.91 (1.16 to 3.14)), compared with the NGT group with sleep duration ≥7 hours (figure 2B). Among participants with IGT, those with sleep duration <7 hours had a significantly increased risk of all-cause mortality (aHR (95% CI)=1.53 (1.01 to 2.33)), but the association was not significant among those with sleep duration ≥7 hours (aHR (95% CI)=1.19 (0.84 to 1.69)). The association was also not significant among participants with NGT and sleep duration <7 hours (aHR (95% CI)=1.25 (0.89 to 1.76)). In our restricted cubic spline curve, we found the increased mortality risks according to higher 2-hour plasma glucose levels during the OGTT (>110 mg/dL) among both people with sleep duration ≥7 hours (figure 3C) and those with sleep duration <7 hours (figure 3D). We found no evidence of the association between short sleep duration and mortality risks within each glucose tolerance group (online supplemental table S3). The results were consistent when we re-analyzed the data using three categories of sleep duration (<7 hours, 7–<8 hours, and ≥8 hours; online supplemental figure S1).
Discussion
Using data from the most updated national survey of US adults, we found an increased risk in all-cause mortality among individuals with IGT and self-reported physician-diagnosed sleep disorders or short sleep duration but not among those with IGT without these sleep disorders or short sleep duration. Our findings indicate that it is important for clinicians to assess and carefully monitor sleep quality and quantity to reduce mortality risks among individuals with IGT.
To the best of our knowledge, this is the first study to investigate the joint association of glucose tolerance and self-reported sleep problems with all-cause mortality in the US general population over the last two decades. Evidence has shown a high risk of mortality among individuals with post-challenge hyperglycemia (ie, higher 2-hour glucose levels during the 75 g OGTT).24–26 Using data from NHANES II (1976–1980) linked to mortality data through 1992, Saydah et al found that the IGT group showed an increased risk of all-cause mortality,16 but the results have not been updated among the US general population over the last two decades, during which substantial advancement has occurred in diabetes care. In addition, previous studies have shown a relationship between sleep disorders or sleep duration and incident diabetes11 27–29 or incident CVD—a major complication of diabetes.30–33 A recent study among Japanese adults with hypertension showed that the risk of CVD was higher among patients with diabetes and short sleep duration than among those without diabetes and long sleep duration.34 Given the increasing prevalence of pre-diabetes among the US general population35 and the high prevalence of sleep problems among individuals with diabetes,8 our findings provide additional insights into the consideration of sleep quality and quantity when evaluating the risk of mortality among adults with IGT.
Several potential mechanisms have been proposed relating sleep quality and quantity to long-term adverse health outcomes. First, sleep disorders may decrease the levels of the protein hypocretin, which is produced in the hypothalamus, resulting in increased production of the protein colony-stimulating factor-1 (CSF-1).36 CSF-1 induces the production of neutrophils and monocytes that promote the formation of plaques37 ; therefore, activation of this pathway due to sleep disruption could eventually have harmful effects on the cardiovascular system. Second, short sleep duration may disrupt the circadian cortisol, leptin, and ghrelin rhythms,38–40 resulting in the activation of inflammation, an increase in appetite, and a decrease in energy expenditure.41 Given that these inflammation and metabolic dysfunctions facilitate the development of diabetes and its complications, these downstream mechanisms introduced by sleep disorder and short sleep duration may explain the increased risk of all-cause mortality in the IGT group with low quality or short duration of sleep in our study.
It is also noteworthy that we found the increased risk of mortality due to the presence of self-reported physician-diagnosed sleep disorders among people with NGT. This result indicates the importance of sleep quality care even when patients do not have postprandial hyperglycemia. However, because our study focuses on investigating the mortality risk according to the presence of sleep problems in diabetes preventive care, whether and to what extent glucose tolerance status modifies the risk of long-term adverse health outcomes by sleep problems would need to be answered in future research focusing on sleep care.
The main strength of our study is that we used the most updated national data representing US adults with diversity in demographic characteristics, thereby increasing the generalizability of our findings. Moreover, the NHANES has a rigorous and standardized study protocol and has extensive quality control and assurance procedures for data collection, which allowed us to produce robust evidence about the long-term health outcomes of glucose tolerance status and sleep quality or quantity. However, our study has several limitations. First, although we included key variables that could be associated with glucose tolerance status and mortality, our results suffered from bias due to uncontrolled confounders (such as depressive symptoms, unmeasured socioeconomic status, and cancer-related fatigue). Second, glucose tolerance status was assessed only at baseline; therefore, our analyses did not account for time-varying exposure and confounding factors. Given that a previous study showed a conversion rate of IGT to diabetes in the US ranging from 35.8 per 1000 person-years to 87.3 per 1000 person-years,42 some participants in the IGT group might have progressed to diabetes during the follow-up period. Third, there may be misclassification or measurement for sleep disorders and sleep duration because they were self-reported. For example, self-reported physician-diagnosed sleep disorders may not necessarily represent low sleep quality based on quality assessment questionnaire tools such as Pittsburgh Sleep Quality Index. The lack of such detailed information on sleep disturbances limited our ability to assess the influence of severity and subtypes (such as insomnia, sleep apnea, restless legs syndrome, and narcolepsy) of sleep disorders. Lastly, as our data did not have sufficient statistical power to assess cause-specific mortality (eg, cardiovascular and cancer mortality) due to the limited follow-up period, we assessed only all-cause mortality in the present study. Future longitudinal studies with a sufficient set of confounders and longer follow-ups, along with valid assessment tools of sleep quality and quantity, are needed to overcome these limitations and validate our findings.
In conclusion, we found that IGT with self-reported physician-diagnosed sleep disorders or self-reported short sleep duration was associated with a high risk of all-cause mortality among US adults. Careful monitoring and management of sleep quality and quantity might be beneficial to prevent IGT complications leading to early death, which requires further investigation.
Data availability statement
Data are available in a public, open access repository. All data are publicly available at https://wwwn.cdc.gov/nchs/nhanes.
Ethics statements
Ethics approval
The NCHS Research Ethics Review Board approved the study protocol, and all participants provided informed consent prior to data collection. This study was exempted by the Institutional Review Board at the University of California, Los Angeles (IRB# 20-001055).
References
Supplementary materials
Supplementary Data
This web only file has been produced by the BMJ Publishing Group from an electronic file supplied by the author(s) and has not been edited for content.
Footnotes
KI and ES contributed equally.
Contributors KI developed the study concept, analyzed and interpreted the data, wrote the manuscript, and supervised the research. ES developed the study concept, analyzed and interpreted the data, and wrote the manuscript. TY and YT contributed to the discussion and reviewed/edited the manuscript.
Funding KI was supported by National Institutes of Health (NIH)/National Institute of Diabetes and Digestive and Kidney Diseases (NIDDK) grant F99DK126119, Toffler Award in Epidemiology at UCLA, and Honjo International Foundation Scholarship.
Disclaimer The funders had no role in the design and conduct of the study; collection, management, analysis, and interpretation of the data; preparation, review, or approval of the manuscript; and decision to submit the manuscript for publication. This article does not necessarily represent the views and policies of the NIH.
Competing interests None declared.
Provenance and peer review Not commissioned; externally peer reviewed.
Supplemental material This content has been supplied by the author(s). It has not been vetted by BMJ Publishing Group Limited (BMJ) and may not have been peer-reviewed. Any opinions or recommendations discussed are solely those of the author(s) and are not endorsed by BMJ. BMJ disclaims all liability and responsibility arising from any reliance placed on the content. Where the content includes any translated material, BMJ does not warrant the accuracy and reliability of the translations (including but not limited to local regulations, clinical guidelines, terminology, drug names and drug dosages), and is not responsible for any error and/or omissions arising from translation and adaptation or otherwise.