Article Text

Abstract
Introduction Although obesity and hyperinsulinemia are closely intercorrelated, their temporal sequence is still uncertain. This study aims to investigate the temporal relationship patterns between obesity measures and hyperinsulinemia in Chinese adults.
Research design and methods The longitudinal cohort consisted of 2493 participants (860 males and 1633 female, mean age 56.71 years at follow-up) for whom measurements of obesity and hyperinsulinemia measures were collected twice between 2011 and 2014, with an average follow-up time of 3 years. Cross-lagged panel analysis was used to examine the temporal relationship between obesity measures (body mass index (BMI); waist circumference (WC); hip circumference (HC); waist-to-hip ratio (WHR)) and hyperinsulinemia (insulin, homeostasis model assessment of insulin resistance (HOMA-IR), or homeostasis model assessment of beta cell function (HOMA-%β)).
Results After the adjustment of age, sex, smoking, drinking and follow-up years, in the BMI-insulin model, the path coefficient (β2=0.229; p<0.001) of baseline BMI to follow-up insulin was significantly greater than the path coefficient (β1=0.073; p<0.001) of baseline insulin to follow-up BMI (p<0.001 for β2>β1). In the WHR-insulin model, the path coefficient (β1=0.152; p<0.001) of baseline insulin to follow-up WHR was significantly greater than the path coefficient (β2=0.077; p<0.001) of baseline WHR to follow-up insulin (p=0.007 for β1>β2). In the WC/HC-insulin model, the path coefficients of baseline insulin to follow-up WC or HC (β1s) were also greater than the path coefficients of baseline WC or HC to follow-up insulin (β2s), but the difference between β1s and β2s were not significant. The similar temporal patterns were founded between obesity measures with HOMA-IR or HOMA-%β.
Conclusions These findings indicate that there is a bidirectional relationship between obesity and hyperinsulinemia, and abdominal obesity measures are more sensitive to hyperinsulinemia measures than BMI.
- obesity
- insulin resistance
- longitudinal studies
This is an open access article distributed in accordance with the Creative Commons Attribution Non Commercial (CC BY-NC 4.0) license, which permits others to distribute, remix, adapt, build upon this work non-commercially, and license their derivative works on different terms, provided the original work is properly cited, appropriate credit is given, any changes made indicated, and the use is non-commercial. See: http://creativecommons.org/licenses/by-nc/4.0/.
Statistics from Altmetric.com
Significance of this study
What is already known about this subject?
Obesity and hyperinsulinemia are closely intercorrelated. Although obesity is generally thought the cause of hyperinsulinemia, multiple clinical and experimental studies also implied that hyperinsulinemia might precede and promote obesity.
What are the new findings?
We found a bidirectional relationship between obesity and hyperinsulinemia. The temporal effect of insulin, homeostasis model assessment of insulin resistance or homeostasis model assessment of beta cell function on abdominal obesity measures, especially waist-to-hip ratio, were stronger than the inverse effect of abdominal obesity measures. Abdominal obesity measures are more sensitive to hyperinsulinemia measures than body mass index.
How might these results change the focus of research or clinical practice?
These findings highlight the reverse effect of hyperinsulinemia on obesity and suggest further research on the interplay between obesity and hyperinsulinemia.
Introduction
Hyperinsulinemia is an early signal of diabetes. Numerous studies have explored the relationship between obesity and hyperinsulinemia; however, their temporal sequence is still uncertain.1–4 Generally, obesity is thought the cause of hyperinsulinemia, and studies have demonstrated the physiological mechanisms, including dysregulation of lipid and glucose metabolism, inflammation, hormone imbalance, genetic variants and so on.5–9 However, multiple clinical and experimental studies also implied that hyperinsulinemia might precede and promote obesity, rather than the simply adaptive response.10–12 Moreover, many biochemical studies reported the function of insulin on inhibiting lipolysis and promoting lipid accumulation.13–15 Several studies also reported hyperinsulinemia is a valuable predictor for the further weight gain in children and adolescents.16 17 However, convincing evidence of longitudinal studies was still less available and inconsistent in adults. Some studies have reported that adult hyperinsulinemia led to less weight gain or was independent of later obesity.1 18 The temporal relationship between obesity and hyperinsulinemia, unidirectional or bidirectional, is required further explorations.
Body mass index (BMI), an important general obesity index, has been widely used to study the relationship between obesity and hyperinsulinemia.1–3 However, the measurement of BMI alone has some obvious limitations due to its obscure information on body fat distribution.19 20 Emerging evidence indicates that abdominal obesity, assessed by waist circumference (WC), hip circumference (HC) or waist-to-hip ratio (WHR), is also strongly related to insulin levels.21 22 A recent study demonstrated that a modest decrease of circulating insulin was enough to cause significant reduction in visceral fat tissue, without the change of lean mass, indicating that the sensitivity of obesity measures to insulin may be different.23 Although some longitudinal studies have reported the effect of insulin on future weight gain, few studies have included both general and abdominal obesity measures, and emphasize their difference in studying the association between obesity and insulin, especially in Chinese adults.
Using a longitudinal cohort of Chinese adults, the current study aimed to explore the temporal sequences between obesity measures and insulin, homeostasis model assessment of insulin resistance (HOMA-IR), or homeostasis model assessment of beta cell function (HOMA-%β) and examine the impacts of different obesity measures on the temporal patterns between obesity and hyperinsulinemia using the cross-lagged panel analysis model.
Research design and methods
Study cohort
The subjects were from the Shandong cohort of the Risk Evaluation of cAncers in Chinese diabeTic Individuals: an IONgitudinal study (REACTION). The REACTION study is a prospective, multicenter, observational cohort study conducted from 2011, which has recruited more than 200 000 people from 25 communities in China.24 Overall, in Shandong cohort, there were 11 000 participants identified in the baseline survey in 2011, and 6046 subjects completed the next follow-up survey in 2014. Subjects were excluded if they had diabetes or were receiving hypoglycemic treatment at neither the baseline or follow-up measurement. A total of 2493 participants (860 males and 1633 female, mean age 56.71 years at follow-up) were included in the current study, with an average follow-up time of 3 years.
Written informed consent was obtained from all participants.
Measurements
Data were collected by trained investigators or clinical technicians following the standard procedures. All participants were asked to fast for at least 12 hours before the health examinations. Height and weight were measured when subjects wore light clothing and took off their shoes. WC was measured at the midpoint between the lower rib cage and the iliac crest. Hip circumference (HC) was measured at the widest protrusion of buttocks. BMI was calculated as weight in kilograms divided by the square of height in meters. Information on smoking and drinking status was obtained from the health questionnaire. Smoking and drinking were identified by who smoke more than one cigarette per day and drink alcohol every day during the past 12 months.
Blood samples were collected in the morning after a fasting period of no less than 10 hours. Fasting plasma glucose (FPG) was measured within 2 hours. Serum and plasma samples were separated and shipped on dry ice. Fasting insulin levels were measured using the ARCHITECT ci16200 Integrated System (Abbott) at the central laboratory in the Shanghai Institute of Endocrine and Metabolic Diseases. Insulin resistance and beta-cell function were estimated by HOMA-IR and HOMA-%β with the HOMA2 calculator provided by the University of Oxford (https://www.dtu.ox.ac.uk/). Glycated hemoglobin (HbA1c) was measured by high-performance liquid chromatography using the VARIANT II Hemoglobin Testing System (Bio-Rad Laboratories).
Diabetes was defined as self-report of diabetes and/or fasting blood glucose ≥7.0 mmol/L and/or HbA1c ≥6.2% and/or taking glucose-lowering medication including: (1) special diet; (2) weight control; (3) oral medicine; (4) injection of insulin; (5) Chinese traditional medicine; (6) home remedies; and (7) Qi Gong (spiritual method); pre-diabetes was defined as a fasting blood glucose level of 5.6~6.9 mmol/L and/or a HbA1c level of 5.8%~6.2%.
Statistical methods
Characteristics of study variables of baseline and follow-up investigations were compared using generalized linear models for continuous variables and χ2 statistics for categorical variables. The cross-lagged panel analysis, a specific form of path analysis, is a typical statistical approach that simultaneously explores the temporal sequences of intercorrelated variables in a longitudinal study.25 Replicate measurements of obesity and hyperinsulinemia measures at baseline (2011) and follow-up (2014) in this study proves a good database for the subsequent analysis. A classic version of the model is depicted in figure 1. The path coefficient β1 describes the effect of baseline obesity measures on the follow-up insulin levels. The path coefficient β2 describes the effect of baseline insulin on the follow-up obesity measures. The significance of path coefficient β1 or β2 indicates a clear temporal relationship. If β1 and β2 are both significant suggests a bidirectional relationship between obesity measures and insulin. Before the cross-lagged panel analysis, the baseline and follow-up values of obesity measures and insulin were adjusted for age, sex, smoking, and drinking in regression residual analyses and then were standardized by Z-transformation (mean=0; SD=1). Pearson correlation coefficients of the Z-standardized obesity measures and insulin at baseline and follow-up were estimated, with adjustment for follow-up years (online supplemental table S1). The cross-lagged path coefficients (β1 and β2) in the path diagram (figure 1) were evaluated simultaneously based on the correlation matrix, using the structural equation modeling with the R package Lavaan. The validity of model fitting was assessed by root mean square residual (RMR) and comparative fit index (CFI).26 RMR <0.05 and CFI >0.90 suggests a relatively good fit to the observed data. The temporal relationships of obesity measures with insulin, HOMA-IR and HOMA-%β were examined, separately. The difference between β1 and β2 was tested using Fisher’s Z-test. A significant difference between β1 and β2 will afford additional cogency for the temporal sequence, which was indicated by the significance of path coefficients. Furthermore, cross-lagged panel analysis models of obesity and hyperinsulinemia measures were constructed, with adjustment for age, smoking, drinking, and follow-up years in different sex groups, separately.
Supplemental material
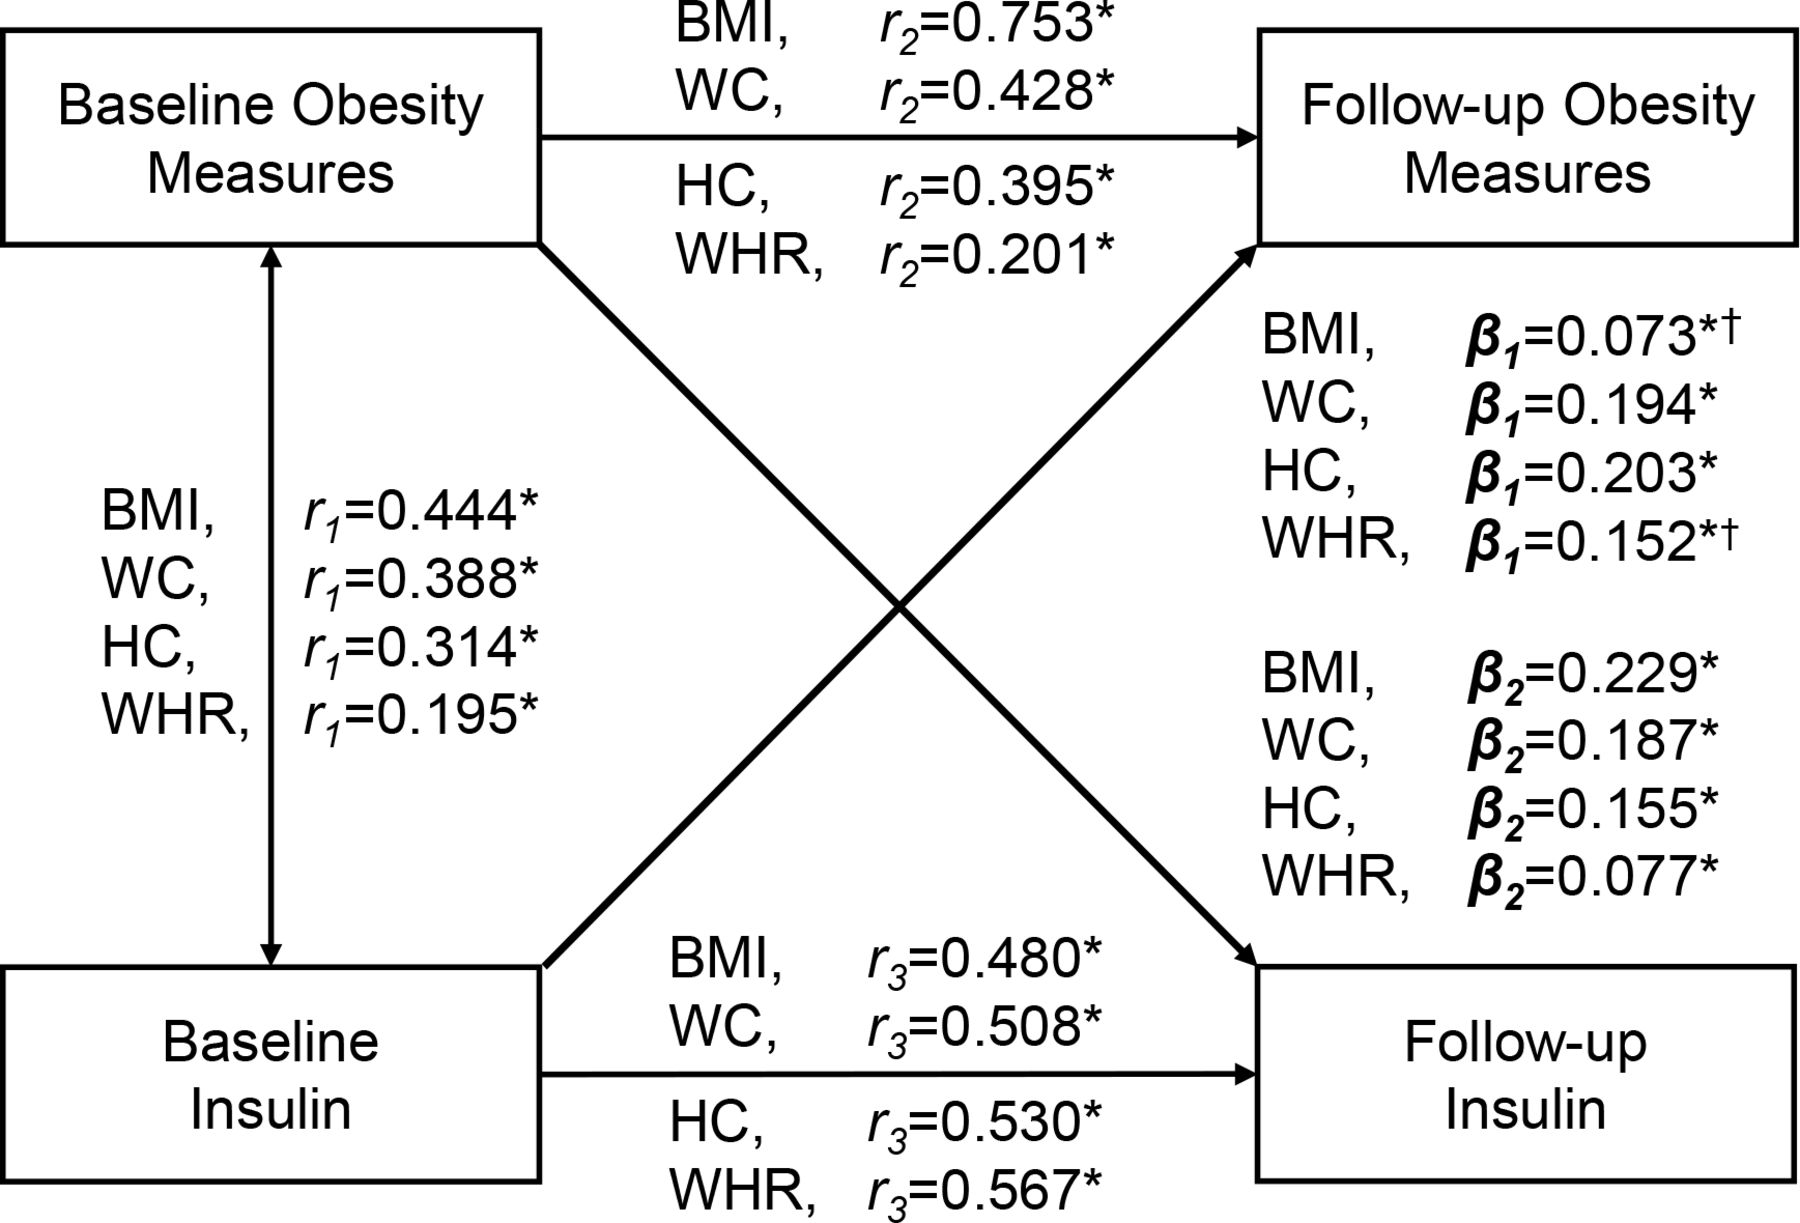
Cross-lagged panel model between obesity measures and insulin, adjusted for age, sex, smoking, drinking and follow-up years. Obesity measures include body mass index (BMI), waist circumference (WC), hip circumference (HC) and waist-to-hip ratio (WHR). β1 and β2 are cross-lagged path coefficients; r1 is synchronous correlations; r2 and r3 are tracking correlations.
Results
Table 1 summarizes the characteristics of 2493 participants (860 males and 1633 females) at baseline and follow-up. The mean baseline age was 53.71 years, and the subjects were followed up for 3 years. BMI, WC, HC, WHR, FPG, insulin, HOMA-IR, HOMA-%β and the proportion of smoking and drinking at follow-up were significantly greater than that at baseline.
Characteristics of study variables in baseline and follow-up
Figure 1 presents the results of the cross-lagged panel analyses of obesity measures and insulin in the total sample, with adjustment of age, sex, smoking, drinking and follow-up years. The path coefficients (βs) of obesity-insulin models were all significant, indicating there were bidirectional relationships between different obesity measures and insulin. In the BMI-insulin model, the path coefficient of BMI → insulin (β2=0.229) was significantly greater than the path coefficient of insulin → BMI (β1=0.073), with p<0.001 for difference between β1 and β2 (β2>β1). Notedly, in the WHR-insulin model, the path coefficient of insulin → WHR (β1=0.152) was significantly greater than the path coefficient of WHR → insulin (β2=0.077), with p=0.007 for difference between β1 and β2 (β1>β2). Similarly, in the WC/HC-insulin model, the path coefficients of insulin → WC/HC (β1wc=0.194, β1Hc=0.203) were also greater than the path coefficients of WC/HC → insulin (β2wc=0.187, β2Hc=0.155), but the difference between β1s and β2s was not significant (β1wc>β2wc, p=0.798; β1Hc>β2Hc, p=0.080). Model fitting parameters were RMR=0.016 and CFI=0.990 in the BMI-insulin model, RMR=0.020 and CFI=0.888 in the WHR-insulin model, RMR=0.007 and CFI=0.996 in the WC-insulin model, and RMR=0.010 and CFI=0.961 in the HC-insulin model suggesting a good fit to the observed data in these models with the criteria of RMR <0.05 and CFI >0.90.
Figure 2 presents the yearly rates of change of obesity measures and insulin according to quartiles of their baseline values in the total sample, with adjustment of age, sex, smoking, drinking and their baseline values. The covariate-adjusted rate of change in insulin during the follow-up period significantly increased across increasing of quartiles of baseline obesity measures, while the rate of change in obesity measures also shown a significantly increasing trend across quartiles of baseline insulin. The results of the rates of change shown in figure 2 were consistent with the bidirectional relationships between obesity measures and insulin in the cross-lagged panel analysis model shown in figure 1.

Yearly rates of change (Δ) of obesity measures and insulin by quartiles of their baseline values in the total sample, with adjustment of age, sex, smoking, drinking and their baseline values. BMI, body mass index; HC, hip circumference; WC, waist circumference; WHR, waist-to-hip ratio.
Table 2 presents the results of the cross-lagged panel analyses of obesity measures and insulin resistance in the total sample, with adjustment of age, sex, smoking, drinking and follow-up years. The path coefficients (βs) of obesity-insulin resistance models were all significant, indicating there were bidirectional relationships between different obesity and insulin resistance measures. In the BMI-insulin resistance model, the path coefficients of BMI → HOMA-IR/HOMA-%β (β2HOMA-IR=0.232, β2HOMA-%β=0.168) were significantly greater than the path coefficients of HOMA-IR/HOMA-%β → BMI (β1HOMA-IR=0.074, β1HOMA-%β=0.051), with p<0.001 for difference between β1s and β2s (β2s>β1s). In the WHR-insulin resistance model, the path coefficients of HOMA-IR/HOMA-%β → WHR (β1HOMA-IR=0.151, β1HOMA-%β=0.136) were significantly greater than the path coefficients of WHR → HOMA-IR/HOMA-%β (β2HOMA-IR=0.080, β2HOMA-%β=0.047), with p=0.011 for β1HOMA-IR>β2HOMA-IR and p=0.022 for β1HOMA-%β>β2HOMA-%β. Similarly, in the WC/HC-insulin resistance model, the path coefficients of HOMA-IR/HOMA-%β → WC/HC were also greater than the path coefficient of WC/HC → HOMA-IR/HOMA-%β, but the difference between β1s and β2s were not significant. Model fitting parameters were RMR ≤0.03 and CFI ≥0.89 in these obesity-insulin resistance models.
The cross-lagged path coefficients in the total sample, with adjustment for covariates
Online supplemental figure S1 illustrates the yearly rates of change of obesity measures and HOMA-IR according to quartiles of their baseline values in the total sample, with adjustment of age, sex, smoking, drinking and their baseline values. The covariate-adjusted rate of change in HOMA-IR during the follow-up period significantly increased across increasing of quartiles of baseline obesity measures, while the rate of change in obesity measures also shown a significantly increasing trend across quartiles of baseline HOMA-IR. The results of the rates of change shown in online supplemental figure S1 were consistent with the bidirectional relationships between obesity measures and HOMA-IR in the cross-lagged panel analysis model shown in table 2.
Online supplemental figure S2 illustrates the yearly rates of change of obesity measures and HOMA-%β according to quartiles of their baseline values in the total sample, with adjustment of age, sex, smoking, drinking and their baseline values. The covariate-adjusted rate of change in HOMA-%β during the follow-up period significantly increased across increasing of quartiles of baseline obesity measures without baseline WHR, while the rate of change in obesity measures also shown a significantly increasing trend across quartiles of baseline HOMA-%β. The results of the rates of change shown in online supplemental figure S2 were consistent with the bidirectional relationships between obesity measures and HOMA-%β in the cross-lagged panel analysis model shown in table 2.
For sensitivity analysis, we examined the temporal relationships between obesity measures and insulin, HOMA-IR or HOMA-%β by sex groups (online supplemental table S5) and found similar bidirectional relationships with those results of the total sample. The path coefficients of obesity → insulin/HOMA-IR/HOMA-%β were greater in men group than in women group, but these differences were only significant in the WC-HOMA-%β and WHR-HOMA-%β models. We further excluded participants with pre-diabetes at baseline and follow-up based on HbA1c data. The results of cross-lagged panel analyses (online supplemental table S6) were substantially similar to the results in table 2, indicating that bidirectional temporal sequence between obesity and hyperinsulinemia was not driven by evolving dysglycemia during the follow-up.
Discussion
In the currents study, we examined the temporal sequences between obesity measures and insulin, HOMA-IR or HOMA-%β using the cross-lagged panel analysis model. The major finding of this research was that we found a bidirectional relationship between obesity and hyperinsulinemia, and the temporal effect of insulin, HOMA-IR or HOMA-%β on abdominal obesity measures, especially WHR, were stronger than the inverse effect of abdominal obesity measures, while the effect of BMI on insulin, HOMA-IR or HOMA-%β was stronger than the inverse effect of insulin, HOMA-IR or HOMA-%β suggesting abdominal obesity measures are more sensitive to hyperinsulinemia measures than BMI. These findings proved a new sight on examining the unappreciated role of hyperinsulinemia in obesity and highlight the impact of general and abdominal obesity measures on the temporal relationship between obesity and hyperinsulinemia.
Although the close intercorrelation between obesity and hyperinsulinemia has been well documented, the temporal relationship between them remains a point of research.2 8 22 27 These studies have shown that excessive obesity is a predictor of increased insulin, and on the contrary, hyperinsulinemia results in weight gain, indicating there is a bidirectional relationship between obesity and hyperinsulinemia. In previous studies, many researchers have reported the causal role of obesity on insulin, by cross-sectional, longitudinal or Mendelian randomization studies.2 27 28 It is widely considered that excess BMI or obesity can cause hyperinsulinemia through multiple mechanisms such as dysregulation of lipid and glucose metabolism, inflammation, hormone imbalance, genetic variants, and so on.5 7–9 In contrary, the inverse effect of insulin on obesity also has been reported. Many studies reported the treatment of insulin led to subsequent obesity in diabetic patients,10 11 and the significant weight loss was observed in patients treated by the inhibitors of insulin secretion, diazoxide or octreotide, after the marked decrease in insulin levels.12 29 30 Furthermore, in recent series studies, the fact that mice with the disruption of insulin secretion or fat-specific insulin receptor genes were prevented from high-fat diet induced adiposity, providing directly genetic evidence on the inverse effect of hyperinsulinemia on weight homeostasis.23 31–33 The notable ‘ticking clock’ hypothesis also provides a plausible explanation for the insulin-induced weight gain.34 Moreover, in large longitudinal studies, several researchers had reported the prediction of hyperinsulinemia on subsequent obesity in humans.3 17 32 Recently, Astley et al4 study also provided a piece of convincing evidence on the causal role of insulin on obesity by using Mendelian randomization analysis. Taken together, evidence from our study and others indicated that the regulation of insulin on obesity was also existing, and there was a bidirectional relationship between obesity and hyperinsulinemia.
Notably, we also observed a bidirectional relationship between multiple obesity measures and insulin resistance (HOMA-IR and HOMA-%β). One potential explanation is that participants enrolled in our study were not diabetics and had normal glucose tolerance and beta cell function; the excessive obesity stimulated the compensatory of insulin hypersecretion and resulted in the development of hyperinsulinemia and insulin resistance, then the increased insulin level, in turn, promoted later life obesity by impacting energy homeostasis and fat deposition.31 35 The compensatory of increased beta cell function caused by excess obesity in this study and the observation of weight gain in insulin resistance patients without diabetes mellitus in previous researches do support our hypotheses.3 36
As the surrogate for general obesity, BMI is widely used to study the relationship between obesity and hyperinsulinemia. However, several evidence suggest that WHR is also a valuable choice for investigating the link between obesity and insulin by providing additional information about abdominal adiposity disruption.21 22 In this study, we examined the impacts of obesity measures on the temporal relationship between obesity and hyperinsulinemia and found that the effects of insulin on abdominal obesity measures, especially WHR, were stronger than the inverse effects of abdominal obesity measures, while the effect of BMI on insulin was stronger than the inverse effect of insulin. HOMA-IR and HOMA-%β have shown similar patterns. Our observations indicated that abdominal obesity measures were more sensitive to insulin levels than BMI. In biochemical studies, many researchers have reported the function of insulin on inhibiting lipolysis and promoting lipid accumulation in white adipose tissue, which is widely distributed in body subcutaneous and viscera tissue.15 32 In animal models, the Ins1+/+: Ins2−/− mice were observed to exhibit a robust increase in fat-lean rate and size of adipocytes when compared with Ins1+/−: Ins2−/− mice, whose insulin secretion were suppressed by insulin genes knockout.31 Similarly, in recent Page et al23 study, with a significant reduction in visceral fat storage and no changed lean mass, diet-induced mice obesity was reversed by a modest inhibition of circulation insulin. Several studies also have reported the effect of insulin hypersecretion on skinfold thickness in humans.16 37 Together, these results indicate the abdominal obesity might be more susceptible to insulin levels than general obesity. To date, no studies have examined the temporal relationship between obesity and hyperinsulinemia, involving both general and abdominal obesity measures in a longitudinal cohort of Chinese adults, and underscore the impacts of multiple obesity measures on the temporal sequences between obesity and hyperinsulinemia. Furthermore, this study also shown similar temporal patterns between obesity and hyperinsulinemia by sex groups with those findings of the total sample. The path coefficients of baseline WC or WHR to follow-up HOMA-%β were significantly greater in men group than in women group, but the mechanisms were still unclear.
The major strength of this study was the use of cross-lagged panel analysis, which is a powerful method for dissecting the temporal sequences between intercorrelated variables. Another advantage is that we included all the general and abdominal obesity measures in one study and examine their impacts on the temporal sequences between obesity and hyperinsulinemia at the same time. There were some limitations of this study that also need to be noted. First, the definition of diabetes and drug information were only according to the health questionnaires. The potential mission of disease and treatment information might exist. Second, this study only recruited Chinese adults. These findings of our study may not be generalizable to other ethnic populations.
Conclusions
In summary, we found a bidirectional relationship between obesity and hyperinsulinemia by using the cross-lagged panel analysis. Notably, we demonstrated that the effects of hyperinsulinemia measures on abdominal obesity measures, especially WHR, were stronger than the inverse effects of abdominal obesity measures. The effect of BMI on hyperinsulinemia measures were stronger than the inverse effect of hyperinsulinemia measures, suggesting abdominal obesity measures are more sensitive to hyperinsulinemia measures than BMI. These findings highlight the reverse effect of hyperinsulinemia on obesity and suggest further research on the interplay between obesity and hyperinsulinemia.
References
Supplementary materials
Supplementary Data
This web only file has been produced by the BMJ Publishing Group from an electronic file supplied by the author(s) and has not been edited for content.
Supplementary Data
This web only file has been produced by the BMJ Publishing Group from an electronic file supplied by the author(s) and has not been edited for content.
Footnotes
CX and GZ contributed equally.
Contributors CX, GZ, TZ and JZ generated the hypothesis, directed implementation, and wrote the manuscript. GZ and TZ contributed to analytic strategy and statistical analyses. MZ, XZ, LF, QG, HZ, LG and JZ supervised the field activities and data collection and edited the manuscript.
Funding This study was supported by grants from National Natural Science Foundation of China (81670720, 81973147, 81573246, and 81974124), Cheeloo Young Scholars Program of Shandong University, and special funds for Taishan Scholar Project (No. tsqn20161071).
Disclaimer The funders had no role in study design, data collection and analysis, decision to publish, or preparation of the manuscript.
Competing interests None declared.
Patient consent for publication Obtained.
Ethics approval The study protocols were approved by the Committee of Human Research at Ruijin Hospital, Shanghai Jiao Tong University School of Medicine (NCT01506869). Written informed consent was obtained from all participants.
Provenance and peer review Not commissioned; externally peer reviewed.
Data availability statement Data are available on reasonable request.
Supplemental material This content has been supplied by the author(s). It has not been vetted by BMJ Publishing Group Limited (BMJ) and may not have been peer-reviewed. Any opinions or recommendations discussed are solely those of the author(s) and are not endorsed by BMJ. BMJ disclaims all liability and responsibility arising from any reliance placed on the content. Where the content includes any translated material, BMJ does not warrant the accuracy and reliability of the translations (including but not limited to local regulations, clinical guidelines, terminology, drug names and drug dosages), and is not responsible for any error and/or omissions arising from translation and adaptation or otherwise.