Article Text

Statistics from Altmetric.com
Introduction
The figures for currently observed as well as projected global diabetes prevalence from the IDF (International Diabetes Federation) atlas are the standard sources when reporting the burden of diabetes. The IDF considers their projections to be conservative estimates and some have criticized the numbers for underestimating the future burden of diabetes.1–3
This letter gives a numerical quantification of the difference between projected and observed global diabetes prevalence presented in the IDF Diabetes Atlas.
Research design and methods
Data on observed (projected) global diabetes prevalence for the age range 20–79 from the years 2003 (projected estimate for 2025), 2007 (2025), 2010 (2030), 2011 (2030), 2013 (2035), 2015 (2040), 2017 (2045), and 2019 (2045) were obtained from the IDF website.
To quantify the difference in observed versus projected prevalence and the lead time of the observed versus projected prevalence, we performed two analyses, one on the prevalence scale and one on the time scale. In both analyses, we estimated two linear regression models, one for the observed, and one for the projected data where the regression lines in both models were restricted to have identical slopes, but different intercepts. Proceeding this way, the difference between intercepts can be interpreted as the underestimation of prevalence on the prevalence scale, or, on the time scale, as the lead time of the observed to the projected prevalence.
Results
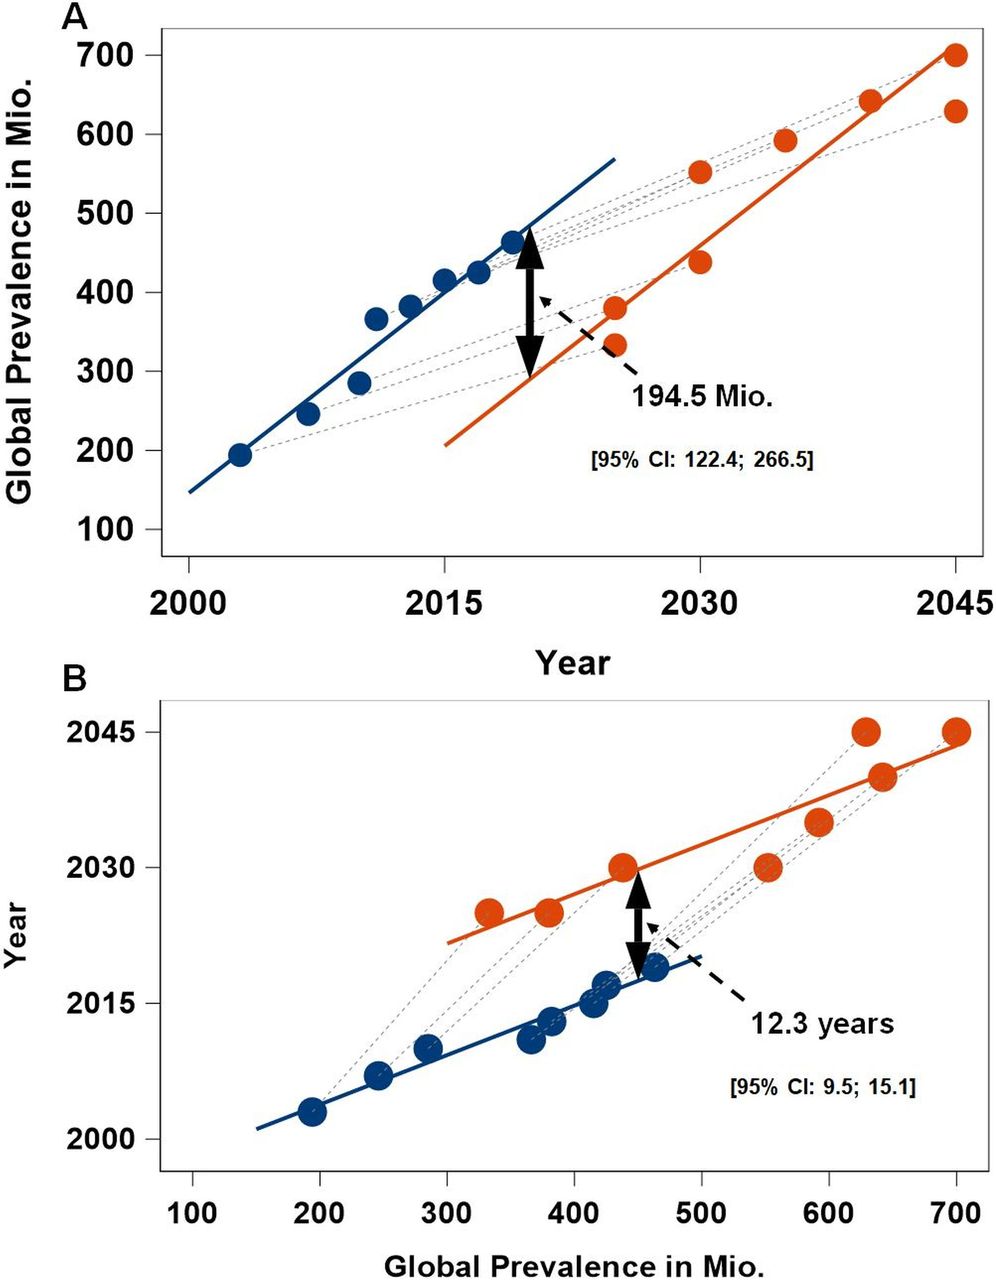
In figure 1, we show observed and projected prevalences. There is an apparent underestimation of diabetes prevalence (figure 1A) and of the time point at which a projected prevalence will be reached (figure 1B).

Comparison of observed (blue) and projected (red) global diabetes prevalence as given by the IDF. Regression lines were estimated from two linear regression models restricted to have identical slopes, but different intercepts. Differences between observed and projected prevalences are reported on the prevalence scale (A), and on the time scale (B). IDF, International Diabetes Federation.
Based on the two analyses, we find the underestimation of prevalences to be 194.5 million with a 95% CI of (122.4 to 266.5) (figure 1A), and the lead time to be 12.3 years with a 95% CI of (9.5 to 15.1) (figure 1B).
Conclusions
We found substantial underestimations in the IDF projections of diabetes prevalence. However, it should also be noted that exclusion of data before 2011 resulted in far smaller underestimations of future prevalence (data not shown). This improvement might reflect methodological changes in the projection undertaken in 2011, which mainly concern the process of researching and selecting the studies from which data are extracted.4
One reason for the underestimation might be that the IDF method essentially uses current age-specific prevalence estimates and multiplies these estimates with the projected future age distribution of the population. While this approach is simple, it comes at the cost of ignoring trends in mortality and incidence of diabetes, which are the main drivers of future prevalence.5 Alternatively, multistate models could be used to account for future trends in mortality and incidence, as has been done in some country-specific projections.5 6 For more information on different methodological approaches for chronic disease projection, Milan et al7 provide an overview of existing projection models in the context of chronic diseases. In this regard, further research is needed to identify next steps that improve global projections of diabetes prevalence.
We finally would like to emphasize that our results are by no means intended to undermine the important role and considerable effort of the IDF in providing critical data on the future global burden of diabetes. Rather, we intend to support the ongoing discussion on the underestimation of projected prevalence with quantitative evidence. We acknowledge that projections of the future are subject to assumptions and that data and resource constraints might hamper the use of more sophisticated methods. Importantly, steps to arrive at more accurate projections seem to already have been successful, considering the underestimation is substantially smaller after a change in IDF methodology in 2011.
Ethics statements
Footnotes
Contributors OK analyzed the data and wrote the manuscript. TT wrote the manuscript. WR, AH and RB contributed to the discussion for important intellectual content. All authors revised the manuscript critically and approved the final version of the manuscript.
Funding The authors have not declared a specific grant for this research from any funding agency in the public, commercial or not-for-profit sectors.
Competing interests None declared.
Provenance and peer review Not commissioned; externally peer reviewed.