Article Text

Abstract
Introduction This study aimed to determine the prevalence of diabetic kidney disease (DKD) and rapid renal function decline and to identify indices associated with this decline among adults attending a diabetes center in Northern Europe.
Research design and methods This is a retrospective cohort study of 4606 patients who attended a diabetes center in Ireland between June 2012 and December 2016. Definition/staging of chronic kidney disease used the Kidney Disease: Improving Global Outcomes (KDIGO) 2012 classification based on data from the most recently attended appointment. Relevant longitudinal trends and variabilities were derived from serial records prior to index visit. Rapid renal function decline was defined based on per cent and absolute rates of estimated glomerular filtration rate (eGFR) change. Multiple linear regression was used to explore the relationships between explanatory variables and per cent eGFR change.
Results 42.0% (total), 23.4% (type 1 diabetes), 47.9% (type 2 diabetes) and 32.6% (other diabetes) had DKD. Rapid decline based on per cent change was more frequent in type 2 than in type 1 diabetes (32.8% vs 14.0%, p<0.001). Indices independently associated with rapid eGFR decline included older age, greater number of antihypertensives, higher log-normalized urine albumin to creatinine ratio (LNuACR), serum alkaline phosphatase, thyroid stimulating hormone, variability in systolic blood pressure and variability in LNuACR, lower glycated hemoglobin, high-density lipoprotein cholesterol and diastolic blood pressure, and lack of ACE inhibitor/angiotensin receptor blocker prescription.
Conclusions DKD (using the KDIGO 2012 classification) and rapid eGFR decline were highly prevalent among adults attending a hospital-based diabetes clinic in a predominantly Caucasian Northern European country. The burden was greater for adults with type 2 diabetes. Expected as well as potentially novel clinical predictors were identified.
- kidney diseases
- diabetes complications
- nephrology
Data availability statement
Data that support the findings of this study are available from the corresponding author upon reasonable request. All data relevant to the study are included in the article or uploaded as supplemental information.
This is an open access article distributed in accordance with the Creative Commons Attribution Non Commercial (CC BY-NC 4.0) license, which permits others to distribute, remix, adapt, build upon this work non-commercially, and license their derivative works on different terms, provided the original work is properly cited, appropriate credit is given, any changes made indicated, and the use is non-commercial. See: http://creativecommons.org/licenses/by-nc/4.0/.
Statistics from Altmetric.com
Significance of this study
What is already known about this subject?
Diabetes mellitus is the leading cause of chronic kidney disease in the developed world.
Potentially modifiable risk factors include poor glycemic control, hypertension, hypercholesterolemia, smoking, obesity, sedentary lifestyle, metabolic syndrome and insulin resistance.
What are the new findings?
Diabetic kidney disease was identified in 42% of adults with diabetes (23.4% (type 1 diabetes), 47.9% (type 2 diabetes) and 32.6% (other diabetes)).
14.3% and 28.5% of patients with diabetes were classified as ‘rapid decliners’ based on absolute and per cent rate of decline, respectively. In addition to established risk factors, less well-recognized risk associations for renal functional decline (variability in systolic blood pressure and urine albumin to creatinine ratio, alkaline phosphatase and thyroid stimulating hormone) were identified.
How might these results change the focus of research or clinical practice?
The relatively high prevalence of diabetic kidney disease and ‘rapid decliners’ in a well-managed cohort of adults with diabetes highlights the need for urgent public health intervention and for optimization of diabetic kidney disease prevention/treatment strategies.
Novel risk associations may provide new therapeutic targets, but further study is warranted.
Introduction
Up to 451 million adults worldwide have diabetes mellitus (DM).1 This is expected to rise to 693 million adults by 2045.1 DM is the leading cause of chronic kidney disease (CKD) in the developed world,2 accounting for 30%–50% of all people with CKD.3 CKD due to DM, referred to as diabetic kidney disease (DKD), is defined as abnormal renal function (estimated glomerular filtration rate (eGFR) <60 mL/min/1.73 m2) and/or the presence of persistent albuminuria (urine albumin to creatinine ratio (uACR) >3 mg/mmol).4 The reported prevalence of DKD among individuals with DM varies by region and type of DM: 27.9% (type 2 diabetes mellitus, T2DM) in Spain,5 32.4% (type 1 diabetes mellitus, T1DM)/42.3% (T2DM) in the UK,6 47.0% (T2DM) in France7 and 63.9% (T2DM) in Shanghai, China.8 While this is, in part, due to true variance in the prevalence of DKD among different populations, it also reflects the heterogeneity of the populations under study (T1DM vs T2DM vs DM due to other causes; primary vs secondary care; medical insurance fund vs national databases), the equations used to calculate eGFR,9 the availability of laboratory services to routinely measure serum creatinine and urinary albumin, and the lack of uniformity in defining DKD. There are no accurate prevalence data for DKD in Ireland; previous reports focused on the prevalence of self-reported DKD10 or audits of albuminuria.11
DKD is the leading cause of end-stage renal disease (ESRD)12 and is associated with most of the excess all-cause and cardiovascular mortality in patients with DM.13 In the National Health and Nutrition Examination Survey (NHANES) III, 10-year cumulative standardized mortality increased from 7.7% among patients without DM/kidney disease to 11.5% among patients with T2DM but without kidney disease, to 31.1% among patients with T2DM and kidney disease.14 Patients who progress to ESRD have an approximately 20% annualized mortality rate.15 In the Finnish Diabetic Nephropathy (FinnDiane) study, participants with T1DM but no CKD have a standardized mortality ratio similar to that of the general population, irrespective of duration of diabetes, whereas increasing severity of DKD is associated with increased all-cause mortality.16 Known potentially modifiable risk factors include poor glycemic control, hypertension, hypercholesterolemia, smoking, obesity, poor socioeconomic circumstances, sedentary lifestyle, metabolic syndrome, insulin resistance, vitamin D deficiency and recurrent episodes of acute kidney injury.13 Regional variations of these risk factors exist due to differences in culture, prescribing practices and available therapies. Moreover, for reasons that remain incompletely understood, progression rates of DKD (rate of decline/time to ESRD) are highly variable among cohorts of people with DM. There is also considerable heterogeneity in the methodology used to calculate the rate of change of renal function itself (eg, absolute vs percentage change).17 Tools for the early identification of patients at risk of rapid progression to ESRD would permit a more aggressive targeted multidisciplinary approach to renal and cardiovascular protection as well as better-designed clinical trials of novel interventions.
The main aims of this study were to define the prevalence of DKD and rapid renal functional decline among adults attending a hospital-based diabetes center in Northwestern Europe and to determine the clinical and laboratory indices associated with this decline.
Methods
Study design
A retrospective cohort study was carried out. All patients who attended an outpatient DM clinic at the Galway University Hospitals (GUH) Diabetes Center between June 2012 and December 2016 were identified from DIAMOND (Hicom, Woking, UK), an electronic clinical DM database.18 During the study period, clinical practice in the primary care catchment area was to refer patients with newly diagnosed DM to GUH for ongoing management. The inclusion criteria were a diagnosis of DM and age ≥18 years at the time of study enrollment. The exclusion criteria were a primary diagnosis of gestational DM, impaired glucose tolerance or impaired fasting glucose.
Data collection at last attended clinic visit
Index data were collected at the last attended clinic visit on record. Clinical demographics, body mass index (BMI), systolic blood pressure (SBP) and diastolic blood pressure (DBP) were recorded. Type (T1DM, T2DM, other forms of DM) and duration of DM (as recorded on the electronic patient database) as well as current medications were noted. The number of antihypertensives was calculated as the number of different classes of antihypertensive agents prescribed at last attended clinic visit.
Laboratory data
Index laboratory data (the value for each laboratory parameter closest to the clinic date) were obtained following interrogation of GUH electronic patient administration system. Values for plasma glycated hemoglobin (HbA1c), serum creatinine, alkaline phosphatase (ALP), alanine aminotransferase (ALT), total cholesterol, high-density lipoprotein cholesterol (HDL-C), free thyroxine (T4) and thyroid stimulating hormone (TSH) and uACR were recorded. eGFR was calculated using the four-parameter Chronic Kidney Disease Epidemiology (CKD-EPI) formula.19 The value for eGFR closest to the index clinic visit was designated the index eGFR. The first available eGFR in the 6 years preceding the index visit was designated the baseline eGFR. Creatinine was measured using the isotope dilution mass spectrometry-traceable creatininase assay. Electrolytes, urinary creatinine and lipids were measured using conventional Roche Diagnostics assays (ISO 15189:2012 standards).
Variability in clinical and laboratory indices
For SBP, DBP and BMI, all values on DIAMOND from 2004 to the index clinic date were recorded. For HbA1c, uACR, total cholesterol and HDL-C, all laboratory values for the 6 years prior to the index clinic date were recorded. Variability in each value for each participant was expressed as SD and was calculated for participants for whom ≥2 values were available. To adjust for intraindividual differences in the number of measurements of each variable available, the adjusted SD was calculated for each variable using the formula: SD/√[n/(n−1)].20
Rate of change in renal function
To calculate rate of change in renal function, eGFR was calculated for all creatinine values during the 6 years prior to the index clinic date. Linear mixed-effects models (incorporating random within-subject trajectories of eGFR over time) were used to generate individual-specific eGFR slopes. These models were applied to untransformed eGFR measurements to estimate absolute change in eGFR (mL/min/1.73 m2/year), and to log-transformed eGFR measurements to estimate percentage change (% change per year). These slopes represent the change in renal function over time for each participant incorporating all eGFR measurements. Progressive decline in renal function among participants with DM (decliners) was defined as either an absolute reduction in eGFR per year of ≥3.5 mL/min/1.73 m2/year21 or proportionate eGFR loss per year of >3.3%.22 The Kidney Failure Risk Equation (KFRE) was used to calculate the 5-year probability of progression to ESRD requiring treatment with dialysis or transplant in patients with eGFR <60 mL/min/1.73 m2.23
Definition and classification of DKD
Among participants meeting the inclusion criteria, DKD was defined as uACR >3 mg/mmol and/or eGFR <60 mL/min/1.73 m23 15 at the time of enrollment. For classification and risk stratification of CKD, participants were subgrouped according to the Kidney Disease: Improving Global Outcomes (KDIGO) 2012 Clinical Practice Guideline for the Evaluation and Management of Chronic Kidney Disease classification system, which groups CKD by glomerular filtration rate and albuminuria categories4 (figure 1) and according to DM etiology (all, T1DM, T2DM, other DM).
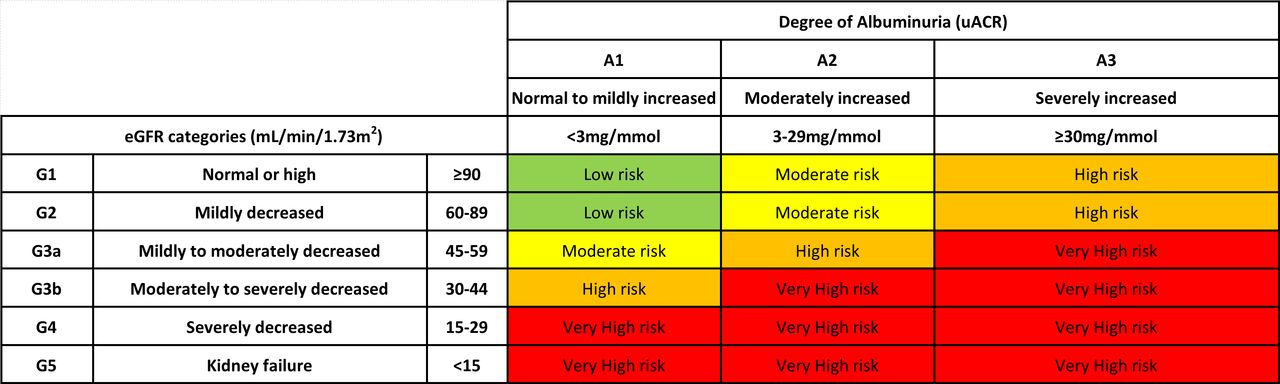
Prognosis of diabetic kidney disease by eGFR and albuminuria category.4 eGFR, estimated glomerular filtration rate; uACR, urine albumin to creatinine ratio.
Statistical analyses
Microsoft Excel V.2016, GraphPad Prism (V.6.01), Minitab V.17.1.0 and R24 were used for data recording and statistical analyses. Participants who were receiving renal replacement therapy (RRT), had undergone kidney transplant or in whom either eGFR or uACR values were unavailable were included only for calculating the prevalence of DKD. Multiple linear regression models were used to explore the relationships between explanatory variables and response variables (% change in eGFR per year). Binary logistic regression analyses were performed using decliner status (−3.3% eGFR/year) or uACR >3 mg/mmol as the dependent variables. Four models each for multiple linear and logistic regression analyses were used: model 1: relevant biochemical and urinary indices; model 2: relevant clinical indices; model 3: variability indices; model 4: stepwise regression using all indices from models 1 to 3 (α to enter=0.15; α to remove=0.15). For the regression models, changes in renal function were assessed on the logarithmic rather than the absolute scale as log-eGFR is more likely to be normally distributed and to have linear within-patient trajectories compared with untransformed eGFR. Furthermore, the use of percentage change rather than absolute change was preferred on the basis that the biological/clinical significance of an absolute change in eGFR is dependent on starting eGFR. Patients with missing data were excluded from the regression analyses. A p value <0.05 was considered statistically significant.
Results
A total of 4604 adults with DM met the study inclusion criteria (T1DM 22.8% (n=1051), T2DM 75.3% (n=3467), other DM 1.9% (n=86)). The etiologies for the other DM category are listed in online supplemental table 1.
Supplemental material
Prevalence of DKD and DKD-associated risk among study participants
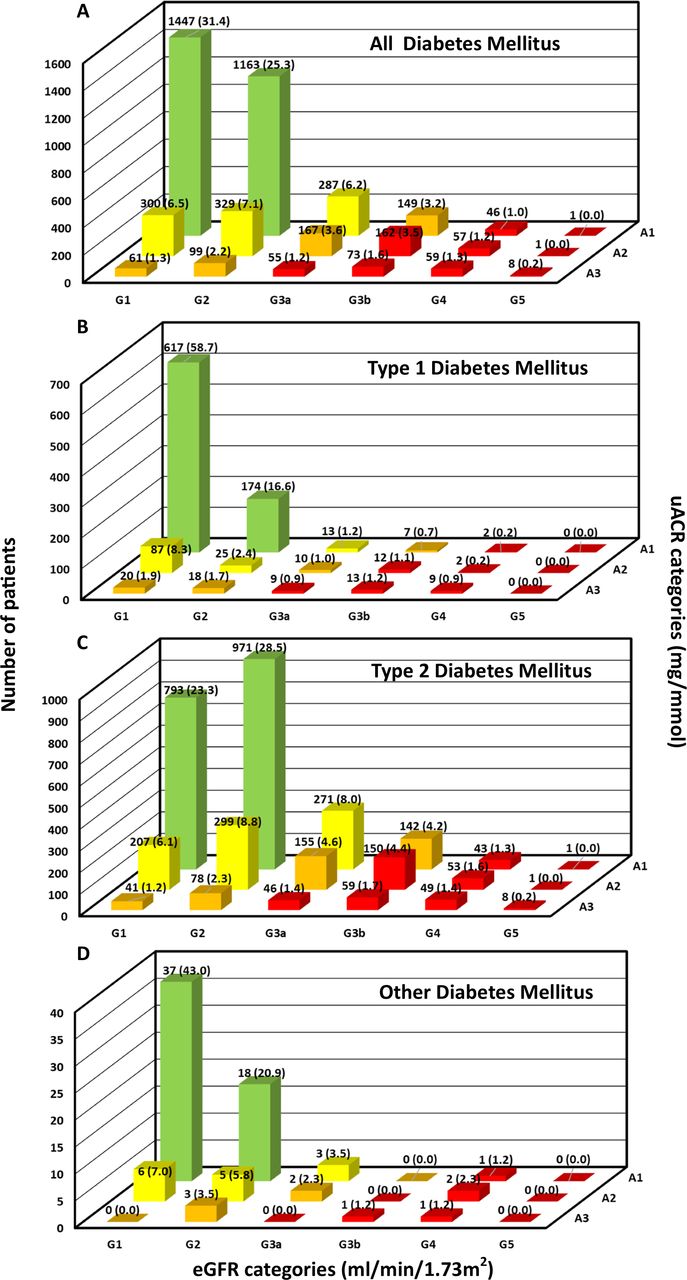
In total, 42.0% (total cohort), 23.4% (T1DM), 47.9% (T2DM) and 32.6% (other DM) had DKD. A greater proportion of participants with T2DM than T1DM had DKD (p<0.001). Classification of CKD based on the KDIGO 2012 Clinical Practice Guideline4 for the total cohort and for T1DM, T2DM and other DM subgroups is shown in figure 2A–D (complete numerical data presented in online supplemental table 2). Following exclusion of patients receiving RRT, postrenal transplant or in whom insufficient data were available to assign DKD subcategory, greater proportions of adults with T2DM were in the moderate-risk, high-risk and very high-risk CKD subcategories compared with those with T1DM (moderate: 23.1% vs 12.3%; high: 12.4% vs 5.4%; very high: 12.1% vs 4.6%; p<0.001).

(A) Prevalence of DKD among all patients with DM (n=146, 3.2% RRT, renal transplant or insufficient data to categorize). (B) Prevalence of DKD among patients with type 1 DM (n=33, 3.1% RRT, renal transplant or insufficient data to subcategorize). (C) Prevalence of DKD among patients with type 2 DM (n=106, 3.1% RRT, renal transplant or insufficient data to subcategorize). (D) Prevalence of DKD among patients with other DM (n=7, 8.1% RRT, renal transplant or insufficient data to subcategorize). DKD, diabetic kidney disease; DM, diabetes mellitus; eGFR, estimated glomerular filtration rate; RRT, renal replacement therapy; uACR, urine albumin to creatinine ratio.
Variations in clinical indices across DKD subcategories
For those patients who were not receiving RRT, postrenal transplant or had insufficient data to assign to a DKD subcategory (n=4464), trends for HbA1c, duration of DM, age, SBP, DBP, BMI, serum total cholesterol and serum HDL-C were determined across the KDIGO subcategories for the total cohort and separately for the T1DM and T2DM subgroups (online supplemental tables 3A–C–10A–C). The observed trends for the total cohort were generally in keeping with known associations and physiological effects of DKD.25 26 For example, mean values for HbA1c, SBP, DBP, total cholesterol and HDL-C reflected worsening glycemic, blood pressure (BP) and lipid parameters within the cohort as degree of albuminuria increased. Nonetheless, some separate findings for T1DM and T2DM subgroups were notable. For example, the median duration of DM in those with T1DM with more severe albuminuria and lower eGFR was shorter than in those with T2DM (online supplemental table 4B,C). Also, DBP tended to be higher with increasing grade of albuminuria among the T1DM but not the T2DM cohort (online supplemental table 7B,C). Increasing severity of albuminuria was associated with increasing serum total cholesterol among the T1DM but not the T2DM cohort (online supplemental table 9B,C). In addition, in all groups, HbA1c was highest among patients with eGFR ≥90 mL/min/1.73 m2 (p<0.001) and increased as stage of albuminuria progressed (p<0.001) (online supplemental table 3A). Fifty-nine (1.3%) participants were non-Caucasian.
Rate of change of renal function/risk of ESRD
Sufficient data were available to calculate the rate of change in renal function in 87.25% (3894 of 4464) of participants. The median duration of time from baseline eGFR value to index clinic visit was 5.48 (0.12–6.00) years. The proportions of participants defined as rapid decliners either based on absolute or per cent decline per year (table 1) and the calculated rates of decline in renal function (online supplemental tables 11A–D and 12A–D) increased with higher eGFR category and degree of albuminuria. In the total cohort, 14.3% and 28.5% were classified as rapid decliners based on absolute and per cent rate of decline, respectively. In the case of per cent change, a strikingly higher proportion of patients with T2DM (32.8%) than T1DM (14.0%) were classified as rapid decliners (p<0.001). In contrast to the trends for rate of eGFR decline, when 5-year risk of ESRD was calculated for participants with index eGFR <60 mL/min/1.73 m2 using the KFRE, a higher proportion of those with T1DM were categorized as high risk compared with those with T2DM (27.3% vs 11.4%, p<0.001) (online supplemental table 13).
Prevalence of rapid decline in renal function (in terms of absolute decline and % decline) among all patients with diabetes mellitus, type 1 diabetes mellitus, type 2 diabetes mellitus and other diabetes mellitus
Variables associated with per cent rate of change of eGFR
Multiple regression analyses were performed for the total cohort (table 2) and separately for those with T1DM and T2DM (online supplemental table 14A,B) to determine which indices were independently associated with percentage rate of change of eGFR. In the final stepwise regression model (model 4), higher values for log-normalized (LN)uACR (p<0.001), ALP (p=0.001), TSH (p=0.006), age (p<0.001), number of antihypertensive agents (p<0.001), variability in SBP (p=0.043) and variability in (LN)uACR (p=0.001), and lower values for HbA1c (p=0.003), ALT (p=0.0036), HDL-C (p<0.001) and DBP (p<0.001) and not being on an ACE inhibitor/angiotensin receptor blocker (ACEi/ARB) (p=0.002) were associated with more rapid decline in renal function.
Multiple linear regression model with rate of change of eGFR (% change in eGFR per year) as a response variable for all DM
Binary logistic regression models were applied to the total cohort to determine which indices were independently associated with rapid decliner status (−3.3% decline in eGFR per year) (table 3). In the final model (model 4; table 3), higher total cholesterol (p=0.003), free T4 (p=0.012), TSH (p=0.016), age (p<0.001), number of antihypertensives (p<0.001), variability in HbA1c (p=0.006) and variability in (LN)uACR (p<0.001), and lower baseline eGFR (p<0.001), ALT (p=0.002), HDL-C (p<0.001) and DBP (p<0.001) increased the odds of being classified as a rapid decliner.
Binary logistic regression models with decliner (%) and uACR >3 mg/mmol as response variables for all DM
Variables associated with the presence of albuminuria (uACR >3mg/mmol)
A binary logistic regression model was used to identify factors associated with abnormal albuminuria (>3 mg/mmol) (table 3). Using stepwise regression (model 4), as HbA1c (p<0.001), ALP (p=0.002), total cholesterol (p=0.009), SBP (p<0.001), number of antihypertensives (p=0.017) and variability in SBP (p=0.009) increased and as per cent change per year in eGFR (p<0.001), baseline eGFR (p<0.001) and TSH (p=0.042) decreased, the odds of having an uACR >3 mg/mmol increased. Men (p<0.001) and those on ACEi/ARB (p=0.009) were more likely to have uACR >3 mg/mmol than women or those not on ACEi/ARB.
Discussion
In our study, 42% of adults attending a hospital-based diabetes clinic in the West of Ireland had DKD. Based on the KDIGO 2012 subclassification, a greater proportion of those with T2DM as opposed to those with T1DM had CKD associated with moderate to very high risk of adverse outcomes. There are limited published data on the prevalence of DKD in Ireland/Northern Europe. Comparisons between published studies are problematic as the prevalence of DKD is dependent on the sample from which the prevalence data were derived and on how DKD is defined. Patients with DM are at higher absolute risk of ESRD, all-cause and cardiovascular mortality than those who do not have DM across the different stages of kidney disease.27 The prevalence data reported in our study in conjunction with the known adverse outcomes of DKD highlight the public health importance and need to optimize DKD prevention/treatment strategies.
The prevalence of DKD in our cohort is at the upper end of that reported for European and American adults. In studies among comparably sized cohorts predominantly of patients with T2DM from the UK, Italy, Spain, France, Finland and the USA, the prevalence of DKD varied from 23% to 69%.5–7 28–31 When making comparisons, the nature and management characteristics of the cohorts studied must be taken into account (eg, primary vs secondary care). Even acknowledging the variable prevalence reported from diverse geographical regions, our study focuses attention on DKD as a frequent, often underappreciated complication of DM which is associated with an even greater burden of complications and adverse patient outcomes if not managed from an early stage. It should be noted that our results reflect the prevalence of DKD and adverse renal trajectories in a patient cohort with access to multidisciplinary specialist care. At our institution, a diabetes renal clinic was established to optimize care for patients at risk of progressive DKD. Patients attending this clinic are seen by both an endocrinologist and nephrologist. While to date our clinic has resulted in no change in the rate of absolute decline in renal function before and after attending the clinic for patients with T1DM, the rate of absolute decline has decreased for patients with T2DM or those with DM and additional CKD etiologies.32 The diabetes renal clinic improves care for patients with DKD, facilitates earlier interventions with targeted therapies such as sodium-glucose co-transporter 2 (SGLT2) inhibitors33 and glucagon-like peptide 1 (GLP-1) receptor agonists,34 and promotes access to new therapy trials.
In the total cohort, 28.5% and 14.3% were classified as ‘rapid decliners’ based on per cent and absolute rate of eGFR decline, respectively. The frequency of rapid decline was higher for T2DM than for T1DM. Consistent with results published in Japan35 and the USA,36 DKD itself was more common among patients with T2DM compared with T1DM. Although reported/known duration of DM appeared shorter in adults with T2DM, it has been well established that there is a substantial delay (>6 years) between onset and diagnosis.37 Irrespective of DM type, the severity of albuminuria increased and eGFR decreased as duration of DM increased. Patients with T2DM were older, and, as renal function declines with age,38 this may have contributed to the more advanced DKD observed in those patients. Predictably, greater albuminuria was associated with worse glycemic, BP and lipid parameters and higher BMI. As eGFR declined, SBP increased, suggesting that BP control in particular was suboptimal in advanced kidney disease—the subset at greatest risk of cardiovascular mortality.39 Poor SBP control in this context may be multifactorial and reflects difficulties in adequately controlling BP in progressive DKD, poor medication adherence and/or less stringent SBP targets in patients with comorbidities and/or advancing age. In patients with T1DM, HbA1c was above target in all KDIGO subcategories and, in patients with T2DM, was typically above target in the subgroups in whom albuminuria was greatest. The UK National Diabetes Audit also found that significant proportions of participants failed to meet glycemic (T1DM > T2DM) and BP targets.6 As shown in previous studies,26 more advanced DKD is associated with a lower HDL-C profile. The adverse metabolic phenotype associated with DKD highlights the need for more aggressive, targeted and personalized risk reduction strategies such as multidisciplinary diabetes renal clinics.32
There is ongoing debate regarding the most clinically relevant method of expressing rate of change in renal function. For example, the absolute annual loss of renal function will differ substantially for a patient with 10% eGFR decline per year if the starting eGFR is 90 mL/min/1.73 m2 compared with 30 mL/min/1.73 m2.40 Furthermore, rate of change itself is impacted by the number of eGFR values available and the period over which rate of change is calculated. Finally, there is no consensus regarding which rates of eGFR loss constitute rapid versus expected decline with age.17 In our study, we used linear mixed-effects models (incorporating random within-subject trajectories of eGFR over time) to provide a best estimate of rate of change. Despite these points of contention, knowledge of the rate of change in renal function is as important as current KDIGO classification in informing clinical management of DKD. For example, clinically significant increase in time to RRT can occur by reducing the rate of renal decline by 1 mL/min/1.73 m2/year.41 Rate of change in renal function is not readily available on most electronic patient data systems, hindering a physician’s ability to identify those currently undergoing rapid decline.
Our results indicate that decline in renal function or being classified as a decliner is associated with multiple known, potentially modifiable risk factors (uACR, total cholesterol, HDL-C, age, DBP). By identifying those with a current rapid rate in renal function decline, intensive targeted risk factor management strategies can be put in place. The higher proportions of adults classified as KDIGO G1/G2 that were defined as rapid decliners based on percentage compared with absolute eGFR change per year suggest that earlier referral to nephrology care and preferential clinical trial targeting of those with rapid proportionate decline may be important. Traditional hard renal endpoints for clinical trials such as time to ESRD/doubling of creatinine require large numbers of participants with a prolonged follow-up period to adequately power a study. Incorporating rate of decline in renal function into both inclusion criteria and outcome measures for clinical trials could lead to more effective studies.
Also of interest in our findings is the identification of less well-recognized risk associations for renal decline (variability in SBP/(LN)uACR/ALP/TSH). Variability in SBP was an independent determinant of renal function decline in patients with hypertension in a general cohort of Japanese participants without diabetes.42 43 Variability in 24-hour BP may be a marker of autonomic dysfunction or arterial stiffness.44 Many factors such as measurement error and adjusting medications (such as renin angiotensin aldosterone system blockade) can impact BP variability. Timing of and adherence to BP medications play a significant role. Reducing visit-to-visit variability in SBP may be a less well-recognized therapeutic intervention to slow the rate of decline in renal function.42 Greater variability in (LN)uACR reflects a greater change in uACR over the study period. While it may partly reflect progressively increasing albuminuria in those with more rapidly progressing DKD, its independent associations with rate of eGFR decline and rapid decliner status suggest that it merits further investigation as a clinical indicator of adherence to therapy or variances in DKD pathophysiology.
Our study shows that increasing ALP is associated with more rapid decline in renal function and the presence of albuminuria. ALP, an enzyme responsible for hydrolyzing pyrophosphate, is found in all body tissues, with high levels in the kidneys, bone and liver. Pyrophosphate is an important inhibitor of vascular calcification.45 Serum ALP is a marker of arterial stiffness.46 Increased arterial stiffness is associated with more rapid decline in renal function47; thus, increased ALP may act as a marker of progressive renal artery calcification. In patients with T2DM and proteinuria, renal artery calcification independently predicts onset of ESRD.48 Higher ALP is associated with an increased coronary artery calcification score in maintenance hemodialysis patients49—potentially a marker of cardiovascular risk. Higher average serum ALP levels for the 6 months prior to dialysis initiation are independently and incrementally associated with increased mortality (all-cause, cardiovascular, infection-related).50 In patients with biopsy-confirmed DKD and nephrotic-range proteinuria, elevated serum ALP levels are independently associated with poorer renal outcomes (ESRD or 50% decline in eGFR from baseline).51 In patients without diabetes with newly diagnosed untreated hypertension, ALP is associated with a reduction in eGFR, potentially mediated through low-grade inflammation, endothelial dysfunction, vascular calcification and modulation of BP.52 ALP may increase in response to low levels of active vitamin D that occur as renal function declines. Previous studies have shown that inhibition of tissue-non-specific ALP in a rat aortic calcification model resulted in reduced vascular calcification,53 indicating that ALP may be a novel therapeutic target to prevent renal function decline/vascular calcification. Also, of interest, opposite to ALP, we found that decreasing ALT was associated with more rapid decline in renal function. Previous studies have found low levels of ALT in CKD, with ALT decreasing as CKD progressed.54 The pathophysiology of the reduction in ALT is poorly understood, requiring further investigation, but a reduction in pyridoxal-5’-phosphate may be contributory.55
Our study found an association between increased TSH and decline in renal function. The effect of thyroid dysfunction on the kidney is multifactorial: change in water and electrolyte balance (especially sodium), alteration of the renin angiotensin aldosterone system, decreased renal blood flow and decreased eGFR.56 As eGFR declines, the prevalence of subclinical or clinical hypothyroidism increases.57 58 In 24 patients with 29 episodes of iatrogenic hypothyroidism, renal function was shown to improve following thyroid hormone replacement.59 In 113 patients with subclinical hypothyroidism and CKD, replacement with thyroid hormone reduced the rate of decline in renal function,60 suggesting that decline in renal function may be a consequence of decreasing TSH rather than vice versa. Conversely, it is postulated that CKD is a risk factor for thyroid dysfunction potentially mediated through iodine retention, metabolic acidosis, selenium deficiency and/or heavy urinary protein loss (thyroid hormone is primarily protein-bound) due to nephrotic syndrome.61 Patients with T1DM and a TSH of 2.5–4.4 mU/L,were 2.3 times more likely to have a glomerular filtration rate <60 mL/min compared with those with a TSH of 0.4–2.5 mU/L.62 While it has long been clear that patients with overt hypothyroidism require treatment and that patients with diabetes require regular thyroid function tests, a state of clinical equipoise exists regarding the target TSH for patients at risk of DKD progression. Larger clinical trials are needed to answer this relevant clinical question.
We acknowledge that this is a retrospective study with potential for reverse causation, particularly in regard to clinical variables associated with retrospective analyses of change in renal function. This study cannot definitively answer if the variables associated with decline in renal function are a consequence of or a risk factor for decline. During the study period, the patients served by our diabetes clinic were predominantly Caucasian (>98%), limiting the generalizability of our findings. The regression analyses presented in the main manuscript primarily focus on the total diabetes cohort (rather than the T1DM or T2DM cohort individually). Type of diabetes is included in these models as an explanatory variable and does not appear to impact on the response variables. Future subgroup analyses will provide more information on the differences that may exist between the T1DM and T2DM subgroups. Nonetheless, it is of interest that our reported DKD prevalence is not strikingly different from those observed at a population level in the USA and Asia, emphasizing that the high burden of CKD among adults with DM is a global phenomenon that by no means spares Northern European populations. Our results also highlight the utility of the KDIGO 2012 algorithm for identifying different clinical characteristics and management trends and for analyzing rates of renal functional loss among adults with T1DM and T2DM that span the clinical spectrum of DKD. While routinely used by nephrologists worldwide, the KDIGO framework is less commonly used by diabetologists and primary care physicians. Were it more extensively incorporated into clinical practice guidelines for DM care, it could serve to better unify DKD-related research across the different medical specialties. The DIAMOND database is a clinical database used in routine practice and, consequently, has the potential for errors. This is both a strength and a weakness of this study. The accuracy of the data is dependent not only on the clinician or healthcare practitioner inputting it, but also on the patient providing an accurate account of medications and adherence to prescribed medications. Further strengths of our study include the high average number of eGFR values (all measured at the same clinical laboratory) that contributed to the individual rate of decline calculations, as well as the direct comparison of absolute and per cent rates of decline. This is the largest study exploring the prevalence of DKD and its associated risk factors in Ireland. It provides valuable insights for clinicians and healthcare workers in this country and others (particularly in Northern Europe) into the burden of CKD among adults with DM and on how to tailor future care delivery strategies to further reduce progression from early to advanced DKD.
In conclusion, this study is one of the first to approach framing DKD burden according to the KDIGO system (especially in Northern Europe) and to examine clinical and laboratory associations with proportionate rate of change of eGFR using patient numbers and time frames that are comparable with or greater than those of similar studies. Our results suggest that the burden of DKD, the frequency of rapid decline and the high risk for adverse outcomes despite specialist-delivered diabetes care may be greater than has been appreciated to date in similar populations. In addition to well-established risk factors, rate of change in renal function was associated with serum ALP, TSH and variability in SBP and (LN)uACR.
Data availability statement
Data that support the findings of this study are available from the corresponding author upon reasonable request. All data relevant to the study are included in the article or uploaded as supplemental information.
Ethics statements
Ethics approval
The study was approved by the Research Ethics Committee at Galway University Hospitals (GUH) (Ref GUH: 1420).
Acknowledgments
We wish to express our gratitude to all volunteers and patients who made this study possible. Special thanks to the scientific, nursing and medical staff at the Centre for Endocrinology, Diabetes and Metabolism and the Department of Clinical Biochemistry, Saolta University Health Care Group (SUHCG), Galway University Hospitals.
References
Supplementary materials
Supplementary Data
This web only file has been produced by the BMJ Publishing Group from an electronic file supplied by the author(s) and has not been edited for content.
Footnotes
Contributors TPG: conception, design, data acquisition, assembly, statistical analyses and interpretation. PMOS: conception, design, quality and accuracy of laboratory methods, data acquisition, assembly, statistical analyses and interpretation. EOS, FMF, SFD, FPD, DWL, DNR, MB, TOB, MNI: data acquisition and assembly. AS, DW, JF: statistical analyses. DGG: quality and accuracy of laboratory methods, data acquisition, assembly and interpretation. MDG: conception, design, analyses and interpretation. TPG: first draft of the manuscript. All authors reviewed, edited and approved the final version of the manuscript.
Funding TPG is supported by a Hardiman Scholarship from the College of Medicine, Nursing and Health Science, National University of Ireland Galway and a bursary from the Irish Endocrine Society/Royal College of Physicians of Ireland. The authors are supported by grants from the European Commission (Horizon 2020 Collaborative Health Project NEPHSTROM, grant number 634086; TPG, MNI, TO'B, MDG), Science Foundation Ireland (REMEDI Strategic Research Cluster, grant number 09/SRC-B1794; TO'B, MDG), CÚRAM Research Centre (grant number 13/RC/2073_P2; TO'B, MDG), HRB, Ireland Grant (grant number: EIA 2017-017, JF) and the European Regional Development Fund. The materials presented and views expressed are the responsibility of the author(s) only. The EU Commission takes no responsibility for any use made of the information set out.
Competing interests None declared.
Provenance and peer review Not commissioned; externally peer reviewed.
Supplemental material This content has been supplied by the author(s). It has not been vetted by BMJ Publishing Group Limited (BMJ) and may not have been peer-reviewed. Any opinions or recommendations discussed are solely those of the author(s) and are not endorsed by BMJ. BMJ disclaims all liability and responsibility arising from any reliance placed on the content. Where the content includes any translated material, BMJ does not warrant the accuracy and reliability of the translations (including but not limited to local regulations, clinical guidelines, terminology, drug names and drug dosages), and is not responsible for any error and/or omissions arising from translation and adaptation or otherwise.