Article Text

Abstract
Introduction Saliva collection is a non-invasive test and is convenient. 1,5-anhydroglucitol (1,5-AG) is a new indicator reflecting short-term blood glucose levels. This study aimed to explore the relationship between saliva 1,5-AG and insulin secretion function and insulin sensitivity.
Research design and methods Adult patients with type 2 diabetes who were hospitalized were enrolled. Based on blood glucose and C-peptide, homeostasis model assessment 2 for β cell secretion function, C-peptidogenic index (CGI), △2-hour C-peptide (2hCP)/△2-hour postprandial glucose (2hPG), ratio of 0–30 min area under the curve for C-peptide and area under the curve for glucose (AUCCP30/AUCPG30), and AUC2hCP/AUC2hPG were calculated to evaluate insulin secretion function, while indicators such as homeostasis model assessment 2 for insulin resistance were used to assess insulin sensitivity.
Results We included 284 subjects (178 men and 106 women) with type 2 diabetes aged 20–70 years. The saliva 1,5-AG level was 0.133 (0.089–0.204) µg/mL. Spearman’s correlation analysis revealed a significantly negative correlation between saliva 1,5-AG and 0, 30, and 120 min blood glucose, glycated hemoglobin A1c, and glycated albumin (all p<0.05), and a significantly positive association between saliva 1,5-AG and CGI (r=0.171, p=0.004) and AUCCP30/AUCPG30 (r=0.174, p=0.003). The above correlations still existed after adjusting for age, sex, body mass index, and diabetes duration. In multiple linear regression, saliva 1,5-AG was an independent factor of CGI (standardized β=0.135, p=0.015) and AUCCP30/AUCPG30 (standardized β=0.110, p=0.020).
Conclusions Saliva 1,5-AG was related to CGI and AUCCP30/AUCPG30 in patients with type 2 diabetes.
Trial registration number ChiCTR-SOC-17011356.
- saliva
- diabetes mellitus
- type 2
- insulin secretion
Data availability statement
Data are available on reasonable request. The datasets generated during and/or analyzed during the current study are not publicly available but are available from the corresponding author on reasonable request.
This is an open access article distributed in accordance with the Creative Commons Attribution Non Commercial (CC BY-NC 4.0) license, which permits others to distribute, remix, adapt, build upon this work non-commercially, and license their derivative works on different terms, provided the original work is properly cited, appropriate credit is given, any changes made indicated, and the use is non-commercial. See: http://creativecommons.org/licenses/by-nc/4.0/.
Statistics from Altmetric.com
Significance of this study
What is already known about this subject?
Saliva has some advantages over blood in that it can barely coagulate and is easy to collect, transport, and store it for analysis. Several studies focused on identification of indicators in saliva and have highlighted the usefulness of saliva in clinical application, such as in diabetes.
1,5-anhydroglucitol (1,5-AG) is a suitable indicator for glucose monitoring, and our results demonstrated that saliva 1,5-AG is expected to be a promising, non-invasive, and convenient indicator for early screening of diabetes.
Our previous studies reported that serum 1,5-AG is associated with islet function, especially the early-phase insulin secretion.
What are the new findings?
The concentration of saliva 1,5-AG was 0.133 (0.089–0.204) µg/mL and was comparable in male and female patients with type 2 diabetes.
Spearman’s correlation analysis showed a positive association between saliva 1,5-AG and the early-phase insulin secretion indicator, that is, C-peptidogenic index (CGI) and ratio of 0-30 min area under the curve for C-peptide and area under the curve for glucose (AUCCP30/AUCPG30). Their correlation still existed after adjusting for age, sex, body mass index, and diabetes duration.
Saliva 1,5-AG was independent factor of both CGI and AUCCP30/AUCPG30.
How might these results change the focus of research or clinical practice?
Our study revealed that saliva 1,5-AG was related to CGI and AUCCP30/AUCPG30 in patients with type 2 diabetes. Saliva 1,5-AG may serve as a novel non-invasive parameter for reflecting early-phase insulin secretion function.
Introduction
Non-invasive diagnostic methods have attracted increasing attention concerning its applications. In addition to oral health, saliva can provide information on general health and seems to be a more appropriate sample source.1 Saliva has some advantages over blood in that it can barely coagulate and is easy to collect, transport, and store it for analysis.2 Several studies focused on identification of indicators in saliva and have highlighted the usefulness of saliva in clinical application, such as in diabetes. Dhanya et al3 reported that diabetes screening can be performed with saliva glucose because it has a good correlation with blood glucose. Zygula et al4 found that saliva could be considered a useful specimen for the estimation of oxidative stress levels in gestational diabetes mellitus.
1,5-anhydroglucitol (1,5-AG) has been introduced into the clinic as a new indicator reflecting the average blood glucose levels in the past 1–2 weeks.5 We found that 1,5-AG is a suitable indicator for glucose monitoring because 1,5-AG is stable in vivo, with no de novo synthesis, and is rarely metabolized.6 Moreover, 1,5-AG showed good stability and can be tested when the individual is in a non-fasting state.7 In addition, serum 1,5-AG has an advantage in that it reflects postprandial hyperglycemia and glucose fluctuations and can be used for early screening of diabetes and early identification of fulminant type 1 diabetes.8 9 Recently, we established a mass spectrometry platform for saliva 1,5-AG measurement. Saliva 1,5-AG was quantified with liquid chromatography-mass spectrometry (LC-MS). Consistent with the findings reported in the study published by Mook-Kanamori et al,10 saliva 1,5-AG was positively correlated to serum 1,5-AG and negatively correlated to 2-hour postprandial glucose (2hPG), glycated hemoglobin A1c (HbA1c), and glycated albumin (GA). Our results also demonstrated that saliva 1,5-AG is expected to be a promising, non-invasive, and convenient indicator for early screening of diabetes.11
Defective β cell secretion function and decreased insulin sensitivity (ie, insulin resistance) are considered the basic pathophysiological features of diabetes. Our previous studies, for the first time, reported that serum 1,5-AG is associated with early-phase insulin secretion in both normal glucose tolerance individuals and patients with newly diagnosed type 2 diabetes.12 13 However, thus far, there are no studies reporting whether saliva 1,5-AG is related to pancreatic islet secretion function and insulin sensitivity. Therefore, the present study aimed to explore the relationship between saliva 1,5-AG and parameters of β cell secretion function and insulin sensitivity.
Materials and methods
Study population
Adult patients with type 2 diabetes who were hospitalized in the Department of Endocrinology and Metabolism, Shanghai Jiao Tong University Affiliated Sixth People’s Hospital, between October 2018 and November 2019, were included in this study. Patients who used medications that may affect 1,5-AG levels, such as some traditional Chinese medicines (ie, Yuanzhi and Meiyuanzhi), α-glycosidase inhibitors, and sodium-dependent glucose transporters 2 inhibitors, were excluded. Individuals with severe hepatic dysfunction, renal dysfunction, acute infection, pregnancy, malignant tumor, mental disorders, cystic fibrosis, and current use of replacement therapy with glucocorticoids or sex hormones were also excluded. Finally, a total of 284 participants were enrolled in the current study.
The trial has been registered on the Chinese Clinical Trial Registry (www.chictr.org.cn), with its registration No. ChiCTR-SOC-17011356.
Assessment of covariates
Physical examination was performed among individuals to measure height, body weight, and blood pressure. Moreover, relevant medical history/basic information, history, family history, and other relevant data were extracted from patients’ medical records. Body mass index (BMI) was calculated as body weight (kg)/height (m2). Fasting blood samples were collected after a 10-hour overnight fasting (the next morning after hospitalization) to determine the levels of fasting plasma glucose (FPG), fasting C-peptide (FCP), HbA1c, GA, serum creatinine, and the lipid profiles, especially, triglycerides, total cholesterol, low-density lipoprotein cholesterol (LDL-C), and high-density lipoprotein cholesterol (HDL-C). Each subject then underwent a mixed meal test (with 100 g steamed bread, one egg (~50 g) and a cup of milk (~200 mL)). Postprandial blood samples were collected to measure the levels of 30 min glucose (PG30) and C-peptide (CP30), as well as 2hPG, △2-hour C-peptide (2hCP), and serum 1,5-AG.
Serum 1,5-AG levels were measured by the enzymatic method (GlycoMark; GlycoMark, New York, New York, USA), with interassay and intra-assay coefficients of variation of <3.5% and <2.5%, respectively. All other laboratory parameters were measured with standard methods.11 Estimated glomerular filtration rate (eGFR) was calculated using the CKD-EPI formula.14
Insulin secretion function and insulin sensitivity evaluation
Basal insulin secretion function and insulin sensitivity were evaluated using homeostatic model analysis and quantitative insulin sensitivity check index (QUICKI), respectively. HOMA Calculator V.2.2.3 released by the University of Oxford was used for homeostasis model assessment 2 for insulin resistance (HOMA2-IR) and homeostasis model assessment 2 for β cell function (HOMA2-%β) estimation based on FPG and FCP levels.15
Postprandial insulin secretion function was assessed based on the following indexes, including the C-peptidogenic index (CGI), △2hCP/△2hPG, ratio of 0–30 min AUC for C-peptide and AUC for glucose (AUCCP30/AUCPG30), and AUC2hCP/AUC2hPG. According to related studies, CGI = (CP30–FCP (in ng/mL))/(PG30–FPG (in mmol/L)),16 △2hCP/△2hPG = (2hCP–FCP (in ng/mL))/(2hPG–FPG (in mmol/L)). The AUCs between 0 and 30 min and between 0 and 2-hour AUCs of C-peptide and glucose were calculated using the triangle formula and irregular trapezoidal formula, respectively.
Postprandial insulin sensitivity was evaluated using the Cederholm formula17 and presented as insulin sensitivity index (ISI)=M/(MG×lgMCP), where M=75 000/120 + (FPG – 2hPG)×180×0.19×body wt/120, MG and lgMCP is the mean values of FPG and 2hPG, and the log mean of FCP and 2hCP, respectively.
Saliva sample collection and LC-MS measurement
Saliva was collected from each participant at the same time when 2-hour postprandial blood samples were collected. A Salivette saliva collection tube (Sarstedt, Nümbrecht, Germany) was used to collect saliva by gently chewing the matched cotton swabs. The saliva samples were centrifuged for further analysis. Saliva 1,5-AG was estimated using LC-MS, with the same method as that established by our group previously.11 1,5-AG standard (purity 99%) was purchased from Wako, Osaka, Japan. The internal standard (IS) 13C-labeled 1,5-AG (purity 98%) was purchased from Omicron Biochemical. High-performance liquid chromatography grade acetonitrile, methanol, and water were purchased from Sigma-Aldrich (USA). An aliquot of 90 µL saliva was mixed with 250 µL acetonitrile:methanol (8:2), which contains 50 nmol/L IS. After vortexing and centrifuging, the supernatant was collected into a tube for LC-MS analysis.
The reproducibility and basic characteristics (including measurement range) of saliva 1,5-AG measurement by LC-MS were described in detail as previously reported.11 Briefly, The limit of saliva 1,5-AG detection by LC-MS was about 0.2 ng/mL (signal to noise >3) and the lower limit of quantification was 2 ng/mL (signal to noise >10). Over the range of 0.01‒60 µg/mL for saliva 1,5-AG, excellent linearity was observed with a r2 >0.99. The relative SDs of intrarun precision for 1,5-AG standards and 1,5-AG in pooled saliva were <2% and 4.7%, respectively.
Statistical analysis
All relevant data were analyzed using SPSS V.24.0 (SPSS, Chicago, Illinois, USA). Normally distributed variables, non-normally distributed variables, and categorical variables were expressed as mean±SD, median with IQR, and frequency (percentage), respectively. Independent samples t test, Wilcoxon rank-sum test, or χ2 test was used for intergroup analysis of normally distributed variables, non-normally distributed variables, or categorical variables, respectively. The general characteristics according to the tertiles of saliva/serum 1,5-AG were determined using the Kruskal-Wallis test. The relationships between saliva/serum 1,5-AG and related parameters including glucose levels, CGI, HOMA2-IR, and HOMA2-%β were analyzed using Spearman’s correlation analysis, while multiple linear regression was used to determine independent factors that influence saliva/serum 1,5-AG. Saliva/serum 1,5-AG and related indicators such as CGI and AUCCP30/AUCPG30 were standardized before performing the analysis (standardized to a mean of 0 and SD of 1 based on the study sample distribution). Bilateral p<0.05 was considered statistically significant.
Results
Clinical characteristics of the study individuals
We enrolled a total of 284 individuals aged 20–70 years (60 (52–65) years) including 178 men and 106 women, with a BMI of 24.9±2.9 kg/m2, and diabetes duration of 11 (5–16) years. Their saliva 1,5-AG, serum 1,5-AG, HbA1c, and GA levels were 0.133 (0.089–0.204) µg/mL, 3.25 (1.60–6.60) µg/mL, 8.4% (7.3%–9.8%), and 20.8% (17.4%–25.4%), respectively (table 1). Compared with male patients, female patients were older and exhibited significantly lower diastolic blood pressure and serum creatinine levels (all p<0.05) and significantly higher serum 1,5-AG, eGFR and HDL-C levels (both p<0.05). Additionally, diabetes duration, BMI, systolic blood pressure, HbA1c, GA, FPG, PG30, 2hPG, saliva 1,5-AG, FCP, CP30, 2hCP, total cholesterol, triglycerides, LDL-C, and hypoglycemic therapy were comparable between male and female patients (all p>0.05). More details of hypoglycemic treatment regimens before and after hospitalization were depicted in online supplemental tables 1 and 2.
Supplemental material
Clinical characteristics of the study participants
The individuals were further divided into three groups according to saliva 1,5-AG trisection (T1: <0.100 µg/mL; T2: 0.100–0.171 µg/mL; T3: ≥0.172 µg/mL), as well as the serum 1,5-AG trisection (T1: <2.00 µg/mL; T2: 2.00–5.09 µg/mL; T3: ≥5.10 µg/mL). As shown in figure 1A (a-f), HOMA2-%β, HOMA2-IR, CGI, △2hCP/△2hPG, AUCCP30/AUCPG30, and AUC2hCP/AUC2hPG increased gradually with increment of saliva 1,5-AG (all p for trend <0.05). Similar positive association between all above parameters and serum 1,5-AG were also observed (all p for trend <0.05; figure 1B (a-f)), while there was no correlation between QUICKI and ISI with both saliva (p for trend=0.095 and 0.446) and serum 1,5-AG (p for trend=0.229 and 996).
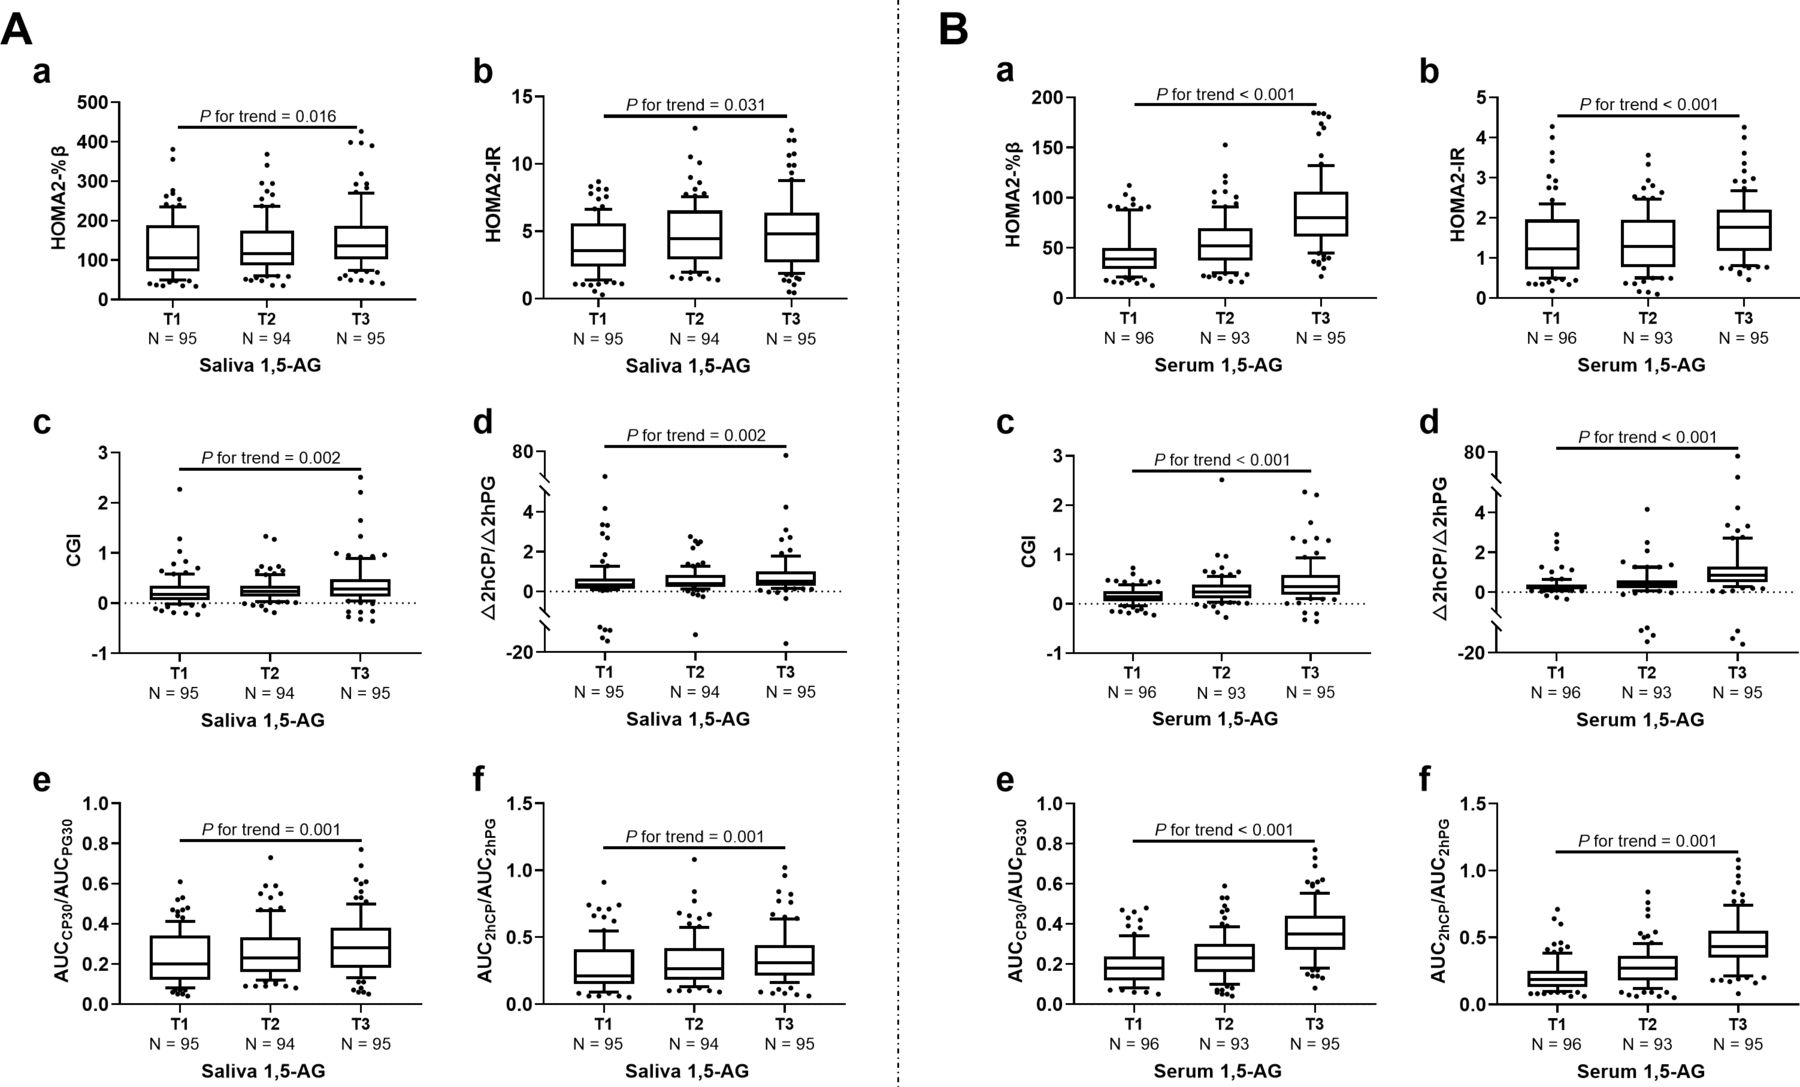
Association of (A) saliva/ (B) serum 1,5-AG trisection with insulin secretion function and sensitivity-related indexes. T1, T2, and T3 were saliva 1,5-AG<0.100 µg/mL, 0.100–0.171 µg/mL, and ≥0.172 µg/mL, respectively; T1, T2, and T3 were serum 1,5-AG<2.00 µg/mL, 2.00–5.09 µg/mL, and ≥5.10 µg/mL, respectively. 1,5-AG, 1,5-anhydroglucitol; AUC, area under the curve; CGI, C-peptidogenic index; 2hCP, 2-hour C-peptide; HOMA2-%β, homeostasis model assessment 2 for β cell function; HOMA2-IR, homeostasis model assessment 2 for insulin resistance; 2hPG, 2-hour postload glucose.
Associations of saliva/serum 1,5-AG with parameters of insulin secretion function and sensitivity
Spearman’s correlation analysis showed a significant positive correlation between saliva 1,5-AG and serum 1,5-AG (r=0.285, p<0.001). Moreover, saliva 1,5-AG was negatively associated with glycemic indexes such as HbA1c, GA, and 2hPG (all p<0.05); positively associated with HOMA2-%β, CGI, △2hCP/△2hPG, AUCCP30/AUCPG30, and AUC2hCP/AUC2hPG (all p<0.05); and not associated with HOMA2-IR, QUICKI, and ISI (all p>0.05). The correlation between saliva 1,5-AG and blood glucose indicators, serum 1,5-AG, CGI, and AUCCP30/AUCPG30 still existed after adjusting for age, sex, BMI, and diabetes duration (table 2).
Correlation analysis of saliva 1,5-AG with serum 1,5-AG, glycemic, insulin sensitivity and secretion indicators
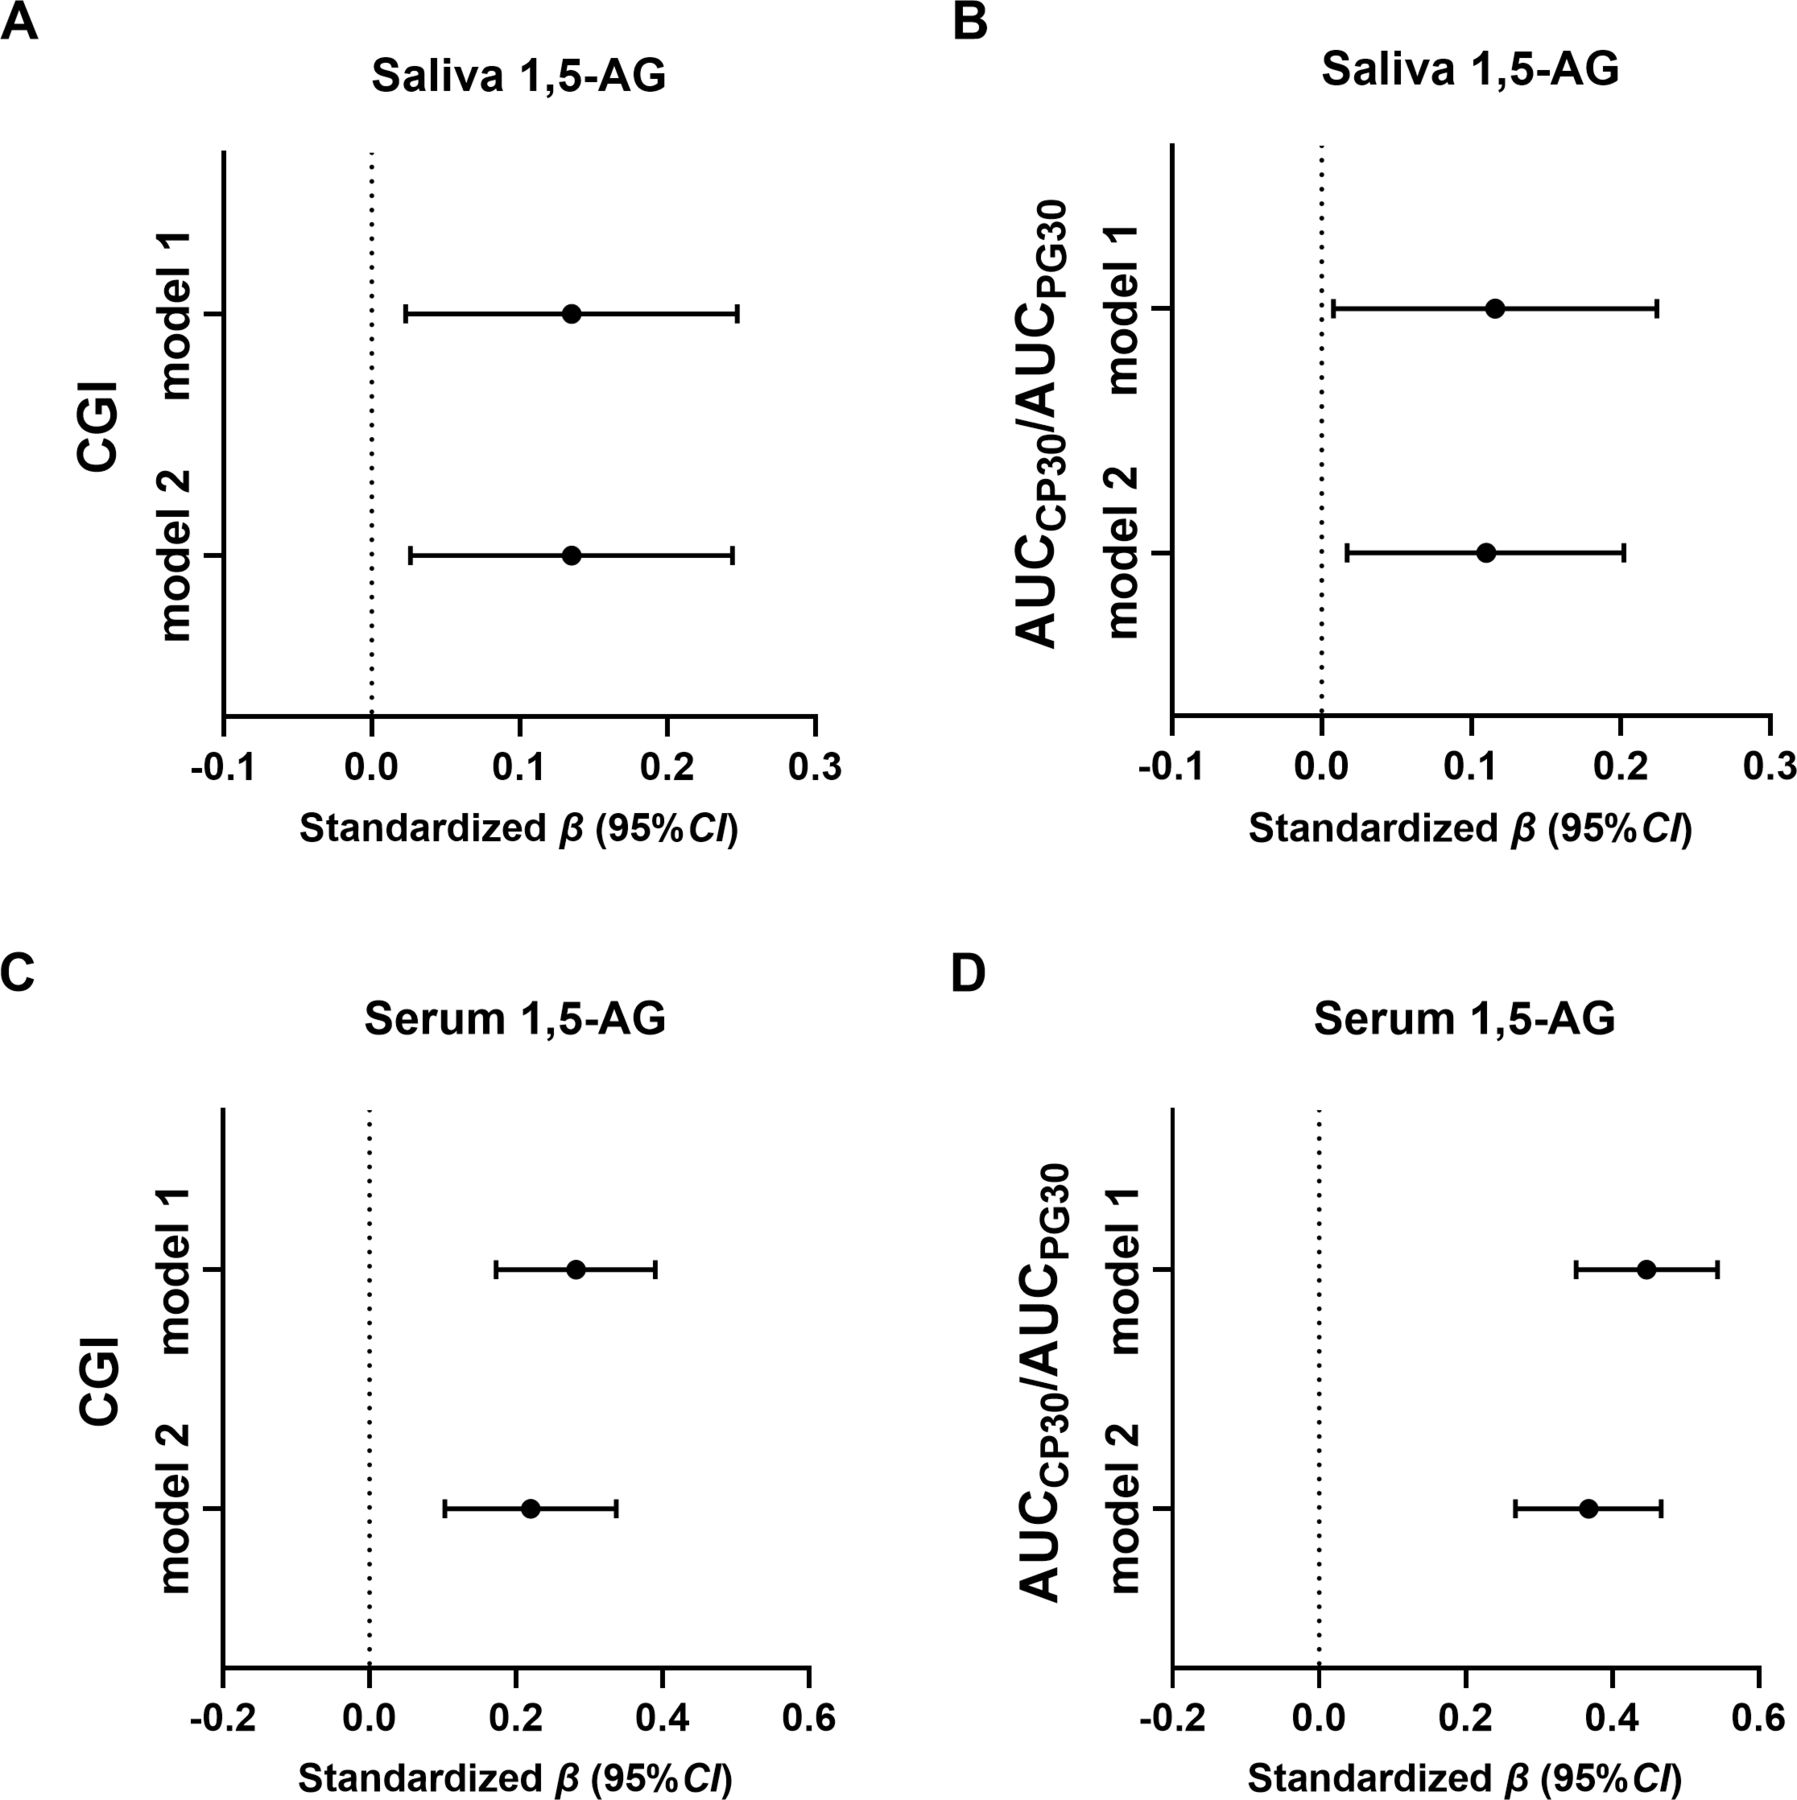
CGI and AUCCP30/AUCPG30 were defined as the dependent variables of multiple stepwise regression analysis, respectively. Then, two models were established to identify their independent influencing factors. Model 1 defined sex, age, BMI, blood pressure, diabetes duration, and saliva 1,5-AG as independent variables and revealed independent relationships between saliva 1,5-AG and CGI and AUCCP30/AUCPG30 (standardized β=0.135 and 0.116, p=0.019 and 0.035; figure 2). Model 2 further included eGFR, insulin treatment, and oral antidiabetic drugs as the independent variables based on Model 1. Both independent relationships of saliva 1,5-AG and CGI, as well as saliva 1,5-AG and AUCCP30/AUCPG30 (standardized β=0.135 and 0.110, p=0.015 and 0.020; figure 2A,B) remained significant.

Adjusted associations of standardized CGI and AUCCP30/AUCPG30 with (A,B) saliva/(C,D) serum 1,5-AG. Note: The results were obtained from linear regression analyses and expressed as the standardized β value for each insulin secretion function and sensitivity-related indicators (with 95% CI) per SD of saliva 1,5-AG. Adjustment was made for the factors in Model 1: age, sex, blood pressure, BMI, and diabetes duration; Model 2: age, sex, blood pressure, BMI, diabetes duration, eGFR, insulin therapy, and oral antidiabetic drugs. 1,5-AG, 1,5-anhydroglucitol; AUC, area under the curve; AUCCP30/AUCPG30, ratio of 0–30 min area under the curve for C-peptide and area under the curve for glucose; BMI, body mass index; CGI, C-peptidogenic index; eGFR, estimated glomerular filtration rate.
When replace saliva 1,5-AG with serum 1,5-AG, we also observed independent relationships between serum 1,5-AG and CGI, as well as AUCCP30/AUCPG30 in fully adjusted model (standardized β=0.217 and 0.311, p=0.001 and <0.001; figure 2C,D).
In addition, we then replaced oral antidiabetic drugs with each categories of hypoglycemic agents before and after admission, that is, metformin, sulfonylureas, thiazolidinediones, glinides, dipeptidyl peptidase-4 inhibitors and glucagon-like peptide-1 receptor agonist. Consistent with the results above, the corresponding multivariable-adjusted linear regression analysis also found an independently positive association between saliva/serum 1,5-AG and CGI, as well as saliva/serum 1,5-AG and AUCCP30/AUCPG30 (online supplemental table 3).
Discussion
This study, for the first time, explored the relationship between saliva 1,5-AG and parameters of β cell secretion function and insulin sensitivity. Our results demonstrated the positive independent association between saliva 1,5-AG and early-phase insulin secretion. Moreover, we confirmed that saliva 1,5-AG was significantly positively correlated with serum 1,5-AG and negatively correlated with blood glucose indicators.
Impairment in β cell secretion function, which includes alterations in the dynamics of insulin release, is the essential characteristic feature of type 2 diabetes mellitus.18 In the early phase, insulin release is reduced in response to glucose load in patients with type 2 diabetes when compared with that in healthy subjects.18–20 Early-phase insulin secretion is of significant importance for maintaining glucose homeostasis, especially postprandial glucose homeostasis.21 22 Therefore, a better understanding of the early-phase insulin secretion is helpful for carrying out individualized therapy to achieve a better glucose control. However, the existing indicators for evaluating insulin secretion function are all oriented from results based on blood samples, warranting further calculation, which affects the compliance to a certain extent. Unlike blood samples, collection of saliva presents several advantageous features, most importantly, as a non-invasive and convenient approach. We have established the platform for saliva 1,5-AG determination using the golden standard LC-MS method and explored the application of saliva 1,5-AG in diabetes.
Saliva 1,5-AG is determined using the “golden standard,” that is, mass spectrometry. Moreover, parameters related to insulin secretion function and insulin sensitivity were calculated depending on C-peptide since 70.4% of the subjects enrolled were treated with insulin. Consistent with our previous studies focusing on serum 1,5-AG,12 13 we found an upward trend in all the postprandial insulin secretion function indicators (CGI, △2hCP/△2hPG, AUCCP30/AUCPG30, and AUC2hCP/AUC2hPG) with both increasing saliva 1,5-AG trisection and serum 1,5-AG trisection. After adjusting for related factors, saliva 1,5-AG was correlated only with the early-phase insulin secretion indicators CGI and AUCCP30/AUCPG30 and was considered independent factors of these indicators. The hyperglycemic clamp is the golden standard for assessing insulin secretion function. There are related published studies focusing on the relationship between CGI, AUCCP30/AUCPG30, and parameters derived from the hyperglycemic clamp. The results confirmed that both CGI and AUCCP30/AUCPG30 were acceptable indexes for reflecting the early-phase insulin secretion,23 24 which makes saliva 1,5-AG a potential suitable indicator for reflecting early-phase insulin secretion.
In previous studies, we also found that both HOMA-IR and HOMA-%β were independent factors for serum 1,5-AG.12 However, in the present study, we found only a positive correlation between HOMA2-%β and saliva 1,5-AG, but not between HOMA2-IR and saliva 1,5-AG. Moreover, both HOMA2-IR and HOMA2-%β were not independently associated with saliva 1,5-AG. In previous studies, the enrolled participants were patients with newly diagnosed type 2 diabetes, while the individuals included in the present study were patients with type 2 diabetes with a median diabetes duration of 11 years, and quite a large part of them were treated with insulin. Therefore, resulted in the discrepancy that HOMA2-%β and CGI, rather than HOMA2-IR were closely related to saliva 1,5-AG.
In addition, in accordance with our previous studies on both serum and saliva 1,5-AG,8 11 we confirmed a negative association between saliva 1,5-AG and blood glucose indicators including FPG, 2hPG, HbA1c, and GA. 1,5-AG is structurally similar to glucose. Generally, 1,5-AG can be almost fully reabsorbed by renal tubules (with a reabsorption ratio of approximately 99.9%). However, when glucose increases exceeding the renal glucose threshold, the reabsorption of 1,5-AG is competitively inhibited by glucose, resulting in an increase in urinary 1,5-AG excretion, manifesting as hyperglycemia-related serum 1,5-AG decline.25 Subsequently, the 1,5-AG present in the tissue is transported through the serum according to the concentration gradient, resulting in a decrease in the saliva 1,5-AG levels and indicating that saliva 1,5-AG is a potential parameter for glucose monitoring.
In this study, saliva 1,5-AG were accurately determined using the LC-MS method to provide a solid basis for further application of saliva 1,5-AG. However, the limitations of the study include the relatively small sample size as well as the accurate but time-consuming and costly LC-MS method. Therefore, further studies with a large number of participants are needed. Moreover, ongoing studies focus on the development of a more convenient and cheaper method for saliva 1,5-AG measurement. In addition, the enrolled subjects were patients with type 2 diabetes with relatively long duration who were not suitable for washout.
In conclusion, our study revealed that saliva 1,5-AG was related to CGI and AUCCP30/AUCPG30 in patients with type 2 diabetes. Saliva 1,5-AG may serve as a novel non-invasive parameter for reflecting early-phase insulin secretion function.
Data availability statement
Data are available on reasonable request. The datasets generated during and/or analyzed during the current study are not publicly available but are available from the corresponding author on reasonable request.
Ethics statements
Ethics approval
This study was approved by the Ethics Committee of Shanghai Jiao Tong University Affiliated Sixth People’s Hospital (Approval No. 2017–051). Each participant signed the informed consent for participation in this study.
Acknowledgments
We would like to thank all of the involved technicians for dedicating their time and skill towards completion of this study.
References
Supplementary materials
Supplementary Data
This web only file has been produced by the BMJ Publishing Group from an electronic file supplied by the author(s) and has not been edited for content.
Footnotes
LY and CJ contributed equally.
Contributors XM and YB designed the study. CJ enrolled the participants and collected the saliva samples. LY and CJ collected the data. LY performed the statistical analysis and wrote the paper. WZ, KG, YW, AZ, and WJ helped in saliva pretreatment and performed the LC-MS measurement of 1,5-AG. XM, JZ, and YB revised the paper and contributed to discussion. LY and CJ had equal contribution to this paper and were the guarantors.
Funding This work was supported by the Shanghai United Developing Technology Project of Municipal Hospitals (grant number SHDC12016108) and the Shanghai Municipal Education Commission—Gaofeng Clinical Medicine Grant Support (grant number 20161430).
Competing interests None declared.
Provenance and peer review Not commissioned; externally peer reviewed.
Supplemental material This content has been supplied by the author(s). It has not been vetted by BMJ Publishing Group Limited (BMJ) and may not have been peer-reviewed. Any opinions or recommendations discussed are solely those of the author(s) and are not endorsed by BMJ. BMJ disclaims all liability and responsibility arising from any reliance placed on the content. Where the content includes any translated material, BMJ does not warrant the accuracy and reliability of the translations (including but not limited to local regulations, clinical guidelines, terminology, drug names and drug dosages), and is not responsible for any error and/or omissions arising from translation and adaptation or otherwise.