Article Text

Abstract
Introduction To evaluate the effects of efpeglenatide, a long-acting glucagon-like peptide-1 receptor agonist (GLP-1 RA), on gastric emptying, glucose metabolism, and islet beta-cell function versus liraglutide and placebo in people with type 2 diabetes.
Research design and methods This phase Ib study (ClinicalTrials.gov identifier: NCT02059564) randomized participants (n=47) to three cohorts. Within the first two cohorts, participants were randomized to placebo, efpeglenatide 6 mg weekly (QW; first cohort), or efpeglenatide 16 mg monthly (QM; second cohort). The third cohort received liraglutide 1.8 mg daily (QD). Gastric emptying was assessed through the pharmacokinetic (PK) profile of acetaminophen at baseline and steady state. Glucose metabolism and beta-cell function were assessed based on mixed-meal tolerance testing and a graded glucose infusion procedure.
Results Treatment duration was approximately 3 months for efpeglenatide 16 mg QM and 1 month for efpeglenatide 6 mg QW and liraglutide. At peak drug concentrations, efpeglenatide 6 mg QW was non-inferior to liraglutide 1.8 mg QD in delaying gastric emptying, as assessed by acetaminophen PK (lower bound of 90% CI for the efpeglenatide:liraglutide ratio >0.8 for area under the curve (AUC)0–120, AUC0–180, AUC0–360 and maximum concentration (Cmax)). Efpeglenatide 16 mg QM did not decrease the rate of gastric emptying to as great an extent as liraglutide (ie, non-inferiority was not shown). Compared with liraglutide, both efpeglenatide dosing regimens demonstrated comparable or more favorable glucometabolic effects and improved beta-cell function. All gastrointestinal adverse events reported with efpeglenatide were mild or moderate in severity and transient over treatment and follow-up.
Conclusions The glucometabolic effects of efpeglenatide 6 mg QW and 16 mg QM were comparable to liraglutide. Additional studies are necessary to further examine these benefits of efpeglenatide.
Trial registration number NCT02059564.
- diabetes mellitus
- type 2
- gastric emptying
- glucagon-like peptide 1
- blood glucose
Data availability statement
The datasets generated during and/or analysed during the current study are available from the corresponding author on reasonable request.
This is an open access article distributed in accordance with the Creative Commons Attribution Non Commercial (CC BY-NC 4.0) license, which permits others to distribute, remix, adapt, build upon this work non-commercially, and license their derivative works on different terms, provided the original work is properly cited, appropriate credit is given, any changes made indicated, and the use is non-commercial. See: http://creativecommons.org/licenses/by-nc/4.0/.
Statistics from Altmetric.com
Significance of this study
What is already known about this subject?
Glucagon-like peptide-1 receptor agonists (GLP-1 RAs) are an established treatment option for improving glycemic control in people with type 2 diabetes (T2D).
Delayed gastric emptying is observed throughout the GLP-1 RA class, with greater effects observed with short-acting agents than with long-acting agents.
What are the new findings?
In this evaluation of the effects of efpeglenatide 6 mg weekly (QW) and 16 mg monthly (QM) doses on gastric emptying versus those of liraglutide 1.8 mg daily (QD), efpeglenatide 6 mg QW was non-inferior to liraglutide QD in delaying gastric emptying at peak drug concentrations based on acetaminophen pharmacokinetics.
Efpeglenatide 16 mg QM did not decrease the rate of gastric emptying to as great an extent as liraglutide.
Both efpeglenatide dosing regimens demonstrated comparable glucometabolic effects and improved beta-cell function compared with liraglutide.
How might these results change the focus of research or clinical practice?
Longer-term studies of efpeglenatide in larger populations are needed to examine the implications of these findings in clinical practice.
Introduction
Glucagon-like peptide-1 receptor agonists (GLP-1 RAs) are an established treatment option for improving glycemic control in people with type 2 diabetes (T2D).1 2 GLP-1 RAs differ in their duration of action, frequency of administration and clinical profile.2 3 Dosing frequencies of GLP-1 RAs range from twice daily to once weekly (QW).2 3 A less-frequent dosing regimen reduces injection burden and may, therefore, improve treatment adherence.2 Some studies have also reported that treatment with GLP-1 RAs may have additional benefits including a decreased risk of cardiovascular events.2–4
Delayed gastric emptying is observed throughout the GLP-1 RA class, with greater effects observed with short-acting agents than with long-acting agents.5 6 This difference may be due to greater activation of the GLP-1 receptor, with long-acting agents promoting tachyphylaxis to the effects on gastric motility.5 GLP-1 RAs with an extended duration of action have also been associated with less nausea than short-acting agents.5 7 Although it has been hypothesized that this reduction in nausea is due to reduced effects on gastric motility,8 a direct association between gastric emptying and gastrointestinal (GI) adverse events (AEs) has not been demonstrated.6 9 One alternative suggestion is that the decreased nausea observed may be due to the lower peak concentrations achieved with long-acting agents.5
Efpeglenatide is a long-acting GLP-1 RA currently in development to improve glycemic control in people with T2D by subcutaneous QW administration. It is composed of a single amino acid–modified exendin conjugated to a fragment crystallizable (Fc) region of human immunoglobulin G4 (IgG4) via a 3.4 kDa mini-polyethylene glycol linker using long-acting peptide/protein (LAPS) technology.10–12 Conjugation of the human IgG Fc fragment using LAPS technology leads to an extended duration of action13 and may also contribute to the low immunogenicity seen with efpeglenatide.13 ,14 Efpeglenatide also has unique receptor properties that may explain the greater maximal GLP-1 receptor signaling and reduced desensitization seen with efpeglenatide versus other GLP-1 RAs following chronic exposure in biochemical and preclinical studies.15 16
Three phase II studies that examined efpeglenatide in both people with T2D13 14 and people with obesity without T2D17 found that efpeglenatide was associated with significant decreases in glycated hemoglobin (HbA1c) and body weight. With weekly dosing, efpeglenatide was generally well tolerated; the most common AEs were GI disorders, which is consistent with the safety profile of the GLP-1 RA class.
Liraglutide once daily (QD) was selected as a comparator for this study as it is a member of the same GLP-1 RA class, has been well characterized and is recognized as a clinically effective GLP-1 RA.18 In mouse models of diabetes and diet-induced obesity, efpeglenatide led to greater or comparable glycemic improvements and body weight loss compared with liraglutide or dulaglutide.16 The effect of efpeglenatide 4 mg QW in reducing HbA1c was non-inferior to that of liraglutide 1.8 mg QD in a phase II clinical trial in T2D.13
The primary objective of this phase Ib clinical trial was to evaluate the effects of efpeglenatide QW and once-monthly (QM) doses on gastric emptying compared with those of liraglutide QD. Secondary objectives included assessing the effects on glucose metabolism and islet beta-cell function, as well as evaluating safety and tolerability.
Materials and methods
This randomized, parallel-group, exploratory study (ClinicalTrials.gov identifier: NCT02059564) was conducted at a single center in the USA. The overall study design is described in online supplemental figure S1.
Supplemental material
Participants were men and women ≥18 and ≤70 years of age who had T2D treated with a stable dose of metformin for ≥3 months, alone or in combination with a sulfonylurea. To be eligible for inclusion, participants were required to have a fasting C-peptide ≥0.8 ng/mL, HbA1c between ≥6.5% and ≤10%, and body mass index (BMI) ≥18 kg/m2 and ≤45 kg/m2 at the screening visit. Before randomization, all participants underwent a 14-day washout period, during which all oral antidiabetic drugs were discontinued, with the exception of metformin.
Eligible participants were randomized to one of three cohorts:
Participants in cohort A were randomized 3:1 to receive efpeglenatide 6 mg QW or placebo, on days 1, 8, 15 and 22.
Participants in cohort B were randomized 3:1 to receive efpeglenatide 16 mg QM or placebo; the efpeglenatide dose was escalated from 4 mg on day 1 to 8 mg on day 15 and up to 16 mg on days 29, 57 and 85 (with placebo injections on the same study days).
Participants in cohort C received liraglutide QD on days 1–26. The liraglutide dose was escalated from 0.6 mg/day from days 1–8, to 1.2 mg/day from days 9–15, to 1.8 mg/day from day 16 until the end of the study.
All study treatments were administered by subcutaneous injection.
Participants in cohorts A and B were blinded with regard to treatment. However, those in cohort C received open-label liraglutide as a fully double-blinded study design was not feasible due to differences in the required dosing schedules of efpeglenatide and liraglutide.
Pharmacodynamic assessments
The effects of treatment on pharmacokinetic (PK) and pharmacodynamic (PD) parameters in cohorts A, B and C were evaluated at baseline and steady-state/peak concentrations; the effects in cohort B (efpeglenatide QM) were also evaluated at trough concentrations.
Gastric emptying
The effects of efpeglenatide on gastric emptying were assessed based on the PK profile of acetaminophen given as part of a mixed-meal tolerance test (MMTT) on day 2 of the in-house period. Participants fasted overnight for ≥10 hours before consuming a standardized breakfast, which contained 60% carbohydrates, 20% protein, 20% fat, and was approximately 480 kcal. The meal was consumed within 15 min, after which 1000 mg of liquid acetaminophen was administered orally. The PK profile of acetaminophen included measures of area under the curve (AUC) from 0 to 60 min (AUC0–60), 0 to 120 min (AUC0–120), 0 to 180 min (AUC0–180) and 0 to 360 min (AUC0–360) and maximum concentration (Cmax).
Glucose metabolism and hormone responses
Glucose metabolism was also assessed during the MMTT through fasting plasma glucose (FPG), postprandial plasma glucose (PPG), HbA1c, insulin response, C-peptide response and glucagon. Glucagon was measured using Mercodia Glucagon ELISA (Mercodia AB, Sweden).
Beta-cell function
Islet beta-cell function was assessed using a graded glucose infusion (GGI) test on day 3 of the in-house period. Participants fasted overnight before a variable-rate insulin infusion was started to maintain a venous plasma glucose level at 120±10 mg/dL. The insulin infusion was stopped 60 min before the GGI test, during which glucose was infused for a total of 2.5 hours at sequential rates of 2, 4, 6, 8 and 12 mg/kg/min. Each rate was maintained for a 30-minute infusion period. Blood samples were obtained 0, 10, 20 and 30 min into each infusion period to measure plasma glucose, insulin and C-peptide. Pre-hepatic insulin secretion rate (ISR) was calculated based on deconvolution of the peripheral C-peptide concentrations during the GGI.19 Change in beta-cell responsiveness was assessed by comparing the slopes of the change in insulin concentration against plasma glucose pretreatment and post-treatment with the study drug.
Safety assessments
Safety assessments included incidence and severity of AEs, assessment of injection site, physical examination, vital signs, 12-lead ECG and clinical laboratory abnormalities.
Statistical methods
The primary hypothesis was that efpeglenatide was non-inferior to liraglutide (ie, had no greater delay) on gastric emptying. Statistical non-inferiority was defined as the lower bound of the 90% CI for the ratio between efpeglenatide and liraglutide of >0.8. For clarity, when the criteria for non-inferiority were met, the text will state that the endpoint is not less for efpeglenatide.
Least squares (LS) means were calculated using log-transformed data, and LS mean ratios were calculated by exponential transformation of the mean differences for PK parameters, including AUC0–60, AUC0–120, AUC0–180 and AUC0–360, and Cmax. The associated 90% CI and one-sided p values were obtained by analysis of variance (ANOVA). ANOVA was used to compare efpeglenatide 6 mg QW at day 24, efpeglenatide 16 mg QM at day 89 and liraglutide 1.8 mg QD at day 23 (ie, when all three cohorts were at peak or steady-state drug concentration). Because cohort B was sampled at both peak and trough drug concentrations, a separate ANOVA was used to examine trough concentrations of efpeglenatide 16 mg QM (at day 82) versus efpeglenatide 6 mg QW and liraglutide 1.8 mg QD at peak or steady state (at days 24 and 23, respectively). For comparisons to placebo, the placebo groups from cohort A and cohort B were pooled. One-sided p values were generated for comparisons between efpeglenatide and liraglutide; two-sided p values were generated for comparisons between efpeglenatide and placebo. It should be noted that these studies were designed to be exploratory rather than to confirm statistical hypotheses; thus, all statistical analyses are exploratory.
The PD populations included all randomized participants who received ≥1 dose of study drug and had ≥1 post-dose PD assessment. PD populations were defined separately for the MMTT and GGI. The PK population included all randomized participants who received ≥1 dose of study drug and had ≥1 post-dose PK assessment. The safety population included all randomized participants who received ≥1 dose of study drug.
As this was an exploratory study, the sample size was empirically determined and is comparable to other studies of this nature.
Results
In total, 47 participants were enrolled and randomized to cohort A (n=17), cohort B (n=17) or cohort C (n=13). In both cohorts A and B, 13 participants were randomized to efpeglenatide and 4 were randomized to placebo (online supplemental figure S2). Across groups, mean age ranged from 50.1 to 56.8 years, weight ranged from 77.45 to 98.58 kg, and BMI ranged from 28.93 to 34.28 kg/m2 (table 1).
Baseline characteristics (safety population)
Pharmacodynamic assessments
Gastric emptying
Baseline differences in acetaminophen PK parameters were identified in cohort A prior to dosing. These differences were addressed by the use of baseline-adjusted PK parameters for analysis. Figure 1A shows baseline-adjusted acetaminophen concentrations over time.

(A) Baseline-adjusted acetaminophen concentrations over time (PK population). Data are LS geometric mean (calculated using SAS procedure GLM (general linear model)) adjusted for baseline concentration at the corresponding time point, separately by treatment. Blood acetaminophen concentrations were determined at –0.25, 0.25, 0.5, 0.75, 1, 1.5, 2, 2.5, 3, 3.5, 4, 5 and 6 hours after the meal. To account for the pre-study drug differences for PK/PD parameters, baseline-adjusted PK parameters were used; these are post hoc analyses. Acetaminophen (B) AUC0–180, (C) AUC0–360 and (D) Cmax at peak concentrations adjusted for baseline values (PK population). The placebo groups from cohort A and cohort B were pooled. AUC, area under the curve; Cmax, maximum concentration; LS, least squares; PD, pharmacodynamic; PK, pharmacokinetic; QM, once monthly; QW, once weekly.
Efpeglenatide 6 mg QW was non-inferior to liraglutide 1.8 mg QD in delaying gastric emptying as assessed by AUC0–120, AUC0–180, AUC0–360 and Cmax; these PK endpoints for plasma acetaminophen concentrations assessed at peak drug concentrations were not less for efpeglenatide compared with liraglutide (online supplemental table S1, figure 1B–D). Statistical non-inferiority was not demonstrated for efpeglenatide 16 mg QM versus liraglutide on any acetaminophen PK endpoint.
Compared with placebo, AUC0–60 for plasma acetaminophen concentration at peak drug concentrations was significantly lower for efpeglenatide 6 mg QW (p=0.0408), but did not differ significantly for the other plasma acetaminophen AUC endpoints calculated, or for Cmax. AUC0–60, AUC0–120, AUC0–180 and Cmax plasma acetaminophen PK endpoints were lower for efpeglenatide 16 mg QM versus placebo (p<0.05 for all) (online supplemental table S1). Compared with placebo, AUC0–60, AUC0–120, AUC0–180 and Cmax of plasma acetaminophen were lower for liraglutide (p<0.05 for all). There were no significant differences between any of the GLP-1 RA groups versus placebo for the AUC0–360 endpoint.
LS mean and LS mean ratios for acetaminophen AUC0–60, AUC0–180, AUC0–360 and Cmax at trough concentrations of efpeglenatide 16 mg QM versus placebo and liraglutide (at peak/steady-state concentrations) are shown in online supplemental table S2. The gastric emptying PK parameters associated with the trough concentration of efpeglenatide 16 mg QM were not less than those seen with liraglutide at peak/steady state (non-inferior).
Glucose metabolism and hormone responses
LS mean Cmax for FPG (figure 2A; online supplemental table S1) was significantly lower with efpeglenatide 6 mg QW (p=0.0002) and 16 mg QM (p<0.0001) compared with placebo. FPG Cmax was similar for efpeglenatide 6 mg QW versus liraglutide, but slightly lower for efpeglenatide 16 mg QM (p=0.049).
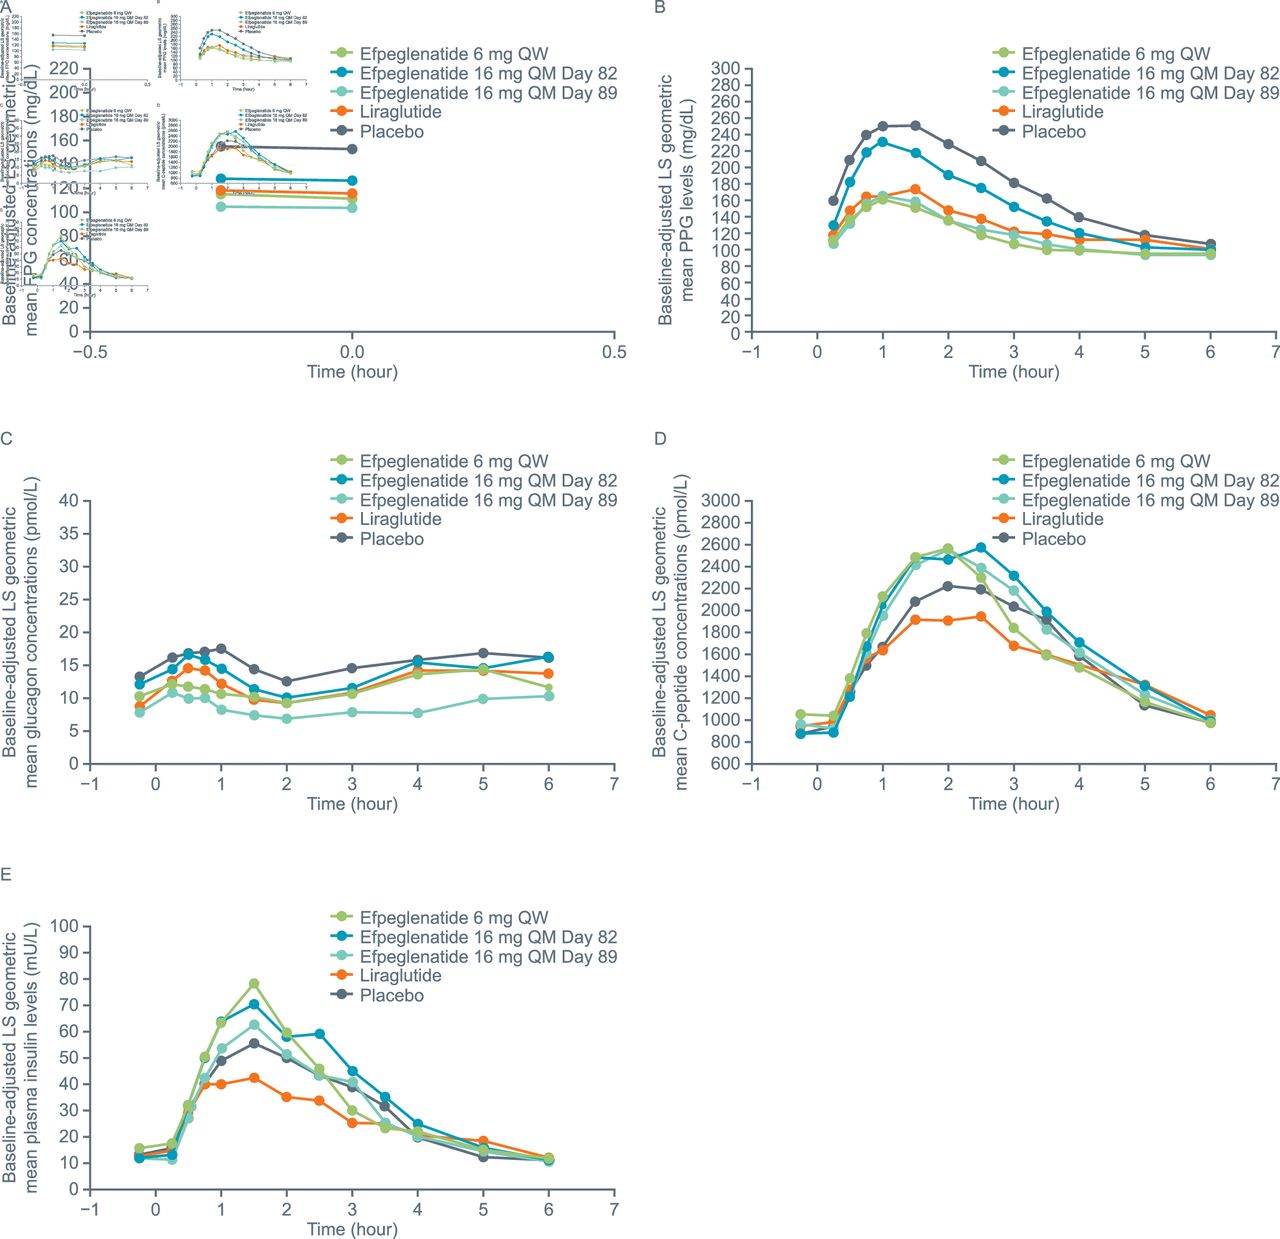
Post-MMTT (A) FPG concentrations, (B) PPG levels, (C) plasma glucagon concentrations, (D) C-peptide concentrations and (E) plasma insulin levels (PK population). Plasma glucose levels were measured at −0.25, 0, 0.25, 0.5, 0.75, 1, 1.5, 2, 2.5, 3, 3.5, 4, 5 and 6 hours after the meal. Insulin and C-peptide levels were measured at −0.25, 0.25, 0.5, 0.75, 1, 1.5, 2, 2.5, 3, 3.5, 4, 5 and 6 hours after the meal. Glucagon levels were measured at −0.25, 0.25, 0.5, 0.75, 1, 1.5, 2, 3, 4, 5 and 6 hours after the meal. The placebo groups from cohort A and cohort B were pooled. FPG, fasting plasma glucose; LS, least squares; MMTT, mixed-meal tolerance test; PK, pharmacokinetic; PPG, postprandial plasma glucose; QM, once monthly; QW, once weekly.
PPG levels (figure 2B) were significantly reduced with efpeglenatide 6 mg QW and 16 mg QM compared with placebo (p<0.0001 for all PK parameters) (online supplemental table S1). Similar reductions in PPG were generally observed with efpeglenatide 6 mg QW and 16 mg QM compared with liraglutide, although AUC0–360 was significantly lower for efpeglenatide 6 mg QW than for liraglutide (p=0.0377).
HbA1c levels decreased from baseline in the efpeglenatide 6 mg QW (LS mean change from baseline: –1.12 %) and efpeglenatide 16 mg QM (LS mean change from baseline: –1.61 %) groups. Liraglutide also improved HbA1c (LS mean change from baseline: –0.78 %). Observed HbA1c reductions were significantly greater with efpeglenatide 6 mg QW (LS mean difference: –0.77, p=0.0310) and 16 mg QM (LS mean difference: –1.26, p=0.0015) compared with placebo.
Plasma glucagon (figure 2C) concentrations were slightly, but significantly, lower with efpeglenatide 6 mg QW and 16 mg QM vs placebo (p<0.05 for all), with the exception of Cmax for efpeglenatide 6 mg QW (online supplemental table S1). Compared with liraglutide, plasma glucagon concentrations were similar or lower in the efpeglenatide groups, with significant differences between efpeglenatide 16 mg QM and liraglutide for all AUC measures and Cmax (p<0.05 for all).
LS means for all C-peptide AUC measures and Cmax were numerically greater with efpeglenatide 6 mg QW and 16 mg QM compared with placebo, although the differences were not statistically significant (figure 2D; online supplemental table S2). C-peptide response with efpeglenatide 6 mg QW and 16 mg QM was consistently greater than with liraglutide, with statistically significant differences in AUC0–120, AUC0–180 and Cmax, for efpeglenatide 6 mg QW versus liraglutide, and AUC0–180 and Cmax for efpeglenatide 16 mg QM versus liraglutide (online supplemental table S1).
Plasma insulin concentration results are shown in figure 2E and online supplemental table S3. Glucose metabolism endpoints were also measured when efpeglenatide 16 mg QM was at trough concentrations. Results are shown in online supplemental table S2.
Beta-cell function
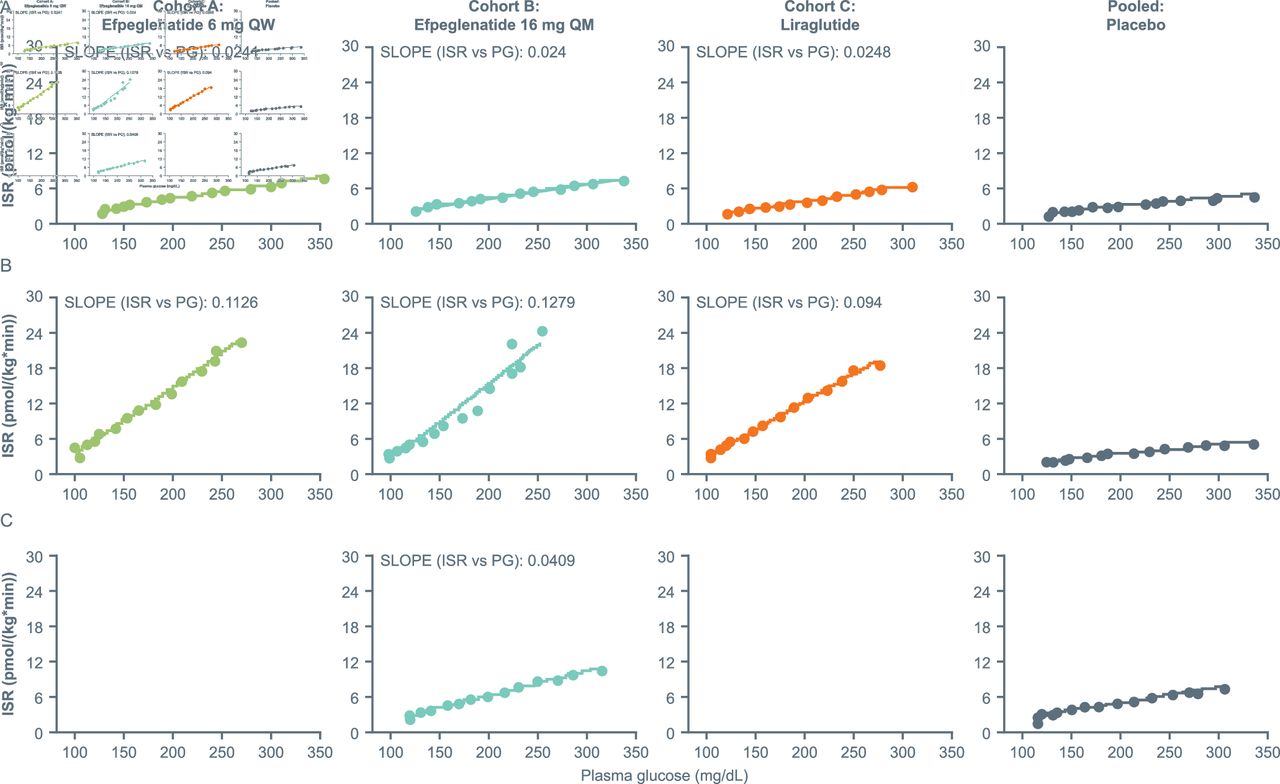
ISR as a function of plasma glucose concentration when assessed by means of the GGI increased during treatment in the efpeglenatide 6 mg QW group (pre-dose vs post-dose: 0.0241 vs 0.1126), in the efpeglenatide 16 mg QM group at peak concentration (0.024 vs 0.1279) and at trough concentration (0.024 vs 0.0409), as well as in the liraglutide group (0.0248 vs 0.094) (figure 3). At peak/steady-state drug concentration, the slope of the ISR/plasma glucose curve, indicative of beta-cell responsiveness, was greater for participants treated with efpeglenatide 6 mg QW and 16 mg QM than for those treated with liraglutide.
ISR as a function of plasma glucose levels by treatment and timepoint: (A) baseline (day −2), (B) steady state (day 25 or day 90) or (C) trough (day 83) (PD population). The placebo groups from cohort A and cohort B were pooled. ISR, insulin secretion rate; PD, pharmacodynamic; PG, plasma glucose; QM, once monthly; QW, once weekly.
Safety assessments
In the weekly cohort, the incidence of participants reporting AEs was 84.6% (n=11/13) with efpeglenatide 6 mg QW and 50% (n=2/4) with placebo. In the monthly cohort, the incidence of participants reporting AEs was 92.3% (n=12/13) with efpeglenatide 16 mg QM and 100% (n=4/4) with placebo. AEs were reported by 61.5% (8/13) of participants who received liraglutide. Rates of AEs considered related to study drug are shown in table 2. The majority of these AEs were considered mild (see online supplemental table S4). No serious AEs were reported. Only one AE led to study discontinuation: a participant receiving efpeglenatide 16 mg QM discontinued due to an AE of increased eructation that was considered mild. All GI AEs (nausea, vomiting and diarrhea) were mild with efpeglenatide 6 mg QW and mild or moderate with efpeglenatide 16 mg QM and liraglutide. Post hoc analysis indicated that the GI-related AEs observed were generally transient and intermittent (data not shown). It should be noted that no dose titration was performed in the efpeglenatide 6 mg QW group, while efpeglenatide 16 mg QM and liraglutide were titrated as indicated in the Materials and methods section.
Number (%) of patients with adverse events related to study drug (n>1 in any group)
In total, injection site reactions were reported by six participants; three participants receiving efpeglenatide 6 mg QW, one participant receiving efpeglenatide 16 mg QM, one participant receiving placebo (QM cohort) and one participant receiving liraglutide. All injection site reactions were considered ‘very slight’ or ‘slight’, and none were characterized by pain on palpitation, itching, erythema, odema or induration.
None of the treatments were associated with clinically significant vital sign changes or abnormal 12-lead ECG results at the follow-up visit. None of the abnormal physical examination findings were considered clinically significant. Heart rate (HR) was increased from baseline in participants receiving efpeglenatide 6 mg QW (mean daytime HR: from 74.1 beats per minute (bpm) to 84.1 bpm; mean night-time HR: from 71.9 bpm to 83.4 bpm). No effect of efpeglenatide 6 mg QW was observed on either systolic or diastolic blood pressure. Slight increases in HR (from 74.0 bpm at baseline to 84.4 bpm at trough concentration and 90.2 bpm at peak concentration for daytime and 73.5 bpm at baseline to 82.0 bpm at trough and 88.9 bpm at peak for night-time) were also observed with efpeglenatide 16 mg QM. Liraglutide-treated participants showed similarly increased daytime (76.7 bpm vs 84.7 bpm) and night-time HR (75.9 bpm vs 83.4 bpm) from baseline, respectively, but the sample size was insufficient to conduct a robust statistical analysis. None of the treatments were associated with clinically significant laboratory abnormalities.
Discussion
In this single-center, exploratory trial, efpeglenatide 6 mg QW overall was non-inferior to liraglutide 1.8 mg QD in delaying gastric emptying at peak drug concentrations based on acetaminophen PK. Non-inferiority was not established for efpeglenatide 16 mg QM at peak/steady state, indicating less of an effect on gastric emptying compared with liraglutide. However, the trough concentration of efpeglenatide 16 mg QM was non-inferior to liraglutide 1.8 mg QD in delaying gastric emptying. In the MMTT, efpeglenatide 6 mg QW and 16 mg QM showed significantly improved glucometabolic outcomes versus placebo. Results from the GGI test suggested benefits for efpeglenatide on beta-cell function, with increases in ISR versus placebo as well as liraglutide.
Delayed gastric emptying is thought to be the primary mechanism by which short-acting GLP-1 RAs reduce PPG.2 6 20 21 Long-acting GLP-1 RAs, such as efpeglenatide and liraglutide, have less impact on gastric emptying and are thought to reduce FPG and PPG by increasing insulin and by reducing glucagon secretion.2 20–22 This phenomenon is also observed in the Japanese population with T2D,23 despite the fact that the diabetes phenotype in Asian populations is defined by marked beta-cell dysfunction, lower insulin resistance, and lower adiposity compared with the Western diabetes phenotype.24 The positive effects of efpeglenatide on FPG, PPG and HbA1c seen in this study, despite the mixed results of the QM dose on gastric emptying, are aligned with this idea and with the classification of efpeglenatide as a long-acting GLP-1 RA. Therefore little, if any, impact on the absorption of concomitantly used drugs is expected during therapeutic use of efpeglenatide.
Results from the GGI test suggested benefits of efpeglenatide over liraglutide on beta-cell function. The presence of greater effects on beta-cell function, and similar glucometabolic outcomes with efpeglenatide versus liraglutide, suggest that the glucose-lowering effect of efpeglenatide is independent of its effect on gastric emptying.
The reductions in FPG and HbA1c observed in this study with efpeglenatide treatment compared with placebo are consistent with those observed in three previous phase II studies: the EXCEED 203 and LIBERATE 204 studies (both in T2D), and the BALANCE 205 study (in obesity without T2D).13 14 17 In EXCEED, the effect of efpeglenatide 4 mg QW in reducing HbA1c was non-inferior to that of liraglutide, whereas in the current study, the effects of efpeglenatide appeared greater than those of liraglutide. However, it should be noted that neither the present nor the EXCEED study was sufficiently powered to allow for definite conclusions regarding the efficacy of efpeglenatide versus liraglutide.13 It is interesting to note that the FPG and HbA1c reductions with efpeglenatide versus placebo were not accompanied by differences in C-peptide or insulin response, although this is also consistent with results from the LIBERATE study.14
Hypoglycemia was reported by 54%, 39% and 8% in the efpeglenatide 6 mg QW, efpeglenatide 16 mg QM, and liraglutide 1.8 mg QD groups, respectively. Only one of these events, in the liraglutide group, was considered to be related to study drug. Of the 16 hypoglycemic events in the study, 10 occurred post GGI. Therefore, these events may reflect exaggerated insulin responses following the GGI, which are typical following this procedure.25
At similar efpeglenatide doses, the rates of nausea, vomiting and diarrhea in this study were comparable to or higher than in other studies. 13 14 17 Of note, no titration was done in the 6 mg QW efpeglenatide group. A 4 mg QW dose of efpeglenatide without titration was included in the EXCEED study, and the rates of these AEs were 33%, 22% and 5% for nausea, vomiting and diarrhea, respectively,13 compared with 38.5%, 23.1% and 38.5% for efpeglenatide 6 mg QW in this study without initial titration. Similarly, the efpeglenatide 16 mg QM group (escalated from 4 mg QW for 4 weeks, then 8 mg dose for 1 week) in the LIBERATE study reported rates of 43.4%, 32.1% and 20.8%, while rates in the 16 mg QM group in this study were 61.5%, 46.2% and 53.8%, respectively.14 The reasons for these variations are not known but are likely to include study design differences, particularly the lower participant numbers in the current study.
It has been suggested that the difference between short-acting and long-acting GLP-1 RAs on gastric emptying may be due to tachyphylaxis.2 As a long-acting GLP-1 RA, efpeglenatide might therefore be expected to have negligible effects on gastric emptying. However, in a study quantifying gastric emptying based on the time taken for half of a radiolabeled meal to leave the stomach, the long-acting GLP-1 RA, liraglutide, was associated with delays in gastric emptying of up to 70 min.26 This could indicate that the effects of long-acting and short-acting GLP-1 RA on gastric emptying may differ depending on whether the liquid or the solid phase contents of the stomach are assessed. Therefore, it may be of interest to further assess the impact of efpeglenatide on the gastric emptying of solids. The present study suggests that while efpeglenatide 6 mg QW was associated with a delay in gastric emptying versus placebo, it did not lead to an increased delay in gastric emptying versus liraglutide. However, the effects of efpeglenatide 16 mg QM on gastric emptying were mixed compared with placebo, suggesting that further studies are needed to establish the effects of the QM dose on gastric emptying and how they might relate to the effects of efpeglenatide observed in clinical studies in T2D. One possibility is that higher peak and trough values of efpeglenatide with QM versus QW dosing may impact GI tolerability.14
Limitations of the present exploratory study include partial blinding due to the differences between efpeglenatide and liraglutide dosing schedules (QW/QM vs QD). Furthermore, it is important to highlight that comparisons of efpeglenatide versus liraglutide and placebo were exploratory in nature; the study was small, with low sample sizes, and therefore may not have been powered to detect differences between the groups. The use of acetaminophen to estimate gastric emptying time may not provide a full picture. Acetaminophen dissolves and empties in the liquid phase of the stomach, hence this method does not provide any information about gastric emptying of solids, which may be different as discussed above. In addition, the AUC values for the later timepoints may be affected by differences in the rate of absorption of acetaminophen over the whole time period.22 Finally, as the analyses were mainly focused on peak concentrations, differences in treatment time course could be a potential confounding factor in interpreting the observed results.
In this study, both dosing regimens of efpeglenatide (QW and QM) had beneficial glucometabolic effects. Efpeglenatide 6 mg QW also significantly improved beta-cell function compared with liraglutide and had similar effects on gastric emptying. All of the GI AEs reported with efpeglenatide were mild or moderate in severity and were transient over treatment and follow-up periods. No safety signals were noted in vital signs, ECG or physical examination findings with efpeglenatide. Longer-term studies of efpeglenatide in larger populations are needed to examine the implications of these findings in clinical practice.
Data availability statement
The datasets generated during and/or analysed during the current study are available from the corresponding author on reasonable request.
Ethics statements
Ethics approval
The study was approved by Sterling IRB (Atlanta, Georgia; IRB ID number: 4553 P-001W) and was conducted according to the ethical principles stated in the latest version of the Declaration of Helsinki and the applicable guidelines for good clinical practice; whichever provided greater protection for the individual. All participants gave written informed consent.
Acknowledgments
In November 2015, Sanofi obtained an exclusive license from Hanmi Pharmaceutical for the worldwide development and commercialization of efpeglenatide, an experimental, long-acting diabetes treatment. This study was conducted by Hanmi Pharmaceutical between December 2013 and July 2014. Editorial assistance was provided by Jennifer Steeber, PhD, of Caudex (New York, USA), and Margarita Lens, MSci, of Fishawack Communications, part of Fishawack Health, and was funded by Sanofi. Isabel Muehlen-Bartmer, MD (Sanofi), performed a courtesy review from a medical and scientific perspective.
References
Supplementary materials
Supplementary Data
This web only file has been produced by the BMJ Publishing Group from an electronic file supplied by the author(s) and has not been edited for content.
Footnotes
Contributors MH, JK, MET and LM contributed to study design, data acquisition, data analysis/interpretation and critical revision of the manuscript for important intellectual content. OH contributed to study conception and design, data analysis/interpretation and critical revision of the manuscript for important intellectual content. CHS, IO and JS contributed data analysis/interpretation and critical revision of the manuscript for important intellectual content. MH is the guarantor of this work and takes responsibility for the contents of the article. All authors confirm that they meet the International Committee of Medical Journal Editors uniform requirements for authorship and that all authors have read, reviewed and agreed to the final version.
Funding This study was funded by Hanmi Pharmaceutical. Editorial assistance for this manuscript was funded by Sanofi.
Competing interests MH is an employee and shareholder of ProSciento. JK was an employee of Hanmi Pharmaceutical at the time the study was conducted. OH is an employee of Hanmi Pharmaceutical. MET is a consultant of ProSciento; has received consulting fees from Atrogi, CeQur SA, Hanmi Pharmaceutical, Kinexum, Novo Nordisk, and Servier; and is on the Data Monitoring Board for Profil. CHS was an employee and shareholder of Sanofi during the development of this publication. JS is an employee and shareholder of Sanofi. IO was an employee of Sanofi during the development of this publication and is a shareholder of Lexicon Pharmaceuticals. LM is a consultant to ProSciento and to TVM Capital Life Science.
Provenance and peer review Not commissioned; externally peer reviewed.
Supplemental material This content has been supplied by the author(s). It has not been vetted by BMJ Publishing Group Limited (BMJ) and may not have been peer-reviewed. Any opinions or recommendations discussed are solely those of the author(s) and are not endorsed by BMJ. BMJ disclaims all liability and responsibility arising from any reliance placed on the content. Where the content includes any translated material, BMJ does not warrant the accuracy and reliability of the translations (including but not limited to local regulations, clinical guidelines, terminology, drug names and drug dosages), and is not responsible for any error and/or omissions arising from translation and adaptation or otherwise.