Article Text

Abstract
Introduction Changes in albuminuria or estimated glomerular filtration rate (eGFR) can be used as a surrogate endpoint of end-stage kidney disease (ESKD) in people with type 2 diabetes. We investigated whether the combined changes in albuminuria and eGFR are more strongly associated with future risk of ESKD.
Research design and methods Using data from a multicenter observational cohort study of people with type 2 diabetes, we evaluated the association of percentage change in urine albumin to creatinine ratio (UACR) and/or annual change in eGFR over 2 years with subsequent ESKD risk.
Results Among 1417 patients with repeated albuminuria and eGFR over 2 years, 129 (9.1%) developed ESKD. Patients with >30% UACR decline had lower ESKD risk (HR 0.47; 95% CI 0.29 to 0.77), whereas those with >30% UACR increase had higher ESKD risk (HR 2.31; 95% CI 1.52 to 3.51), compared with those with minor UACR change. Patients with greater eGFR decline had an increased ESKD risk than those with minor eGFR change (a decline of <2.5 mL/min/1.73 m2/year): HR 4.19 (95% CI 1.87 to 9.38) and 2.89 (95% CI 1.32 to 6.33) for those with a decline of >5 and 2.5–5 mL/min/1.73 m2/year, respectively. When the combined changes in UACR and eGFR were used, the highest ESKD risk (HR 5.60; 95% CI 2.08 to 15.09) was observed among patients with >30% UACR increase and an eGFR decline of >5 mL/min/1.73 m2/year compared with those with a minor change in UACR and eGFR.
Conclusions Combined changes in albuminuria and eGFR over 2 years were strongly associated with future risk of kidney failure in patients with type 2 diabetes.
- function
- albuminuria
- kidney function tests
- diabetes mellitus
- type 2
Data availability statement
All data relevant to the study, details of the study protocol and statistical analysis plan will be available on reasonable request.
This is an open access article distributed in accordance with the Creative Commons Attribution Non Commercial (CC BY-NC 4.0) license, which permits others to distribute, remix, adapt, build upon this work non-commercially, and license their derivative works on different terms, provided the original work is properly cited, appropriate credit is given, any changes made indicated, and the use is non-commercial. See: http://creativecommons.org/licenses/by-nc/4.0/.
Statistics from Altmetric.com
Significance of this study
What is already known about this subject?
Changes in albuminuria or estimated glomerular filtration rate (eGFR) are independently associated with a risk of end-stage kidney disease (ESKD) in people with type 2 diabetes.
Whether the combined changes in albuminuria and eGFR are associated with a greater risk of ESKD than individual changes in albuminuria or eGFR remains unknown.
What are the new findings?
Among 1417 patients with type 2 diabetes, a strong positive relationship between percentage changes in albuminuria and future risk of ESKD as well as an inverse relationship between annual change in eGFR and risk of ESKD were found.
When the combined changes in urine albumin to creatinine ratio (UACR) and eGFR were used, the highest ESKD risk (HR 5.60; 95% CI 2.08 to 15.09) was found among patients with >30% UACR increase and eGFR decline of >5 mL/min/1.73 m2/year compared with those with a minor change in UACR and eGFR.
How might these results change the focus of research or clinical practice?
The combined changes in albuminuria and eGFR were more strongly associated with future risk of kidney failure than either parameter alone.
Closely monitoring albuminuria and eGFR over time may be beneficial in identifying patients with diabetes who are at high risk of kidney failure and in initiating appropriate preventive and therapeutic strategies early.
Introduction
Diabetic kidney disease develops in approximately 40% of individuals with diabetes and remains a leading cause of end-stage kidney disease (ESKD) throughout the world.1 2 Hence, early recognition of diabetic kidney disease progression is critical for early risk stratification and targeted intervention to prevent ESKD.
In recent years, there has been increasing evidence on the predictive utility of short-term changes in urine albumin to creatinine ratio (UACR) and estimated glomerular filtration rate (eGFR) in predicting the risk of ESKD. Previous meta-analyses from clinical trials of renin-angiotensin-aldosterone system(RAAS) inhibitors have demonstrated that the reduction in albuminuria during the first few months of treatment is associated with risk reduction for poor kidney outcomes.3 4 Similarly, previous studies have reported that an annual greater decline in eGFR over time is associated with a higher risk for ESKD.5 6 These data support the monitoring of albuminuria and eGFR to inform kidney prognosis, and both changes in albuminuria and eGFR are currently recommended as surrogate endpoints of chronic kidney disease (CKD) progression.7 However, these results primarily focus on either albuminuria or eGFR. It remains unclear whether the combined changes in albuminuria and eGFR are associated with a greater risk of ESKD than individual changes in albuminuria or eGFR.
This study’s objective was to explore the prognostic value of short-term changes in albuminuria and eGFR in predicting ESKD risk in individuals with type 2 diabetes using the data of a multicenter observational cohort study of patients with type 2 diabetes with long-term follow-up.
Research design and methods
Patients and study design
We used the data from an observational cohort study of 4328 patients with type 2 diabetes treated at 10 centers across Japan between 1985 and 2010. Type 2 diabetes was diagnosed according to the criteria of the Japan Diabetes Society.8 Exclusion criteria were any of the following conditions: age <18 years, type 1 or secondary diabetes, kidney transplantation, maintenance dialysis, missing values for baseline covariates, including UACR, eGFR, glycated hemoglobin (HbA1c), and systolic blood pressure, and refusal to provide informed consent. A detailed description of the study design was published previously.9 Use of other background therapies for glycemic management and control of cardiovascular risk factors were recommended according to local guidelines. All participants provided written informed consent.
This study was restricted to those who underwent repeated UACR and serum creatinine measurements within 2 years from baseline (online supplemental figure 1). We also excluded patients who discontinued the follow-up or experienced the primary outcome within 2 years. Urine albumin and creatinine levels were measured using a turbidimetric immunoassay and an enzymatic method applied on spot urine samples. Serum creatinine level was measured using an enzymatic method, and eGFR was estimated using the equation proposed by the Japanese Society of Nephrology.10
Supplemental material
Study outcome
This study’s primary outcome was ESKD, defined as renal replacement therapy or an eGFR of <15 mL/min/1.73 m2. Regarding the association between changes in UACR and eGFR over 2 years and outcome, patients were followed up from 2 years until the onset of the first study outcome or the end of follow-up until October 2011. In the sensitivity analysis, we repeated the analyses using ESKD or death as the study outcome.
Statistical analyses
We calculated the percentage change in UACR over 2 years from baseline based on two UACR measurements recorded at baseline and at 2 years. If UACR measurements were not recorded at 2 years, change in UACR was calculated using UACR measurements at 1 year instead. We then classified the patients into three categories, namely >30% decline, 30% decline to 30% increase (minor change), and >30% increase, as done in previous studies.3 4 11 12
The annual change in eGFR was calculated using linear mixed-effects models, based on two or three eGFR measurements recorded at baseline and at 1 and/or 2 years. Patients were then classified into three categories, namely substantial decline (>5 mL/min/1.73 m2/year), mild decline (2.5–5 mL/min/1.73 m2/year), and minor change (<2.5 mL/min/1.73 m2/year), as done in previous studies.13 A decline in eGFR of greater than −5 mL/min/1.73 m2/year is defined as a rapid eGFR decline according to the 2012 Kidney Disease: Improving Global Outcomes(KDIGO) guideline.14
Baseline patient characteristics were summarized according to the categories of changes in UACR and eGFR. Continuous variables were reported as mean with SD for variables with approximately symmetrical distributions. The results for variables with skewed distributions were presented as median and IQR and were transformed into natural logarithms before analysis. Correlations between the changes in UACR and eGFR were tested using Pearson’s correlation coefficient. For assessing factors associated with >30% increase in UACR or a substantial decline in eGFR (>5 mL/min/1.73 m2/year), logistic regression analyses were performed after adjusting for baseline covariates including age, sex, history of cardiovascular disease (coronary heart disease, stroke, cerebral hemorrhage, heart failure, or arteriosclerosis obliterans), systolic blood pressure, HbA1c, log-transformed albuminuria, and eGFR.
Cox proportional regression was used to analyze the association between changes in UACR and eGFR and kidney outcome. In this analysis, we used minor change in UACR and eGFR as reference and adjusted for baseline covariates, including age, sex, history of cardiovascular disease, systolic blood pressure, HbA1c, log-transformed albuminuria, and eGFR. Linear trends across the categories of change in UACR and eGFR were evaluated by including categories as a continuous variable in the model. The same approach was used to evaluate the association between the combination of changes in UACR and eGFR and kidney outcome using minor changes in both UACR and eGFR as reference.
We next performed subgroup analyses according to baseline covariates, including age (<60 or ≥60 years), sex, eGFR (<60 or ≥60 mL/min/1.73 m2), and albuminuria (<30, 30–300, or >300 mg/g). Interaction tests were performed by adding an interaction term between the categories of changes in UACR and eGFR and the categories of baseline covariates to the Cox models. For sensitivity analyses, we repeated the analyses using the following multiple measures of changes in UACR over 2 years: (1) 43% increase instead of 30% increase, (2) absolute changes in UACR (calculated based on two UACR measurements recorded at baseline and at 2 years), (3) progression of albuminuria (increase from <30 mg/g to ≥30 mg/g or from 30–300 mg/g to ≥300 mg/g at 1 or 2 years), and (4) regression of albuminuria (decrease from ≥30 mg/g to <30 mg/g or from ≥300 mg/g to <300 mg/g at 1 or 2 years). We also repeated the analyses using percentage changes in eGFR (calculated based on two eGFR measurements recorded at baseline and at 2 years): >30% decline, >0%–30% decline, and ≥0% increase. P<0.05 was considered statistically significant, and all analyses were performed using Stata V.16.
Results
Patient characteristics
Among the 4328 patients in the overall cohort, 1417 (32.7%) were included in our final cohort. The mean age of the study cohort was 60 years (SD 11), 57% were men, the mean eGFR was 80 mL/min/1.73 m2 (SD 25), and the median UACR was 19 mg/g (IQR 9–86) (table 1). The baseline characteristics of this patient cohort were similar to those of the entire study cohort.9 The median change in UACR over 2 years was 0% (IQR −34% to 58%) (online supplemental figure 2). Patients with an increase in UACR of >30% were more likely to be younger and have lower levels of blood pressure and UACR and higher levels of HbA1c than those with >30% decline in UACR. The mean annual change in eGFR was −3.7 (SD 3.5) mL/min/1.73 m2/year (online supplemental figure 2). Patients with a substantial decline in eGFR of >5 mL/min/1.73 m2/year were more likely to have higher levels of systolic blood pressure, HbA1c, and UACR than patients with a minor change in eGFR (a decline of <2.5 mL/min/1.73 m2/year).
Baseline characteristics according to percentage changes in UACR and annual changes in eGFR over 2 years
There was no correlation between the change in UACR and in eGFR (|r|=0.05, p=0.06; online supplemental figure 3). In the multivariate analyses, younger age, higher levels of HbA1c, and lower levels of UACR and eGFR were independently associated with a higher risk of >30% increase in UACR over 2 years, whereas older age and higher levels of HbA1c, UACR, and eGFR were associated with a higher risk of substantial decline in eGFR (>5 mL/min/1.73 m2/year) (online supplemental table 1).
Association between UACR and eGFR changes and kidney outcome
Over a median follow-up of 6 years (IQR 5–7), 129 (9.1%) patients developed ESKD. Patients with >30% decline in UACR were associated with a lower risk of ESKD (HR 0.47; 95% CI 0.29 to 0.77; p=0.003), whereas those with >30% increase in UACR were associated with a higher risk of ESKD (HR 2.31; 95% CI 1.52 to 3.51; p<0.001) than patients with a minor change in UACR (30% decline to 30% increase) (figure 1A). There was a positive linear association between change in UACR and ESKD risk (p value for trend <0.001).
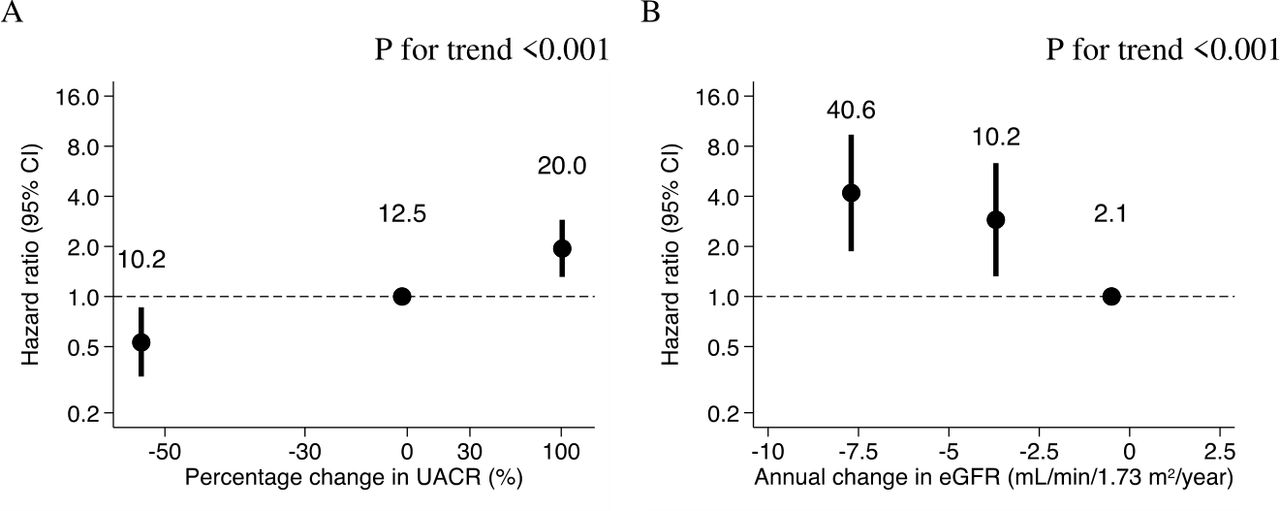
Adjusted HR (95% CI) for ESKD by percentage changes in UACR (A) and annual changes in eGFR (B) over 2 years. Adjusted for sex, age, history of cardiovascular disease, and baseline covariates including HbA1c, systolic blood pressure, log-transformed UACR, and eGFR, and stratified with institution. Event rates per 1000 patient years in each category are shown above the plots. eGFR, estimated glomerular filtration rate; ESKD, end-stage kidney disease; HbA1c, glycated hemoglobin; UACR, urine albumin to creatinine ratio.
In contrast, there was an inverse linear association between annual change in eGFR and ESKD risk (p<0.001) (figure 1B). Compared with patients with a minor change in eGFR (a decline of <2.5 mL/min/1.73 m2/year to increase), those with greater eGFR decline were associated with an increased risk of ESKD, with the HR values being 4.19 (95% CI 1.87 to 9.38; p<0.001) for those with a substantial decline of >5 mL/min/1.73 m2/year and 2.89 (95% CI 1.32 to 6.33; p=0.008) for those with a decline of 2.5–5 mL/min/1.73 m2/year.
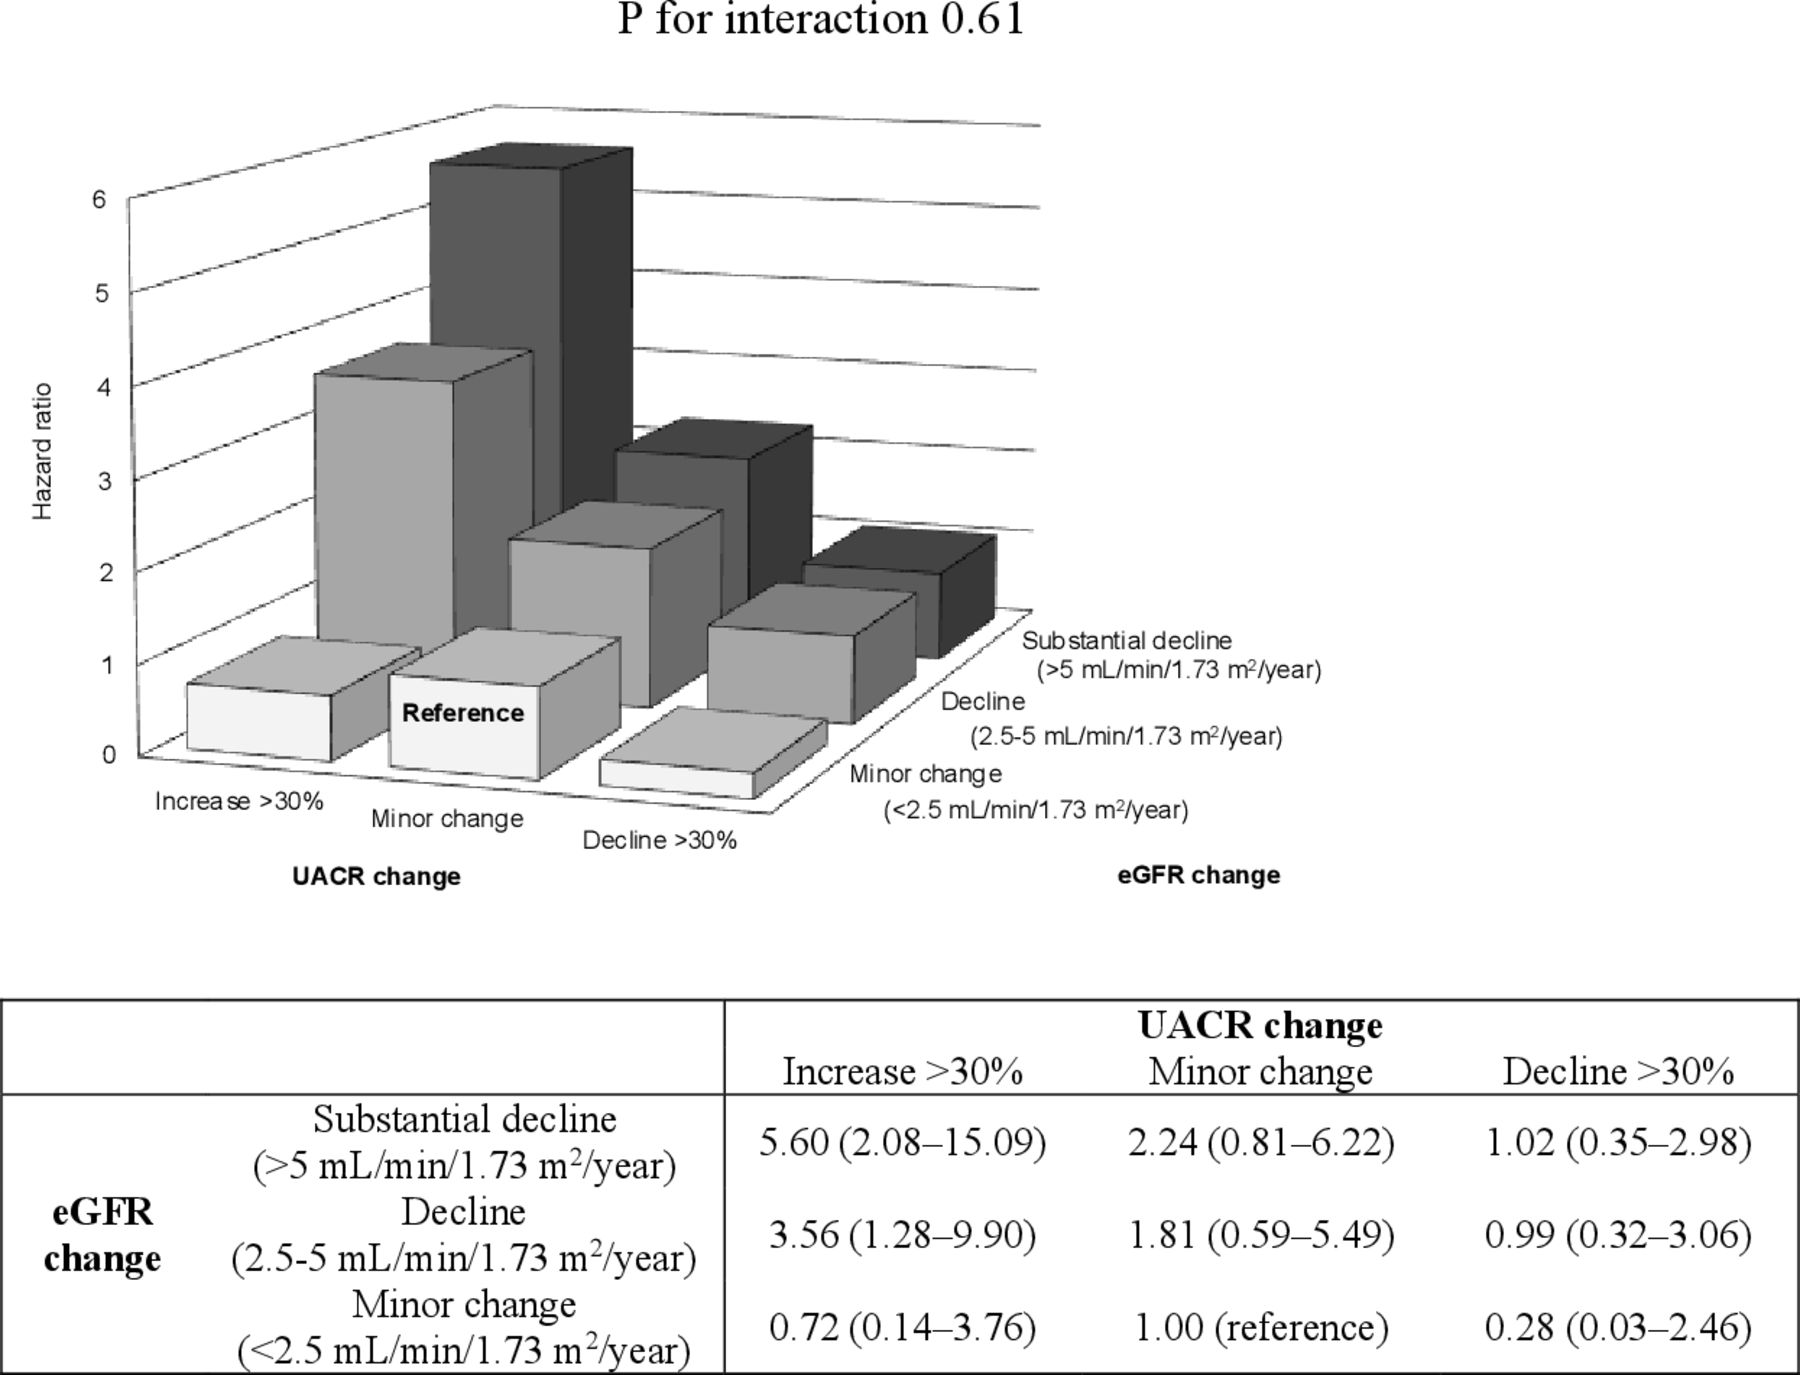
When the combination of changes in UACR and eGFR categories was used, we found the highest risk for ESKD among patients with >30% increase in UACR and a substantial decline in eGFR of >5 mL/min/1.73 m2/year compared with those with a minor change in both UACR and eGFR (HR 5.60; 95% CI 2.08 to 15.09; p<0.001) (figure 2).
Adjusted HR (95% CI) for ESKD by combination of percentage changes in UACR and annual changes in eGFR over 2 years. Adjusted for sex, age, history of cardiovascular disease, and baseline covariates including HbA1c, systolic blood pressure, log-transformed UACR, and eGFR, and stratified with institution. eGFR, estimated glomerular filtration rate; ESKD, end-stage kidney disease; HbA1c, glycated hemoglobin; UACR, urine albumin to creatinine ratio.
Subgroup and sensitivity analyses
The overall results remained unchanged across baseline patient characteristics defined by age, sex, eGFR, and albuminuria (online supplemental table 2). The association between changes in UACR and ESKD risk was stronger in patients with normal kidney function (eGFR ≥60 mL/min/1.73 m2) than in those with kidney dysfunction (eGFR <60 mL/min/1.73 m2) (p value for interaction 0.026). Stronger association was also observed between changes in eGFR and ESKD risk in those with eGFR ≥60 mL/min/1.73 m2, compared with those with eGFR <60 mL/min/1.73 m2 (p value for interaction 0.034). In contrast, the associations between changes in UACR and eGFR and ESKD risk were consistent across baseline albuminuria subgroups (p value for interaction >0.63).
In the sensitivity analysis, statistically significant but weaker associations were observed for subsequent risk of ESKD or death (online supplemental table 3). When a >43% increase in UACR was used instead of a >30% increase, a strong linear association remained unchanged between changes in UACR and ESKD risk (p value for trend <0.001) (online supplemental table 4). The associations were statistically significant but weaker when using absolute changes in UACR, compared with the analysis using percentage changes in UACR. Furthermore, patients with progression of albuminuria were associated with a higher risk of ESKD (HR 2.86; 95% CI 1.23 to 4.44; p=0.02) compared with those without. When percentage changes in eGFR were used, statistically significant but weaker associations were observed between changes in eGFR and ESKD risk (p value for trend 0.003) (online supplemental table 5).
Discussion
We observed a strong positive relationship between percentage changes in albuminuria and future risk of ESKD as well as an inverse relationship between annual change in eGFR and risk of ESKD in people with type 2 diabetes. Moreover, the combined changes in albuminuria and eGFR were more strongly associated with future risk of kidney failure than either parameter alone. These associations were independent of currently available risk factors, including baseline kidney function, albuminuria, and other covariates, and consistent across patient subgroups of covariates. Our results from multiple analyses supported the prognostic values of UACR changes and eGFR slopes in predicting the subsequent risk of ESKD in people with type 2 diabetes.
Similar relationships between changes in either albuminuria or eGFR and future risk of poor kidney outcomes were reported in previous studies of patients with and without diabetes. A meta-analysis of clinical trials that primarily included patients with diabetes demonstrated that each 30% decrease in albuminuria by treatment versus control was associated with an average 27% lower likelihood of clinical kidney outcome.3 Another meta-analysis using 28 cohorts reported that a 43% increase in UACR over 2 years had an adjusted HR of 1.16 (95% CI 1.03 to 1.31) for ESKD, which is opposite in direction but similar in magnitude to that of a 30% decrease in UACR.4 In contrast, results from a meta-analysis of 13 CKD cohorts demonstrated that an eGFR slope of −3 vs 0 mL/min/1.73 m2/year over 3 years was associated with ESKD risk (HR 1.73; 95% CI 1.50 to 2.00).15 The study on patients with diabetes supported this association.6 These findings support the utility of changes in albuminuria and eGFR slope as surrogate endpoints of adverse kidney outcomes in patients with diabetes and CKD.7 Recent trials on kidney outcome have evaluated both UACR changes and eGFR slope for analyses of treatment efficacy.16 17
The present study has demonstrated that the combination of UACR changes and eGFR slope can be used as a stronger predictor of ESKD risk than either parameter alone. To date, only a few studies have evaluated the prognostic value of these combined effects. In a post-hoc analysis using the Action in Diabetes and Vascular Disease: Preterax and Diamicron MR Controlled Evaluation(ADVANCE) trial data, both an eGFR decrease of ≥40% and a UACR increase of ≥40% had 2.31 (95% CI 1.67 to 3.18) times the risk for kidney and major macrovascular events and mortality, with an evidence of interaction between these two markers.18 However, instead of eGFR slope, the authors of that study used percentage changes in eGFR, which may not be practical for the early stages of CKD because large percentage declines in eGFR are less frequent in patients with a higher baseline eGFR than in those with a lower eGFR.19 The results from this study similarly showed less frequent patients with an eGFR decline of ≥30% over 2 years compared with those with an eGFR decline of ≥5 mL/min/1.73 m2/year, which may lead to weaker associations between changes in eGFR and ESKD risk. Our study evaluated UACR changes and eGFR slope, both recommended for use as surrogate endpoints of ESKD in the early stages of CKD,7 and observed a strong association between combination of UACR changes and eGFR slope and risk of ESKD.
Traditionally, diabetic nephropathy has been characterized based on persistent increasing albuminuria and subsequent decline in kidney function. However, an increasing number of studies have suggested that there are patients with diabetes who had different trajectories of albuminuria and eGFR from these phenotypes.20 21 Our study showed no correlation between changes in albuminuria and eGFR, indicating that albuminuria sometimes remains unchanged in patients with eGFR declines, while kidney function is sometimes preserved in those with increasing albuminuria. In these subgroups, the risks for ESKD are similar to the risks in the subgroup with minor changes in the two markers, suggesting that monitoring both albuminuria and eGFR improves the accuracy of risk stratification. Our findings also demonstrated the differences in baseline patient characteristics associated with an eGFR decline and a UACR increase, including age, albuminuria, and eGFR. Similar findings were observed in previous studies,22 23 indicating that these factors are related to the dissociation of trajectories of albuminuria and eGFR.
Our study’s strengths include the real-world clinical data with many patients and the long duration of follow-up. However, there are also several limitations. Although we adjusted for multiple risk factors, we cannot exclude residual confounding factors such as body mass index, smoking status, retinopathy, and medications such as those used to lower blood pressure or glucose levels. Second, albuminuria and serum creatinine were not regularly measured and may vary among centers, resulting in some misclassification of the true course of change in albuminuria and kidney function. Also, the estimation of changes in UACR and eGFR may be subject to measurement errors, including regression to the mean. Finally, as our cohort included a higher-risk population showing faster decline in eGFR compared with previous studies,22 24 25 the results may limit generalizability to broader populations with diabetes.
In conclusion, our study has shown that changes in albuminuria and eGFR over 2 years, especially when used in combination, were strongly associated with future risk of kidney failure in patients with type 2 diabetes. These results suggest that monitoring both albuminuria and eGFR over time helps identify individuals with diabetes at high risk of kidney failure and those who require close monitoring for early initiation of appropriate preventive and therapeutic strategies.
Data availability statement
All data relevant to the study, details of the study protocol and statistical analysis plan will be available on reasonable request.
Ethics statements
Ethics approval
The local institutional ethics committees approved the study protocols at each site. The study was approved by the Kanazawa University ethical committee (approval number 2017-273).
Acknowledgments
The authors thank Dr Yukinari Yamaguchi (Nara Medical University, Japan), Dr Mitsuhiro Yoshimura (Noto General Hospital, Japan), and Miyuki Murakami (Kanazawa University, Japan) for supporting this study.
References
Supplementary materials
Supplementary Data
This web only file has been produced by the BMJ Publishing Group from an electronic file supplied by the author(s) and has not been edited for content.
Footnotes
Contributors MO, TT, and TW contributed to the concept and rationale for this study. MO conducted statistical analysis with advice from TT and TW. All authors were involved in data interpretation and discussion. MO and TT drafted the manuscript. All authors reviewed and edited the manuscript and approved the final submitted version.
Funding This study was supported by Grant-in-Aids for Diabetic Nephropathy Research and for Diabetic Nephropathy and Nephrosclerosis Research, from the Ministry of Health, Labour and Welfare of Japan and the Ministry of Education, Science, Sports and Culture, Japan.
Competing interests None declared.
Provenance and peer review Not commissioned; externally peer reviewed.
Supplemental material This content has been supplied by the author(s). It has not been vetted by BMJ Publishing Group Limited (BMJ) and may not have been peer-reviewed. Any opinions or recommendations discussed are solely those of the author(s) and are not endorsed by BMJ. BMJ disclaims all liability and responsibility arising from any reliance placed on the content. Where the content includes any translated material, BMJ does not warrant the accuracy and reliability of the translations (including but not limited to local regulations, clinical guidelines, terminology, drug names and drug dosages), and is not responsible for any error and/or omissions arising from translation and adaptation or otherwise.