Article Text

Abstract
Introduction The purpose of this study was to characterize using MRI the effects of a 10-week supervised exercise program on lower extremity skeletal muscle composition, nerve microarchitecture, and metabolic function in individuals with diabetic peripheral neuropathy (DPN).
Research design and methods Twenty participants with DPN completed a longitudinal trial consisting of a 30-day control period, during which subjects made no change to their lifestyle, followed by a 10-week intervention program that included three supervised aerobic and resistance exercise sessions per week targeting the upper and lower extremities. The participants’ midcalves were scanned with multinuclear MRI two times prior to intervention (baseline1 and baseline2) and once following intervention to measure relaxation times (T1, T1ρ, and T2), phosphocreatine recovery, fat fraction, and diffusion parameters.
Results There were no changes between baseline1 and baseline2 MRI metrics (p>0.2). Significant changes (p<0.05) between baseline2 and postintervention MRI metrics were: gastrocnemius medialis (GM) T1 –2.3%±3.0% and soleus T2 –3.2%±3.1%. Trends toward significant changes (0.05<p<0.1) between baseline2 and postintervention MRI metrics were: calf adipose infiltration –2.6%±6.4%, GM T1ρ –4.1%±7.7%, GM T2 –3.5%±6.4%, and gastrocnemius lateral T2 −4.6±7.4%. Insignificant changes were observed in gastrocnemius phosphocreatine recovery rate constant (p>0.3) and tibial nerve fractional anisotropy (p>0.6) and apparent diffusion coefficient (p>0.4).
Conclusions The 10-week supervised exercise intervention program successfully reduced adiposity and altered resting tissue properties in the lower leg in DPN. Gastrocnemius mitochondrial oxidative capacity and tibial nerve microarchitecture changes were not observed, either due to lack of response to therapy or to lack of measurement sensitivity.
- exercise
- MRI
- intervention
- lower extremity
Data availability statement
Data are available upon reasonable request. The datasets generated during and/or analyzed during the current study are available from the corresponding author upon reasonable request.
Data availability statement
The datasets generated during and/or analyzed during the current study are available from the corresponding author on reasonable request. No applicable resources were generated or analyzed during the current study. The datasets generated during and/or analyzed during the current study are available from the corresponding author upon reasonable request.
This is an open access article distributed in accordance with the Creative Commons Attribution Non Commercial (CC BY-NC 4.0) license, which permits others to distribute, remix, adapt, build upon this work non-commercially, and license their derivative works on different terms, provided the original work is properly cited, appropriate credit is given, any changes made indicated, and the use is non-commercial. See: http://creativecommons.org/licenses/by-nc/4.0/.
Statistics from Altmetric.com
Significance of this study
What is already known about this subject?
Pharmacological options to treat or reverse the progression of diabetic peripheral neuropathy (DPN) are not available. While exercise has been shown to improve pain interference, vascular health, and neuropathic symptoms, muscle composition following short-term intervention has yet to be reported.
What are the new findings?
10-week supervised exercise intervention reduced MRI relaxation times in calf muscles.
Changes in MRI relaxation times were associated with changes in clinical markers.
10-week supervised exercise intervention reduced adiposity in the combined calf interstitial and muscle space but not in individual calf muscles.
How might these results change the focus of research or clinical practice?
Our study shows that short-term exercise intervention improves muscle composition in DPN, which may provide clinicians with an appealing treatment option that can complement pharmaceutical intervention.
Introduction
Approximately 34 million people have diabetes in the USA,1 and 30%–50% of patients with type 2 diabetes develop diabetic peripheral neuropathy (DPN).2 DPN is characterized by metabolic and microvascular impairment that damage peripheral nerves and cause ischemic conditions and muscle degeneration in the lower extremities.3 Prolonged DPN causes significant skeletal muscle deficits, including increased adiposity and loss of strength and endurance.4–6
Pharmacological options to treat or reverse the progression of DPN are not available and alternatively target pain response.7–9 Exercise training is an appealing option to potentially delay or reverse DPN progression because of its promise for improving glycemic control, insulin sensitivity, and adiposity in individuals with diabetes.10–13 Among interventions such as exercise therapy, electrotherapy, and other physiotherapy methods, exercise therapy has been the most effective.14 Studies have shown that supervised exercise improves cardiorespiratory function, innervation,15–17 nerve conduction,18 muscle strength, balance,19 and reduces pain interference.20 However, the effects of exercise on key DPN markers such as lower extremity muscle adiposity, nerve microarchitecture, and muscle metabolism have yet to be reported. MRI is an appropriate means to measure such markers, as proton-based Dixon MRI is well established for quantifying adipose content,4 6 diffusion tensor imaging for assessing nerve integrity,21 while dynamic phosphorus and static proton MRI, respectively, provide information on mitochondrial function22 23 and muscle tissue composition.24–29 Therefore, the goals of this longitudinal, prospective study were to determine with multinuclear MRI whether short-term supervised exercise intervention improves lower extremity adipose infiltration, neuronal microarchitecture, skeletal muscle tissue composition, and muscle oxidative capacity.
Research design and methods
Study design and participants
Individuals aged between 40 and 70 years with type 2 diabetes and diabetic neuropathy or with type 2 diabetes and symptoms such as lack of monofilament and vibration perception were invited to enroll in this longitudinal study. The exclusion criteria were: difficulty walking without assistance, foot ulcer within 3 months of enrollment, partial foot amputation, stroke, central nervous system pathology, stage 2 hypertension, acute medical conditions that were deemed incompatible with exercise intervention such as cardiac failure, peripheral arterial disease, alcoholism, chronic drug use, chronic gastrointestinal disease, renal or hepatic impairment, pregnancy, and contraindications for MRI (eg, body mass index (BMI) >40 kg/m2, claustrophobia, pacemaker, or other MRI incompatible implants). DPN status was confirmed prior to MRI using the Michigan Neuropathy Screening Instrument (MNSI);30 participants with MNSI physical exam score <1 were excluded. Participants received normal medical care prescribed by their physicians during the study. Recruitment began in November 2018 and was suspended in March 2020 due to restrictions related to COVID-19. Subjects participated in examinations and exercise intervention in the following chronology: week 0: baseline1 MRI and clinical tests; week 3: baseline2 MRI and aerobic fitness measurements; weeks 4–14: exercise intervention; week 15: postintervention MRI, clinical tests, and aerobic fitness measurements. Baseline2 MRI was carried out to potentially detect changes that reflect inadvertent lifestyle adjustment following study enrollment.
Clinical tests
Blood draws were administered at baseline1 and postintervention to record glycosylated hemoglobin (HbA1c), C reactive protein and glucose levels at 30 min intervals during an oral glucose tolerance test (OGTT). The OGTT data were used to calculate the Matsuda index and homeostasis model assessment of insulin resistance (HOMA-IR). Participants were instructed to forego diabetes medications 1 day prior and fast 8–12 hours prior to blood draws.
Aerobic fitness
Peak heart rate, rating of perceived exertion, blood pressure, and peak oxygen consumption (VO2peak) were assessed during a treadmill test administered at baseline2 and postintervention. The test was performed according to the Balady Modified Ramp Protocol,31 aiming for age predicted heart rate maximum plateau and subject reported volitional exhaustion. Twelve-lead ECGs were monitored throughout exercise to screen for ischemic changes (≥1 mm horizontal or down-sloping ST-segments in an individual lead) and significant ectopy (three consecutive heartbeats with ventricular ectopy or onset of atrial fibrillation or tachyarrythmia).
Exercise intervention
The 10-week personalized exercise intervention program consisted of three sessions per week supervised by a physical therapist, which included moderate-intensity aerobic and resistance components. Moderate-intensity aerobic exercise (50%–70% of oxygen uptake (V̇O2) reserve) was performed on a treadmill or recumbent stepper and individually prescribed based on heart rate response to the graded maximum exercise test described previously. The aerobic exercise progressed from 30 to 50 min per session over the duration of the program. Resistance exercises included bicep and tricep curls, bent rows, leg press and standing heel raises. The resistance level for a given exercise was progressed every 3 weeks if the participant was able to complete the prescribed number of repetitions with lower rate of perceived exertion. Blood glucose, blood pressure, heart rate, rate of perceived exertion, and adverse events were monitored at each session. A visual foot examination was performed once each week.
Multinuclear MRI
All MRI experiments were performed on a 3 Tesla scanner (Prisma, Siemens Medical Solutions, Erlangen, Germany) with an in-house developed, investigational multinuclear (proton/phosphorus) lower extremity coil.32 The scans were centered at the widest lateral midcalf dimension of the right leg at baseline1. The distance between the base of the foot and midcalf was measured using a ruler affixed to the system and subsequently used to landmark participants to reduce longitudinal position variability in baseline2 and postintervention scans.
To measure fat fraction, we acquired Dixon-based proton three-dimensional gradient echo data with the following parameters: echo time (TE)=2.1, 2.8 and 3.7 ms; repetition time (TR)=12 ms, field of view (FOV)=220×220×200 mm3, resolution=1.7×1.7×5.0 mm3, slices=40, and total acquisition time=3 min. The flip angle was set to 3° to minimize T1 bias.33 The proton density fat fraction maps were calculated by processing the gradient echo data using the Hierarchiacal IDEAL method in MATLAB (R2019a, The MathWorks, Natick, Massachusetts, USA).34
We measured proton relaxation times at rest using a two-dimensional magnetic resonance fingerprinting technique that encoded spin–lattice relaxation (T1), spin–spin relaxation (T2), and spin–lattice relaxation in the rotating frame (T1ρ).35 Four consecutive axial images were acquired with FOV=140×140 mm2, resolution=0.6×0.6×4.0 mm3, TE/TR=3.5/7.5 ms, BW=420 Hz/pixel, number of shots=4, spin-lock power fsl=500 Hz, and acquisition time=4:45 min. The measured signal fingerprint was compressed using singular value decomposition and matched using an iterative approach to simulated MR fingerprints for possible T1, T2, T1ρ, and B1+ values, which were computed using extended phase graphs. All processing was performed using a MATLAB script written in-house.
Fractional anisotropy (FA) and apparent diffusion coefficient (ADC) were measured in the tibial nerve (TN) using a diffusion tensor imaging (DTI) sequence with the following parameters: TR/TE=5300/65 ms, resolution=0.5×0.5×3.0 mm3, image matrix=128×128, FOV=160 mm, b-value=0 and 1200, number of diffusion encoding directions=12, number of slices=60, and acquisition time=5:17 min.
Following the resting measurements previously, we measured the phosphocreatine recovery rate time constant using a dynamic three-dimensional 31P-MRI FLORET (non-Cartesian Fermat looped, orthogonally encoded trajectories) pulse sequence.36 The time constant was calculated from data acquired following an exercise routine in which participants performed plantar flexion for 90 s at 0.66 Hz according to an acoustic cue on an in-house developed, MR-compatible ergometer.37 During plantar flexion, the participant moved the ergometer footplate through approximately 30° range of motion with resistance applied by rubber tubing designed to deplete phosphocreatine by 15%–40% from its value at rest. Images with the following parameters were acquired serially for 420 s: 30 s baseline reference before the plantar flexion routine, during the 90 s routine, and 300 s after the routine. The following imaging parameters were used: FOV=550 mm isotropic, TR=0.5 s, flip angle=25°, 3 hubs at 45°, 4 interleaves per hub, 17 mm nominal isotropic resolution, 32 slices, and 6 s acquisition time per image.
Statistical analysis
To investigate fat fraction distribution, we manually segmented five axial slices (25 mm) into muscle compartments: gastrocnemius medialis (GM), gastrocnemius lateralis (GL), and soleus (SOL). Secondarily, we created an ‘interior’ region of interest to quantify fat fraction in the merged muscle and interstitial regions; the interior region included all tissue within the muscle fascia except the tibia, and fibula (see figure 1, bottom row). All region of interests (ROIs) were eroded by 4 mm to minimize contamination from neighboring tissue. The proton relaxation values were measured in the GM, GL, and SOL in four slices (16 mm).

MRI data from a DPN patient in their 50s at baseline1 (first column), baseline2 (middle column), and postintervention (last column). Row 1 shows fat fraction maps and values in the interior ROI, row 2 shows measured gastrocnemius phosphocreatine levels (blue) and fitted mono-exponential resynthesis curves (red) and time constants during recovery following plantar flexion exercise, and row 3 shows ROIs. Similar fat fraction in the interior ROI and phosphocreatine recovery time constant are observed at baseline1 and baseline2, while reduced values are observed postintervention. DPN, diabetic peripheral neuropathy; ROI, region of interest.
Tractography was performed in manually defined TN ROIs using MRTrix3 software.38 A threshold was subsequently applied to exclude voxels outside the central 37 slices or whose intensity was lower than 50% of the maximum in the tract. The mean ADC and FA were calculated in the resulting tracts.
To determine the phosphocreatine recovery time constant τ we normalized the signal amplitude such that its value at rest was 1 and fitted the signal after plantar flexion to a monoexponential model:

where  is phosphocreatine depletion immediately following plantar flexion. Owing to the 6 s temporal resolution of the measurement, cases with
  <15% were omitted since τ could not be fitted with confidence.
The paired, two-tailed Student’s t-test was used to determine the statistical significance between: baseline1 and baseline2 MRI, baseline2 and postintervention MRI, and preintervention and postintervention clinical and diabetic markers. The Spearman rank correlation coefficient (rs) was used to assess the association between changes in MRI variables (expressed as per cent change between baseline2 and postintervention) and changes in diabetic markers (expressed as per cent change between preintervention and postintervention). Statistical significance was set at p<0.05, and all tests are reported without multiple comparison correction and without regard to sex due to the exploratory nature of the study.
Results
Thirty-four individuals were enrolled in the study. Seven were unable to complete the study due to the COVID-19 outbreak and seven withdrew prior to completion for the following reasons: one individual experienced ventricular ectopy with reduced systolic blood pressure during the treadmill VO2peak test and was deemed unfit for exercise, two underwent surgery, two cited personal reasons and two provided no explanation.
Table 1 lists participant characteristics and exercise intervention compliance for the 20 individuals that completed the study; those individuals attended 89%±12% of the 30 prescribed intervention sessions and achieved the desired heart rate to within 1%. Medications prescribed by participants’ physicians were maintained during the study: 16 of 20 participants used metformin, 14 used statins, 9 used insulin, and 1 used beta-blockers. The metformin, statin, and beta-blocker dosages were maintained throughout the study. In one participant, insulin was discontinued between baseline2 and postintervention. In another participant, insulin dosage was reduced from 200 to 100 units between baseline1 and baseline2.
Participant characteristics, intervention compliance, and clinical tests (n=20)
Table 1 lists clinical and diabetic markers before and after 10-week intervention. No significant change was observed in BMI, MNSI score, VO2peak, and blood markers related to diabetic risk (p>0.1). Due to technical developments being carried out during the study, relaxation time measurements are reported only at baseline2 and postintervention in a subset of 12 subjects, 8 of which were included in a previous study.35 No changes were observed in the clinical and diabetic markers in the 12-participant subset (p>0.1) (online supplemental table 1).
Supplemental material
Figures 1 and 2 show fat fraction maps, phosphocreatine signal plots, and relaxation time maps in a participant in their 50s. Table 2 summarizes MRI measurements from the cohort. The following data sets were excluded: one fat fraction case and two DTI cases due to corrupt MRI files, one DTI case due to patient motion that prevented tractography, and five phosphocreatine cases due to less than 15% depletion. No significant change between baseline1 and baseline2 was observed in fat fraction in the leg interior or in individual muscle ROIs (p>0.4). There was a trend toward significant fat fraction reduction after intervention in the leg interior ROI: −2.6±6.4% (p<0.1), while insignificant change was observed in individual calf muscles (p>0.5). T1 (−2.3±3.0%), T2 (−3.5±6.4%), and T1ρ (−4.1±7.7%) changes were observed in GM (p<0.1), and T2 changes were observed in GL (−4.6±7.4%) and SOL (−3.2±3.1%) (p<0.1). No changes in FA or ADC were observed between baseline1 and baseline2 (p>0.3) or between baseline2 and postintervention (p>0.4). No change in phosphocreatine recovery time constant was observed between baseline1 and baseline2 (p>0.5) or between baseline2 and postintervention (p>0.3).
MRI results

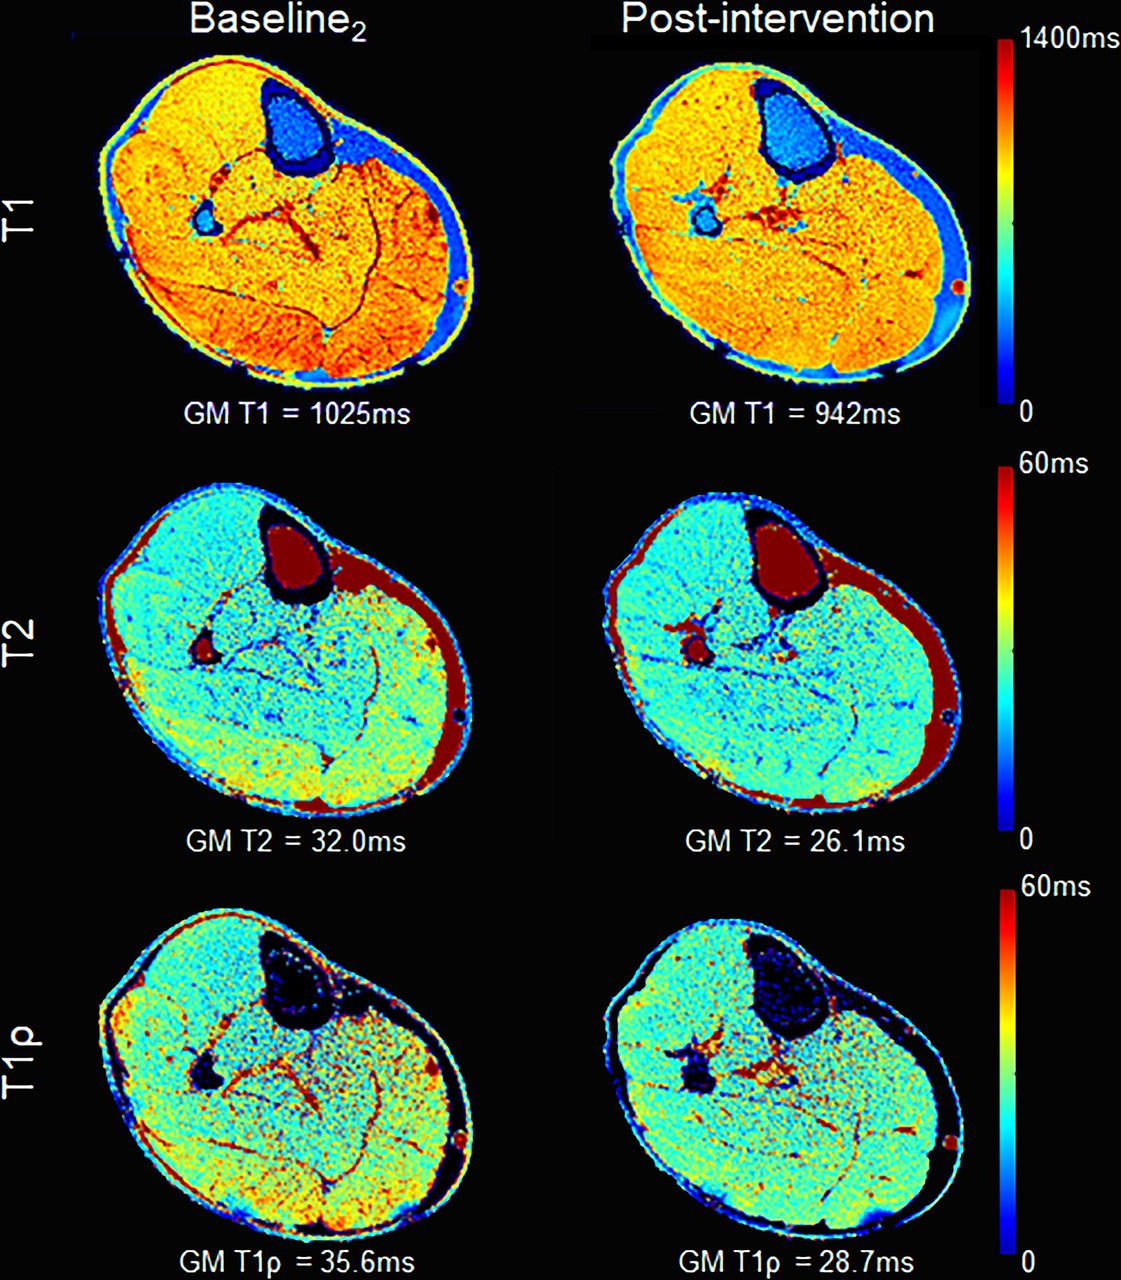
Relaxometry maps from the same subject as in figure 1 show reduced postintervention T1 (row 1), T2 (row 2), and T1ρ (row 3). Text overlays indicate average values in the gastrocnemius medialis (GM).
Table 3 lists pairs of MRI measurements and diabetic markers whose values changed between preintervention and postintervention in a correlated manner (p<0.05). We observed unexpected negative correlation between fat fraction in the interior ROI and HbA1c as well as unexpected positive correlations between relaxation times in the gastrocnemius muscles and VO2peak. A significant positive association was found between MNSI physical exam score and SOL T2.
Significant associations (p<0.05) between preintervention and postintervention percentage based changes in MRI and clinical variables
Discussion
Recently modified therapeutic recommendations for individuals with DPN include physical exercise to improve muscle and nerve function.39 The early results from the combined resistance and aerobic exercise training intervention in this study show promise for improving skeletal muscle composition in individuals with DPN. The major findings are reductions in skeletal muscle adipose tissue and relaxation times in response to short-term exercise training.
No signficant difference in intramuscular fat fraction was observed after intervention in individual calf muscles. However, we observed a reduction in fat fraction in the global interior region of the leg. Improvement in muscle composition is important because DPN is associated with severely reduced muscle mass and increased interstitial fat and intramuscular fat. These skeletal muscle deficits are associated with loss of muscle strength, power and endurance as well as reduced physical function and ability to complete daily activities.
Relaxation times represent a range of muscle properties that reflect macromolecule makeup including proteins and membranes. Prior studies showed prolonged T2 and T1ρ in myositis, Duchenne muscular dystrophy, and DPN.24–28 Meanwhile T1 may also be prolonged in myopathic dermatomyositis.22 The reduced relaxation times observed in this study following exercise intervention suggest a reduction of pathologic conditions in the muscle. We found the greatest T1 and T1ρ reduction in GM, while GL and SOL showed less change. This finding could be related to increased GM recruitment during calf exercises prescribed in the intervention of compared with GL and SOL. Interestingly, diabetic myopathy is more likely to be associated with GM deterioration than other calf muscles.40 While it has been suggested that skeletal muscle relaxation times may be entangled with adiposity, we found insignificant change in fat infiltration in GM, GL, and SOL. Thus, reduced relaxation times are more likely to represent atrophy reversal and muscle remodeling than adipose reduction, consistent with the finding of unchanged intramuscular fat within the calf muscles.
The lack of change in ADC, FA, and PCr recovery time constant indicates that TN microstructure and muscle energetics did not change to the extent necessary for detection with MRI. The potential disconnect between muscle composition and nerve remodeling and metabolic function suggests that more research is needed to explore whether exercise dosage or type can be modified to drive a response, to potentially determine the point at which nerve damage or metabolic dysfunction cannot be reversed in DPN, and whether DTI and 31P-MRI are sensitive enough to track therapy response. While the phosphocreatine recovery time constant following brief exercise directly probes muscle oxidative capacity, which cannot currently be accessed with proton MRI, the experiment is susceptibile to patient compliance. In our experience, some patients had difficulty following the pedal flexion acoustic cue due to competing noise from MRI gradient switching and were separately predisposed to performing inadequate or inconsistent flexion required for phosphocreatine depeletion. Other aspects such as epigenomic factors41 and medication use42 43 have been found to impact exercise response and also deserve further consideration. In parallel, the lack of change in MNSI, VO2peak, and blood markers related to diabetic risk may be related to participants’ relatively mild neuropathy and low baseline HbA1c, leaving little room for improvement.
One of the strengths of this study is the use of quantitative MRI. The Dixon-based method quantifies fat fraction with robustness against magnetic field heterogeneity, which can confound methods that, for example, rely on pixel intensity thresholds to distinguish between fat and muscle in a binary manner. Magnetic resonance fingerprinting is similarly robust against system imperfections and allows simultaneous quantitative T1, T1ρ, and T2 mapping that do not require subjective interpretation typical of ‘contrast-weighted’ images. Together, the techniques provide the means to monitor important diabetic markers during treatment.
One of the study limitations is lack of a control cohort, which makes it unclear whether the effects of exercise would be observed in matched BMI individuals without DPN. Indeed, weight and adipose reduction has been reported in overweight and obese individuals with T2DM, but without neuropathy, following 1-year diet and exercise intervention.44 Others have shown promising improvements in pain interference, vascular health, and neuropathic symptoms in individuals with DPN following 16-week20 45 and 12-week exercise interventions.46 While there is no consensus on an optimal exercise regimen,47 our study suggests that adipose infiltration and muscle composition improve within 10 weeks. We acknowledge that the small sample size is a limitation and point out that multiple comparison corrections were not performed, which increase the possibility of false correlations between changes in MRI and clinical measurements (table 3). Another consideration concerning associations in table 3 is that MRI measurements are localized, whereas VO2peak and HbA1c are global fitness metrics. Nonetheless, these exploratory associations merit further study.
An additional potential limitation is the heterogeneous nature of the cohort in which MNSI physical exam scores ranged from 1 to 7. A natural extension of this work will be to relate change in clinical measures such as muscle strength to MRI measurements in a randomized controlled trial with a larger cohort of BMI-matched individuals with a range of DPN severity. A final limitation is that dietary factors were not tracked, which could contribute to posintervention changes detected with MRI.
Conclusion
Individuals with long-standing diabetes are at high risk for wide-ranging musculoskeletal complications such as pain, plantar ulcers, Charcot arthropathy, and amputations. Effective interventions are essential to reverse musculoskeletal complications in DPN, while quantitative markers are needed to monitor patient response. Others have shown that supervised exercise intervention improves glycemic control, reduces inflammation, and improves muscle strength and quality in type 2 diabetes. The results in this work used quantitative MRI to show that supervised exercise intervention reduced adiposity and relaxation times in the leg muscles in individuals with DPN. The results of a larger cohort may allow further assessment of improvements in muscle composition and potential associations between local MRI measurements and global measures of fitness, while interventions can be extended beyond the 10-week period tested here in attempt to instigate mitochondrial and nerve adaptations.
Data availability statement
Data are available upon reasonable request. The datasets generated during and/or analyzed during the current study are available from the corresponding author upon reasonable request.
Data availability statement
The datasets generated during and/or analyzed during the current study are available from the corresponding author on reasonable request. No applicable resources were generated or analyzed during the current study. The datasets generated during and/or analyzed during the current study are available from the corresponding author upon reasonable request.
Ethics statements
Patient consent for publication
Acknowledgments
The authors acknowledge Oleksandr Khegai for software development and study coordinators Amanda Ho, Shannon Haas, Elizabeth Yakubova, Magdalena Palac, Katherine Medina, Simone Rainey, Charles Morton, and Liz Calderon for recruiting participants, performing MNSI tests, collecting blood samples, carrying out exercise intervention procedures, and performing statistical analyses, and Aaron R Chidakel for supervising participant safety.
References
Supplementary materials
Supplementary Data
This web only file has been produced by the BMJ Publishing Group from an electronic file supplied by the author(s) and has not been edited for content.
Footnotes
Contributors PP and SR conceptualized the study. AS, ND, SB, SR, and RB curated and analyzed the data. PP, SR, RRR, and RB acquired financial support for the project. AS, SR, HM, and RB conducted the experiments. PP, JMS, AS, SB, RRR, and RB designed the MRI protocol. SR and PMK designed the 10-week intervention program. SR and RB administered and supervised the study. AC and KJM assisted with patient recruitment. AS, SB, PP, RRR, and RB developed MRI software. All authors wrote and edited the manuscript. RB is the guarantor of this work and, as such, had full access to all the data in the study and takes responsibility for the integrity of the data and the accuracy of the data analysis.
Funding This work was supported in part by NIH grants R01 DK114428, R01 AR068966, R01 DK106292, R01 AR076985, and T35 DK007421, and was performed under the rubric of the Center for Advanced Imaging Innovation and Research (CAI2R, www.cai2r.net), a NIBIB Biomedical Technology Resource Center (NIH P41 EB017183).
Competing interests The authors declare that they have no competing interests. PP is currently employed by Regeneron Pharmaceuticals, Inc and declares no conflict of interest regarding the content of this manuscript.
Ethical approval The study was conducted in accordance with Good Clinical Research Practice guidelines and the Declaration of Helsinki, was approved by New York University Langone Health’s Institutional Review Board (#18–00527), and all subjects provided informed written consent.
Provenance and peer review Not commissioned; externally peer reviewed.
Supplemental material This content has been supplied by the author(s). It has not been vetted by BMJ Publishing Group Limited (BMJ) and may not have been peer-reviewed. Any opinions or recommendations discussed are solely those of the author(s) and are not endorsed by BMJ. BMJ disclaims all liability and responsibility arising from any reliance placed on the content. Where the content includes any translated material, BMJ does not warrant the accuracy and reliability of the translations (including but not limited to local regulations, clinical guidelines, terminology, drug names and drug dosages), and is not responsible for any error and/or omissions arising from translation and adaptation or otherwise.