Article Text

Abstract
Introduction Propionic acid (PA) is a common food preservative generally recognized as safe by the US Food and Drug Administration; however, exogenous PA has effects on glucose metabolism that are not fully understood. Our preclinical studies demonstrated exogenous PA increases glucagon, norepinephrine, and endogenous glucose production (EGP).
Research design and methods We performed a randomized, placebo-controlled, crossover study in 28 healthy men and women to determine the effect of PA (1500 mg calcium propionate) on these factors. Subjects had two study visits, each preceded by a 1 week, PA-free diet. During each visit, glucose, insulin, glucagon, norepinephrine, epinephrine, and EGP were assessed for 2 hours after oral administration of PA/placebo under resting conditions (protocol 1) and during either a euglycemic (~85–90 mg/dL) or hypoglycemic (~65–70 mg/dL) hyperinsulinemic clamp (protocol 2).
Results PA, as compared with placebo, significantly increased: (1) glucagon and norepinephrine during protocol 1; (2) glucagon, norepinephrine, and epinephrine under euglycemic conditions in protocol 2; and (3) norepinephrine, epinephrine, and EGP under hypoglycemic conditions in protocol 2.
Conclusion Oral consumption of PA leads to inappropriate activation of the insulin counterregulatory hormonal network. This inappropriate stimulation highlights PA as a potential metabolic disruptor.
- endogenous glucose production
- glucagon
- catecholamines
- food safety
Data availability statement
Deidentified data that support the findings of this study are available on reasonable request to corresponding author.
This is an open access article distributed in accordance with the Creative Commons Attribution Non Commercial (CC BY-NC 4.0) license, which permits others to distribute, remix, adapt, build upon this work non-commercially, and license their derivative works on different terms, provided the original work is properly cited, appropriate credit is given, any changes made indicated, and the use is non-commercial. See: http://creativecommons.org/licenses/by-nc/4.0/.
Statistics from Altmetric.com
Significance of this study
What is already known about this subject?
The use of propionic acid (PA) as a food preservative has rapidly increased over the past few decades.
PA was suggested to act as a metabolic disruptor, increasing insulin counterregulatory hormones in mice.
A pilot study in humans suggested that consumption of PA with a meal increases glucagon, norepinephrine, and insulin resistance.
What are the new findings?
Consuming propionic acid, as compared with placebo, increases glucagon and norepinephrine under resting, fasting conditions and increases glucagon, norepinephrine and epinephrine during euglycemic hyperinsulinemic clamp conditions.
Consuming propionic acid, as compared with placebo, increases norepinephrine, epinephrine and endogenous glucose production during hypoglycemic hyperinsulinemic clamp conditions.
Thus, propionic acid, when consumed orally in humans activates the insulin-counterregulatory hormonal network.
How might these results change the focus of research or clinical practice?
PA, a common food preservative, activates the insulin counterregulatory hormonal network and is thus a potential metabolic disruptor in humans.
This highlights the need for careful assessment of the long-term metabolic effects of this widely used ‘Generally Recognized As Safe’ food preservative.
Introduction
Obesity and type 2 diabetes mellitus (T2DM) are serious health problems that are influenced significantly by environmental factors such as diet.1 Over the past 30 years, there has been a marked increase in the prevalence of obesity in the USA (from 22% to 40% of adults between 1988 and 2016). By 2016, 72% of US adults were overweight or obese and 16% had diabetes.2 These rapid increases in obesity and diabetes are likely driven by environmental factors, not genetic drift. The increasing use of processed and ultra-processed foods in modern nutrition involves the utilization of several chemicals in the processing, preservation, and packaging of foods. Some of these chemicals have been suspected to exert adverse metabolic health effects, but there is an absence of studies evaluating these effects.1 The use of food preservatives, such as propionic acid (PA), has also increased substantially in recent decades.3 PA is a naturally occurring short-chain fatty acid that is commonly used as an antimicrobial agent in packaged foods such as bread and cheese. It is ‘generally recognized as safe’ by the FDA and is widely used in food with no limitation other than current good manufacturing practice.4 The metabolic consequences of consuming PA are not fully understood in humans.5
PA increases hepatic pyruvate cycling through its conversion into succinate, thus increasing gluconeogenesis.6 7 As early as 1912, it was noted that administration of PA to dogs increased glucose levels by more than could be accounted for by gluconeogenic conversion of PA alone.8 9 Later studies similarly demonstrated PA as a potent stimulator of endogenous glucose production (EGP) in various mammals.6 7 10 Given this unique property of PA, it is widely used in feeds for dairy cows and sheep to increase glucose concentration in milk.11 More recently, it became apparent that direct conversion of propionate to glucose accounts for only 5% of the total increase in PA-induced increase in glucose production, with the remainder attributed to activation of pyruvate carboxylase by mechanisms that remain elusive.7 Data regarding the effects of propionate as a food preservative in humans are limited. In healthy human subjects, consumption of bread supplemented with PA resulted in mild postprandial hyperinsulinemia at 60 min and attenuated suppression of postmeal FFA, which is suggestive of increased adipose tissue insulin resistance as expected with increased catecholamine concentration.12 Preclinical studies in mice by us and others suggested that acute administration of PA induced a marked glycogenolysis. Along with increasing glucose production and insulin secretion, PA administration stimulated the release of glucagon, fatty acid binding protein 4 (FABP4), and norepinephrine, which likely mediated the hyperglycemic effects of PA.13–16 Furthermore, chronic oral administration of PA for 20 weeks in mice resulted in gradual weight gain, insulin resistance, increased fat mass, and increased EGP relative to placebo.16
In our pilot, randomized, placebo-controlled, crossover study involving 14 participants, consumption of a mixed meal containing a low dose of PA (1 g of calcium propionate) led to significant postprandial increases in glucagon, norepinephrine, FABP4, and insulin resistance (assessed by Matsuda Index17) as compared with a control meal.16 These results raise the possibility that PA in food could contribute to impaired metabolic function in humans. However, this was a small study, and the impact of PA on EGP was not studied.
Therefore, the goal of the current study was to determine the effect of low dose PA, as compared with placebo, on glucagon, norepinephrine, epinephrine, and EGP under basal conditions and in the presence of hyperinsulinemic euglycemic and hypoglycemic clamps in healthy individuals. We performed both euglycemic and mildly hypoglycemic hyperinsulinemic clamps; hypoglycemia is a known stimulator of insulin counterregulatory hormones and could potentially amplify the effects of PA on these outcomes.
Materials and methods
Study design
We conducted a double-blind, randomized, placebo-controlled, crossover, mechanistic study at the Brigham and Women’s Hospital Center for Clinical Investigation (Boston, Massachusetts, USA).
Participants
Healthy men and women, aged 18–55 years with body mass index 20–35 kg/m2 were recruited using online postings and physical flyers. Eligible participants provided written informed consent during a screening visit, which included a complete medical history, physical examination, blood analysis (complete blood count, lipid panel, thyroid-stimulating hormone (TSH), complete metabolic panel), urine pregnancy test (if applicable), and ECG. Exclusion criteria included any acute or chronic illness, current or ongoing use of prescription medications, systolic blood pressure >140 mm Hg or diastolic blood pressure >90 mm Hg, abnormal ECG, pregnancy or breast feeding, history of current smoking, alcohol or drug abuse, and abnormal laboratory values (estimated glomerular filtration rate <45 mL/min, impaired hepatic function (aspartate amino transaminase and/or alanine amino transaminase >2.0×upper limit of normal range), hematocrit <36% for females and <41% for males, and abnormal TSH). Sample size was determined using a power calculation described below under ‘Statistics’ section.
Center for Clinical Investigation study visits
Each participant completed two study visits (oral PA administration visit and oral placebo administration visit, in random order) with a minimum of a 7-day between visits wash-out period (figure 1A). Prior to each visit, participants were provided with a PA-free diet for 7 days prepared by the BWH Center for Clinical Investigation (CCI) Nutrition Core. Participants, study staff, and nursing staff were blinded to drug treatment. Participants were randomized with equal probability to one of two sequence groups (PA then placebo, or placebo then PA) using a permutated block method. Randomization was done by the Brigham and Women’s Hospital Investigational Drug Service using the website randomization.com. The research pharmacists did not have contact with study participants and did not communicate with study staff regarding assigned treatments. Study staff were blinded to assigned treatments until after the last participant completed study procedures.
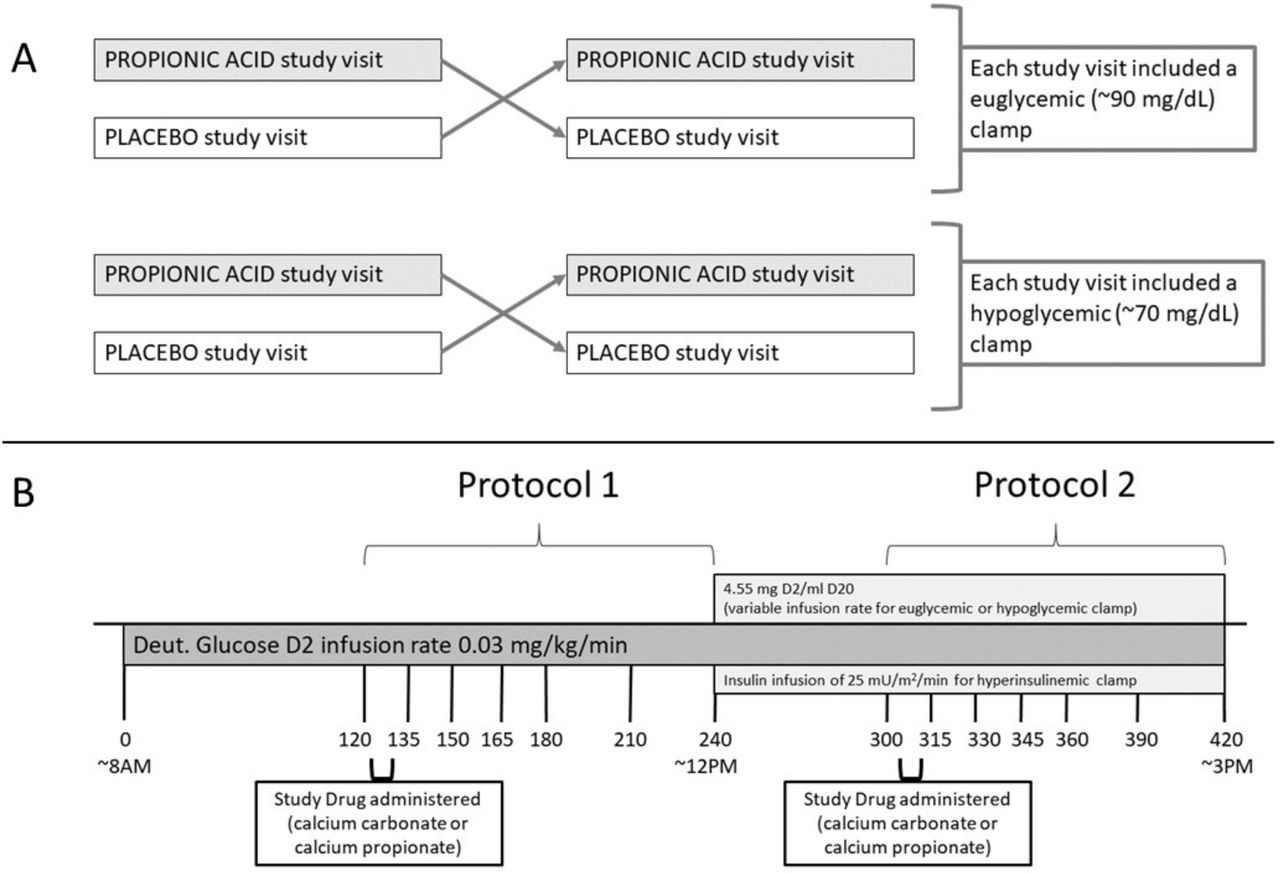
(A) Overview of study protocol. (B) Study visit timeline.
Participants arrived at the CCI for each study visit (figure 1B) at 07:00 hours after fasting for at least 8 hours overnight, having consumed a PA-free diet for 7 days, and having abstained from caffeine for 24 hours. Vital signs were measured, and urine pregnancy testing was done (if applicable) on arrival. An intravenous line was placed in a hand or wrist and then the hand was placed in a heated (66°C (150°F)) acrylic ‘Hot Box’ to facilitate frequent blood draws throughout the procedure. A second, antecubital intravenous line was placed to be used for infusions of deuterated glucose, dextrose, and insulin. Blood was drawn (T=−10 min) and an infusion of deuterated glucose (0.03 mg/kg/min [6,6-2H2] glucose, Cambridge Isotope Laboratories, Andover, Massachusetts, USA) was then initiated at approximately 08:00 hours (T=0 min) and continued throughout the 7-hour study.
Protocol 1
Participants received their first dose of either four 500 mg calcium propionate capsules (796 mg PA) (Niacet, Niagara Falls, New York, USA) or four 269 mg calcium carbonate capsules (Roxane Laboratories/Hikma Pharmaceuticals, Columbus, Ohio, USA) orally over the course of 15 min starting 2 hours after deuterated glucose infusion was initiated (T=120 min). Both treatments contained the same mass of calcium. After the first five subjects, the dose was decreased by 25% from four to three 500 mg calcium propionate capsules (597 mg PA) or three 269 mg calcium carbonate capsules, and the first pill of each administration was given with 4 oz sugar-free jell-O to reduce incidence of nausea. PA is typically found in processed food at a concentration of 0.15–0.30% w/w.12 At this concentration, 270–530 g of PA-containing foods (eg, cheese sandwich) contains an equivalent mass of PA to what was administered in this protocol.
Blood samples for measurement of glucose, insulin, glucagon, plasma catecholamines, and enrichment of deuterated glucose were drawn periodically (see study visit timeline, figure 1B). Blood draws at T=−10 and 120 min were used for calculating baseline EGP.
Protocol 2
Four hours after initiation of deuterated glucose infusion and 2 hours after administration of the first dose of PA/placebo, a 2-hour hyperinsulinemic clamp was initiated at T=240 min (figure 1B). Insulin (Humulin R, Lilly USA, Indianapolis, Indiana, USA or Novolin R, Novo Nordisk, Plainsboro, New Jersey, USA) was infused at 100 mU/m2/min for 5 min and 50 mU/m2/min for 5 min (priming doses) followed by an infusion of 25 mU/m2/min. Twenty per cent dextrose infusion containing 0.455% deuterated glucose was infused at a variable rate in order to achieve the desired blood glucose targets.18 Blood glucose was measured every 5 min using a Hemocue (HemoCue, Angelholm, Sweden) and/or YSI bedside glucose analyzer (YSI 2300 STAT Plus Glucose & Lactate Analyzer; YSI, Yellow Springs, Ohio, USA). A second dose of calcium carbonate or calcium propionate was administered 1 hour into the hyperinsulinemic clamp (T=300 min). Participants underwent either euglycemic (85–90 mg/dL) or hypoglycemic (65–70 mg/dL) hyperinsulinemic clamp at both study visits. Hyperinsulinemic clamps were terminated 3 hours after initiation (T=420 min).
Blood samples for measurement of glucose, insulin, glucagon, plasma catecholamines, and enrichment of deuterated glucose were obtained prior to administration of the second PA/placebo dose (T=300 min) and then at T=315, 330, 345, 360, 390, and 420 min (see study visit timeline, figure 1B).
Laboratory analysis
Assays for blood analytes were performed at the LabCorp laboratories using validated assays used for clinical care of patients. LabCorp used the highly specific and sensitive Millipore assay19 to measure glucagon for our samples. Glucose data reported in graphs and tables were obtained from blood collected in tubes containing sodium fluoride and potassium oxalate and analyzed for glucose at LabCorp or using YSI. Deuterated glucose enrichment was measured by gas chromatography mass spectrometry method as previously published.18 20
Calculations
The rates of glucose turnover were estimated, as previously described.21 Total rate of appearance of glucose is calculated using a single-compartment model of glucose kinetics (Steele) using non-steady state calculations that have been used by us and others in the field.22 EGP is calculated by subtracting the glucose infusion rate from the rate of glucose appearance.
Statistics
Variables were reported as mean±SD or least square means±SEs. Mixed model linear regression analyses with repeated measurement were used to analyze the data for an effect of PA versus placebo, within and between subjects over time. Model is adjusted for sex, age, and BMI as fixed effects, as well as baseline and average glucose levels when relevant. The effect of each subject is included in the model as a random factor. Student’s t-test and Wilcoxon test were used for comparing individual time points. The study was powered at 80% for a mean EGP of 2.5±1 mg/kg/min with a mean and SD of the PA versus placebo difference expected to be 0.5±0.8. Hypotheses were tested at the level of α=0.05. All statistical analyses were performed using JMP (JMP, V.14; SAS Institute, Cary, North Carolina, USA, 1989–2020).
Results
Participant flow and demographics
Twenty-eight individuals completed the study (see consort diagram, online supplemental figure 1). One participant was excluded due to protocol non-compliance. One participant did not have EGP data collected. Therefore, data for 27 individuals (26 for EGP) are reported in the analysis for protocol 1. Of the 27 individuals included in our analysis, 15 were women and 12 were men. The mean age was 30±9 years, and the mean BMI was 26.7±3.8 kg/m2 (see table 1, which displays demographics and baseline characteristics obtained at the screening visit).
Supplemental material
Demographics and baseline characteristics
Twenty-four individuals are included in the analysis for protocol 2 (23 with EGP data), 12 of whom had euglycemic clamps (11 for EGP) at both study visits, and 12 of whom had hypoglycemic clamps at both study visits. Three individuals had a euglycemic clamp at one visit and a hypoglycemic clamp at the other, so they were not included in the protocol 2 analysis.
Effect of propionic acid in protocol 1
Protocol 1 baseline blood samples, obtained 120 min after start of deuterated glucose infusion and prior to administration of PA or placebo, revealed similar levels between PA and placebo treatment days for glucose, insulin, glucagon, norepinephrine, epinephrine, and EGP (table 1). The effect of consuming PA versus placebo on our end points from T=135 to T=240 min was investigated using a mixed model analysis controlling for sex, BMI, age, time, and baseline values at T=120.
PA ingestion significantly increased glucagon as compared with placebo with post hoc analysis revealing significant increases at T=180 and at T=210 (figure 2). PA ingestion also significantly increased norepinephrine relative to placebo treatment (figure 2) with post hoc analysis revealing a significant increase in norepinephrine levels with PA relative to placebo at T=150 (figure 2). There was no significant effect observed of PA on glucose, insulin, epinephrine, or EGP relative to placebo (figure 2).

Effects of propionic acid (PA) vs. placebo on glucose (A), insulin (B), glucagon (C), norepinephrine (D), epinephrine (E), and endogenous glucose production (EGP) (F) during protocol 1. Mixed model analyses controlling for sex, BMI, age, time, and baseline value at T=120 minutes revealed: a significant effect of PA vs placebo on glucagon and norepinephrine and no significant effect of PA vs placebo on glucose, insulin, epinephrine, or EGP. Data reported as least squares means ± least squares standard error. Post-hoc, pairwise Wilcoxon test was used to compare responses with PA vs placebo at individual timepoints. *p<0.05, **p<0.01. N=27 for panels A–E, N=26 for panel F. Gray bar indicates time of PA or placebo consumption.
Initiation of hyperinsulinemic clamp
There was no residual effect of treatment at T=120 min with PA or placebo on any of the variables at T=240 min (figure 2). Hyperinsulinemic clamps were initiated at T=240 min. Glucose was infused achieving a target of 85–90 mg/dL in 12 participants and 65–70 mg/dL in 12 participants. Table 2 shows least squares means data at the clamp start (T=240 min) and 60 min later (T=300 min) generated by mixed model analysis performed separately for euglycemic and hypoglycemic clamps. Infusion of insulin for 60 min significantly decreased EGP during both the euglycemic and hypoglycemic clamps, and decreased glucagon during euglycemic, but not hypoglycemic, clamp. Norepinephrine and epinephrine were significantly different between T=240 (preclamp) and T=300 min (clamp at 60 min) for hypoglycemic clamp under placebo conditions only.
Parameters at start and after 60 min of euglycemic and hypoglycemic clamps: before administering respective drugs during protocol 2
Effect of PA versus placebo in protocol 2
PA or placebo was administered over 15 min starting at T=300 min, which is 60 min after initiation of the 3-hour clamp protocol. Outcome data were then collected every 15–30 min over the following 2 hours. Data were analyzed using mixed model analysis to determine if there was an effect of PA versus placebo on our outcomes during either a euglycemic or hypoglycemic clamp.
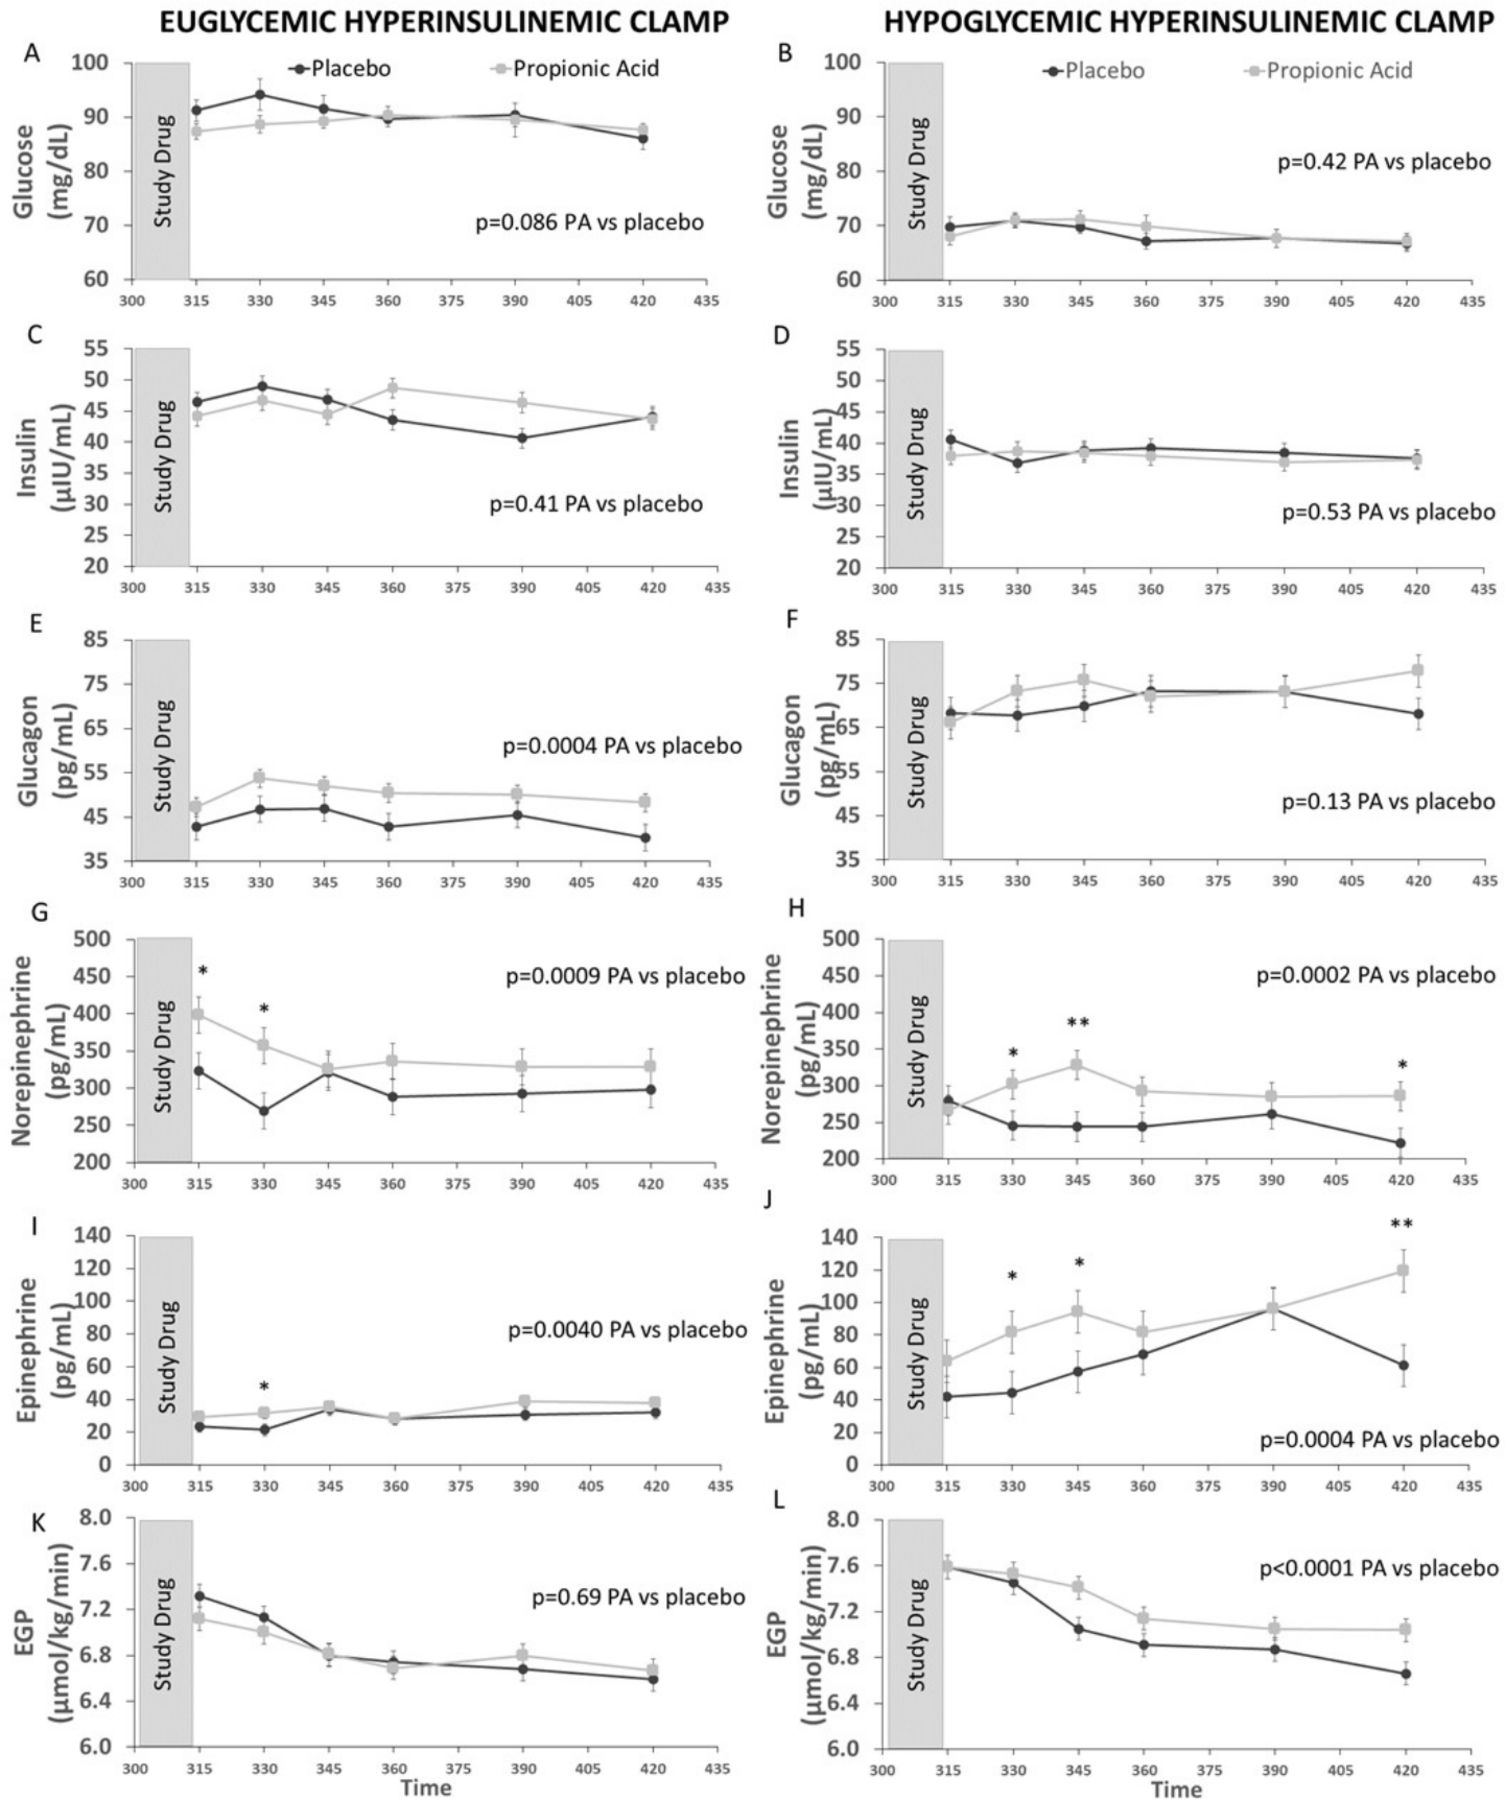
Glucose (figure 3A,B) and insulin (figure 3C,D) were similar in individuals receiving PA versus placebo under both euglycemic and hypoglycemic conditions, indicating consistency of the experimental conditions. Under euglycemic conditions, PA as compared with placebo significantly increased glucagon (figure 3E), norepinephrine (figure 3G), and epinephrine (figure 3I), with no significant effect on EGP (figure 3K). Under hypoglycemic conditions, PA as compared with placebo again significantly increased norepinephrine (figure 3H) and epinephrine (figure 3J). Of note, glucagon levels, were significantly elevated (by ~50%) following induction of hypoglycemia compared with the euglycemic conditions (figure 3E,F), but the further rise in glucagon levels following PA consumption did not statistically differ from placebo (figure 3F). Furthermore, under hypoglycemic conditions, consumption of PA increased EGP as compared with placebo (figure 3L).
Effects of propionic acid (PA) vs placebo on glucose (A and B), insulin (C and D), glucagon (E and F), norepinephrine (G and H), epinephrine (I and J), and endogenous glucose production (EGP) (K and L) during euglycemic (left panels) and hypoglycemic (right panels) hyperinsulinemic clamp studies. During euglycemic clamp, PA as compared with placebo significantly increased glucagon, norepinephrine, and epinephrine but had no significant effect on EGP. During hypoglycemic clamp, PA as compared to placebo increased norepinephrine, epinephrine, and EGP, but had no significant effect on glucagon. Glucose is reported as observed means ± standard deviation and the mixed model analysis controls for time to determine the effect of PA vs placebo. Insulin, glucagon, norepinephrine, epinephrine, and EGP are reported as least squares means ± least squares standard error, and the mixed model analysis controls for sex, BMI, age, time, average blood glucose, and baseline value at T=300 minutes to determine the effect of PA vs placebo. Post-hoc, pairwise Wilcoxon test was used to compare responses between PA and placebo at individual timepoints. *p<0.05, **p<0.01. N=12 for panels A–J and L, N=11 for panel K. Gray bar indicates time of PA or placebo consumption.
Discussion
This placebo-controlled, crossover study evaluates the acute effects of PA versus placebo on glucagon, norepinephrine, epinephrine, and EGP under three conditions: fasted resting conditions, euglycemic hyperinsulinemic clamp, and hypoglycemic hyperinsulinemic clamp. Under euglycemic conditions in the presence or absence of infused insulin, consumption of PA as compared with placebo leads to an activation of a significant insulin counterregulatory response, namely an increase in glucagon, norepinephrine, and epinephrine. Under mild hypoglycemic conditions in the presence of infused insulin, when glucagon levels were already elevated, PA consumption, as compared with placebo, further increased catecholamine levels with a subsequent rise in EGP. Thus, PA consumption provokes an inappropriate stimulation of the insulin counterregulatory network under euglycemic conditions, and an exaggerated response under mild hypoglycemic conditions, leading to reduced hepatic insulin sensitivity (ie, increased EGP).
The current findings that PA increases glucagon and norepinephrine are consistent with our prior preclinical studies demonstrating acute effects of PA on glucagon and norepinephrine and our studies in humans showing that consumption of PA in a mixed meal increases glucagon and norepinephrine.16 In this study, we extended these published results to show that PA increases epinephrine under conditions of euglycemic and hypoglycemic hyperinsulinemia. With mild hypoglycemia, PA increased EGP, likely secondary to PA-induced increases in norepinephrine and epinephrine.23 The ability of PA to reduce hepatic insulin sensitivity (ie, blunt the insulin-induced decrease in EGP) under mildly hypoglycemic conditions is consistent with our preclinical data that PA consumption reduces insulin sensitivity.16
PA consumption resulted in a significant increase in insulin counterregulatory hormones under fasting euglycemic conditions, although EGP was not significantly different than placebo. There could be several reasons for our inability to observe a change in EGP under these conditions. First, in this study, healthy individuals were enrolled. Potentially, studying individuals with obesity or impaired insulin sensitivity could allow for detection of an effect of PA on EGP under euglycemic conditions. Second, it is possible that by studying individuals under fasting conditions, there was insufficient glycogen to produce significant glucose via glycogenolysis.24 Indeed, the hyperglycemic response induced by PA in various mouse models was attributed to marked glycogenolysis and was significantly attenuated in the fasting conditions.16 Third, the increases in glucagon, norepinephrine, and epinephrine were mild, and had relatively minimal effects on EGP. Yet, human exposure to oral PA is in the context of prandial conditions, usually with the consumption of processed food-based meal. In this setting, the expected postmeal inhibition of EGP and the increase in glycogen synthesis may be disrupted by an inappropriate PA-induced increase in glucagon and catecholamines. However, further studies will be needed to confirm these effects.
The observed effect of PA versus placebo on norepinephrine precedes that on glucagon by 30 min. This timing is consistent with preclinical studies demonstrating that blocking norepinephrine release with hexamethonium, an inhibitor of sympathetic nervous system activation, blunts the effect of PA on glucagon, suggesting that sympathetic activation is upstream to the effect of PA on glucagon.16 Indeed, PA has been demonstrated to directly regulate norepinephrine release by sympathetic neurons via activation of G-Protein Receptor 41.5 9
Hypoglycemia is a known stimulator of glucagon and catecholamines.25 In our studies, glucagon levels were increased with hypoglycemia relative to euglycemia prior to the second administration of PA or placebo. Under these conditions of higher glucagon levels during the hypoglycemic clamp, the further increase in epinephrine is robust, increasing by ~twofold with PA as compared with placebo and ~fourfold over the levels observed in the euglycemic clamp (figure 3). So, if we were to estimate the cumulative ‘EGP driving force’, it is significantly higher in the hypoglycemic clamp conditions, which is likely the driving force for why we observed an increase in EGP with PA versus placebo under hypoglycemic conditions. Mild hypoglycemia was able to uncover the disrupting effects of PA that were not otherwise revealed. Thus, in the setting of processed foods-based diet, exposure to exogenous PA may lead to metabolically inappropriate activation of the integrated insulin counterregulatory hormonal network.
The chronic effects of repeated exposure to PA are uncertain in humans but could contribute to insulin resistance, impaired glycemic control, and gradual weight gain. This study reveals statistically significant effects of acute PA administration on the insulin counterregulatory network that, although small in magnitude, suggest that further research into the chronic effects of this food preservative in humans is warranted. Chronic hyperinsulinemia and insulin resistance may be the cause, and not only the consequence, of weight gain and obesity.26 Inappropriate sympathetic nervous system activation and increases in counterregulatory hormones may be particularly important for patients with diabetes since reduced suppression of EGP in the postprandial state is a concern in diabetes.27 Furthermore, inappropriate changes in glucagon and catecholamines could have adverse effects other than those relating to glucose metabolism. The hormone perturbations we observed in this physiological study with acute oral administration of PA highlight the need for further investigation into the chronic effects of this common food preservative.
There are potential limitations to this study. First, the study included a PA-free diet prior to each study visit, but some participants may not have complied, thus beginning the study procedures with PA already in their system. Their blood PA levels were not measured. Second, while all participants fasted for at least 8 hours, it is possible that some fasted for much longer and this affected their ability to regulate EGP. Third, the EGP calculation assumes a blood glucose steady state, but it is possible that administration of PA disrupts this steady state. Fourth, we assessed the impact of PA versus placebo under mildly hypoglycemic conditions; it is possible that the depth of hypoglycemia could impact our outcomes. Fifth, this healthy population included a wide range of BMIs, which could have introduced some metabolic heterogeneity and obscured treatment effects. Sixth, we did not collect data on the menstrual cycle, and this could have influenced some outcomes. Seventh, it is possible that performing protocols 1 and 2 sequentially on the same day could have blunted our ability to detect the full effects of PA on glucose metabolism. Lastly, this study had a small sample size, so more significant differences and correlations may have been uncovered with a larger sample size.
In conclusion, consumption of PA as compared with placebo leads to an activation of the insulin counterregulatory response, that is, increases in glucagon, norepinephrine, and epinephrine, and in the presence of mild hypoglycemia this is sufficient to increase EGP. The amount of PA administered in this study is similar to what is commonly consumed in processed foods. Future studies are needed to determine whether chronic consumption of processed foods with PA could have long-term, adverse metabolic effects.
Data availability statement
Deidentified data that support the findings of this study are available on reasonable request to corresponding author.
Ethics statements
Ethics approval
The study protocol was approved by the Partners (now Mass General Brigham) Institutional Review Board. All participants provided written informed consent.
Acknowledgments
We greatly appreciate the contributions of the nursing and support staff in the Brigham and Women’s Hospital Center for Clinical Investigation.
References
Supplementary materials
Supplementary Data
This web only file has been produced by the BMJ Publishing Group from an electronic file supplied by the author(s) and has not been edited for content.
Footnotes
RG and AT contributed equally.
Contributors AT and RG designed the study. RG and GKA conducted the study. RB and YY analyzed the flux data. SB and GM recruited participants, coordinated study visits and conducted data entry. ESH coordinated data management and analysis and drafted the manuscript with support from GKA. MH performed the statistical analysis. AT, RG, RB and GKA performed data interpretation and wrote the manuscript. GKA is the guarantor of this work.
Funding This work was primarily supported by American Diabetes Association grant #1-16-ICTS-113 (AT). The investigators were additionally supported by National Institutes of Health grants DK-029953 (RB) and K24-HL103845 (GKA). Additionally, the project described was supported by grant numbers 1UL1TR001102 and 1UL1TR002541-01, Harvard Clinical and Translational Science Center, from the National Center for Advancing Translational Science.
Disclaimer The content is solely the responsibility of the authors and does not necessarily represent the official views of the National Center for Research Resources, the National Center for Advancing Translational Science or the National Institutes of Health.
Competing interests None declared.
Provenance and peer review Not commissioned; externally peer reviewed.
Supplemental material This content has been supplied by the author(s). It has not been vetted by BMJ Publishing Group Limited (BMJ) and may not have been peer-reviewed. Any opinions or recommendations discussed are solely those of the author(s) and are not endorsed by BMJ. BMJ disclaims all liability and responsibility arising from any reliance placed on the content. Where the content includes any translated material, BMJ does not warrant the accuracy and reliability of the translations (including but not limited to local regulations, clinical guidelines, terminology, drug names and drug dosages), and is not responsible for any error and/or omissions arising from translation and adaptation or otherwise.