Article Text

Abstract
Introduction Meal composition is known to affect glycemic variability and glucose control in type 1 diabetes. The objective of this work was to evaluate the effect of high carbohydrate meals of different nutritional composition and alcohol on the postprandial glucose response in patients with type 1 diabetes.
Research design and methods Twelve participants were recruited to this randomized crossover trial. Following a 4-week run-in period, participants received a mixed meal on three occasions with the same carbohydrate content but different macronutrient composition: high protein-high fat with alcohol (0.7g/kg body weight, beer), high protein-high fat without alcohol, and low protein-low fat without alcohol at 2-week intervals. Plasma and interstitial glucose, insulin, glucagon, growth hormone, cortisol, alcohol, free fatty acids, lactate, and pH concentrations were measured during 6 hours. A statistical analysis was then carried out to determine significant differences between studies.
Results Significantly higher late postprandial glucose was observed in studies with higher content of fats and proteins (p=0.0088). This was associated with lower time in hypoglycemia as compared with the low protein and fat study (p=0.0179), at least partially due to greater glucagon concentration in the same period (p=0.04). Alcohol significantly increased lactate, decreased pH and growth hormone, and maintained free fatty acids suppressed during the late postprandial phase (p<0.001), without significant changes in plasma glucose.
Conclusions Our data suggest that the addition of proteins and fats to carbohydrates increases late postprandial blood glucose. Moreover, alcohol consumption together with a mixed meal has relevant metabolic effects without any increase in the risk of hypoglycemia, at least 6 hours postprandially.
Trial registration number NCT03320993.
- diabetes mellitus
- type 1
- blood glucose
- alcohol drinking
Data availability statement
Data are available upon reasonable request. The data are available on request from the corresponding author. Paolo Rossetti (prossetti73@gmail.com).
This is an open access article distributed in accordance with the Creative Commons Attribution Non Commercial (CC BY-NC 4.0) license, which permits others to distribute, remix, adapt, build upon this work non-commercially, and license their derivative works on different terms, provided the original work is properly cited, appropriate credit is given, any changes made indicated, and the use is non-commercial. See: http://creativecommons.org/licenses/by-nc/4.0/.
Statistics from Altmetric.com
Significance of this study
What is already known about this subject?
In subjects with type 1 diabetes, increasing the protein or the protein and fat content of a mixed meal is associated with greater postprandial glucose as compared with meals with an identical carbohydrate content; however, the findings are heterogeneous and obtained mostly with relatively low carbohydrate meals (30–50 g).
Data regarding the effect of alcohol on postprandial glycemic response in type 1 diabetes are scarce and contrasting, showing either an increased risk of hypoglycemia or a trend toward greater plasma glucose.
What are the new findings?
Increasing the content of proteins (and fats) in a meal with a high content (≈100 g) of carbohydrates results in slightly greater late postprandial blood glucose concentrations and lower risk of hypoglycemia, as compared with a meal with the same carbohydrates but lower proteins and fats; however, the net contribution of proteins appears lower than in meals with low/medium carbohydrate content.
Alcohol consumption (0.7 g of alcohol per kg of body weight, given as beer) with a mixed meal does not seem to increase the risk of postprandial hypoglycemia during at least 6 hours post ingestion.
Ingestion of approximately 1.5 pints of a medium-high alcoholic strength beer lowers plasma pH significantly and might contribute to late postprandial hyperglycemia, likely increasing insulin resistance.
How might these results change the focus of research or clinical practice?
Diabetes care professionals and patients should be instructed about the complexity of postprandial glucose response as a function of the carbohydrate to protein ratio, with an increased risk of hypoglycemia with low protein meals. They should also be aware of alcohol-induced insulin resistance and the potential risk of metabolic acidosis, especially under conditions of poor glycemic control.
Introduction
Glycemic variability, especially in the postprandial state, is one of the most challenging issues of blood glucose control in subjects with type 1 diabetes (T1D). It can have profound implications for both patients and healthcare providers. For the former, glycemic variability implies a greater risk of unexpected hyperglycemia or hypoglycemia and may represent a psychological burden since it is related to a poor quality of sleep and probably to a worse quality of life.1–3
Meal composition is certainly one of the most important determinants of both intraday and interday within-subject postprandial variability.4–6 Additionally, there is evidence of intersubject variability in the response to identical meals.7 Nevertheless, carbohydrate intake is the main driver of postprandial glucose (PPG) elevation, and despite accurate carbohydrate counting and new technologies it remains one of the most challenging aspects of diabetes care.8–11 Protein and fat intake likely plays a role on PPG, but findings are heterogeneous. Indeed, while some studies observed a significant increase in mean glucose area under the curve (AUC) (or in insulin needed to maintain the same glucose control) with the addition of proteins and/or fats in the meal,12–15 others failed to demonstrate it.16 17 Moreover, the magnitude of the effect varies greatly among studies, and most importantly, majority of them used relatively low amount of carbohydrates (30–50 g).12 14 18
Another possible source of PPG variability is alcohol consumption. However, data regarding the role of alcohol in the context of a mixed meal are scarce. This issue is relevant, since ethanol consumption among subjects with T1D is similar to that of the general population19 20 and it could significantly affect blood glucose control through direct and indirect pathways.21–25 The literature is even poorer about the effect of beer, despite it being the most consumed alcoholic drink in the vast majority of countries in the world.26
The objective of the present study was to investigate the effect of high carbohydrate meals of different compositions, with or without ethanol, on the PPG response in adult subjects with T1D.
Research design and methods
Subjects
Twelve subjects with T1D were recruited among those attending the outpatient clinic of the Francesc de Borja Hospital, Gandía, Spain. They were studied after receiving ethics approval and giving informed written consent, provided they were >18 years old but <65 years, with a disease duration >1 year, a hemoglobin A1c >6.5% (48 mmol/mol) and <8.5% (69 mmol/mol), and a body mass index (BMI) between 18 kg/m2 and 35 kg/m2. They were all on a basal-bolus insulin regimen and free of significant microvascular (proliferative or severe non-proliferative retinopathy, macroalbuminuria, clinically detectable autonomic or peripheral neuropathy) and macrovascular complications.
Study design
The study had a randomized, crossover, open design. Following a 4-week run-in period, during which the basal-bolus treatment was optimized, each subject received a mixed meal on three different occasions at 2-week intervals. The carbohydrate content of the meals was nearly the same, but the macronutrient composition and energetic content were different (online supplemental table 1):
Supplemental material
High protein, high fat meal, with alcohol (HPHF-A): 120 g of white bread, with 227 g of turkey breast cold cuts, 20.8 mL of olive oil, and 150 g of grated tomato (corresponding to 70 g of carbohydrates, 52.5 g of proteins, and 23.3 g of fats), plus a volume of beer calculated to administrate 0.7 g of alcohol per kilogram of weight.
High protein, high fat meal, without alcohol (HPHF-W): the same meal as meal 1, with nearly identical volume of non-alcoholic beer.
Low protein, low fat meal, without alcohol (LPLF-W): the same amount of bread given in meals 1 and 2, 232 g of grated tomato, and 6 mL of olive oil (corresponding to 70 g of carbohydrates, 7.5 g of proteins, and 7.0 g of fats), with the same volume of non-alcoholic beer given in the HPHF-W study.
Randomization followed a 3×3 Latin square design, with the subjects assigned to receive each meal according to one of the following sequences (four subjects each sequence):
S1: LPLF-W, HPHF-W, HPHF-A.
S2: HPHF-W, HPHF-A, LPLF-W.
S3: HPHF-A, LPLF-W, HPHF-W.
The basal insulin dose, optimized during the run-in phase, was maintained fixed during the study period. The decision of the prandial insulin dose to be administered at each mixed meal test was shared with the subjects, who were informed about the composition of the meal and the volume of beer (along with its carbohydrate content per 100 mL) they would receive. Although the carbohydrate of the solid component of the meal was identical in the three studies, the carbohydrate content of the non-alcoholic beer was slightly greater (1.3 g/100 mL) as compared with the alcoholic one. Despite this difference, the decision was to maintain the same prandial insulin dose in all of the studies for the following reasons: to follow the usual clinical practice of the patients, who seldom perform fine-tuning of insulin dose (ie, they inject extra insulin per bottle of beer, and not per milliliter or per type of beer); to avoid the confounding factor of the metabolic effect of (yet slightly) different insulin doses; and to maintain the same volume of beer, ruling out the possible effect of fluid intake-induced variability of gastrointestinal clearance and of different mealtime periods.
Study procedures
The subjects came to the hospital at 08:00 in the morning in fasting state. Two venous lines were cannulated: the cubital vein for insulin or glucose infusion, if needed, to standardize blood glucose concentration around 100 mg/dL prior to the meal test, and the distal vein of the contralateral arm for arterialized venous blood sampling. The latter was placed in a heated box to obtain arterialized venous blood. At 10:30, just prior to meal consumption, prandial insulin aspart was injected in a periumbilical skinfold.
Blood samples for determination of hormones and metabolites were drawn from 30 min before mealtime (time −30 min) until the termination of the study at time +360 min. During the first 2 hours after meal (time +120 min), the samples were taken at 30 min intervals. Then, from time +120 min to the end, samples were taken each 60 min.
In case of postprandial hypoglycemia, defined as plasma glucose below 70 mg/dL confirmed in two subsequent determinations at 15 min intervals, 15 g of glucose were given orally every 15 min until recovery of euglycemia.
The last sample was collected at 16:30. At 17:00, patients were free to leave the hospital, but on days with alcohol it was recommended to do it with an accompanying person. The week of the meal study, patients also wore a continuous glucose monitor (CGM; Dexcom G5) so that the evening, nocturnal and next morning glucose data were available.
Analytical methods
Plasma glucose was measured in arterialized venous blood, centrifuged immediately after the extraction, and analyzed in duplicate using YSI 2300 STAT Plus Analyzer (Yellow Springs Instruments, Yellow Springs, Ohio).
Insulin concentration was measured by a commercial chemiluminescent immunoassay (Abbott Architect), with a good cross-reactivity for both human and insulin analogs,27 28 after polyethylene glycol extraction of antibodies from the serum.29 Plasma glucagon was measured by a quantitative sandwich enzyme immunoassay technique (Quantikine ELISA, R&D Systems, with a mean minimum detectable dose of 6.37 pg/mL), growth hormone (GH) and cortisol by electrochemiluminescence immunoassay, ethanol by an enzymatic method with alcohol dehydrogenase, and pH and lactate by an ion-selective electrode potentiometry method (Roche Diagnostics SLU). Free fatty acids were measured by an enzymatic endpoint method with a lower limit of detection of 0.01 mmol/L (DiaSys Diagnostic Systems, Germany).
Endpoints and statistical analysis
The primary endpoint was plasma glucose concentration in the 6-hour postprandial period. Other outcomes were the time spent in hypoglycemia, the plasma concentration of free fatty acids, lactate and counter-regulatory hormones, and pH.
Previous to data analysis, the following data preprocessing was carried out: (1) in case of hypoglycemia, the last value before oral glucose administration was carried forward until the end of the study at time +360 min; and (2) samples with a high level of hemolysis (>100 units) were discarded and their values were linearly interpolated.
Data were analyzed through analysis of variance (ANOVA) for repeated measures (with Huynh-Feldt correction for non-sphericity, when needed) after Napierian logarithmic (Ln) transformation to achieve normally distributed data. In this analysis, patients were included as random factors and study and time as fixed ones. When normal distribution was not achieved, non-parametric analysis by the Kruskal-Wallis one-way ANOVA on ranks was carried out on non-transformed data. Post-hoc analysis was performed with Fisher’s Least Significant Difference multiple comparison to assess all pairwise differences between the means (LPLF-W vs HPHF-W, LPLF-W vs HPHF-A, and HPHF-W vs HPHF-A) and, when the interaction between study and time was significant, to pinpoint differences between studies at specific time points. When Ln-transformed, differences between studies are given as ratios obtained from the antilogged difference between study conditions.
Data are presented as mean±SD and, since most of the non-transformed data are not normal, also as median and IQR.
Results
All of the 12 recruited subjects completed the study. Their characteristics and main treatment parameters, as well as insulin dose and amount of carbohydrates given the day of the studies, are given in table 1.
Mean±SD and range of the characteristics of subjects who participated in the study, and mean±SD and range of the main treatment parameters, insulin dose, amount of carbohydrates, and beer volume given at each type of the study
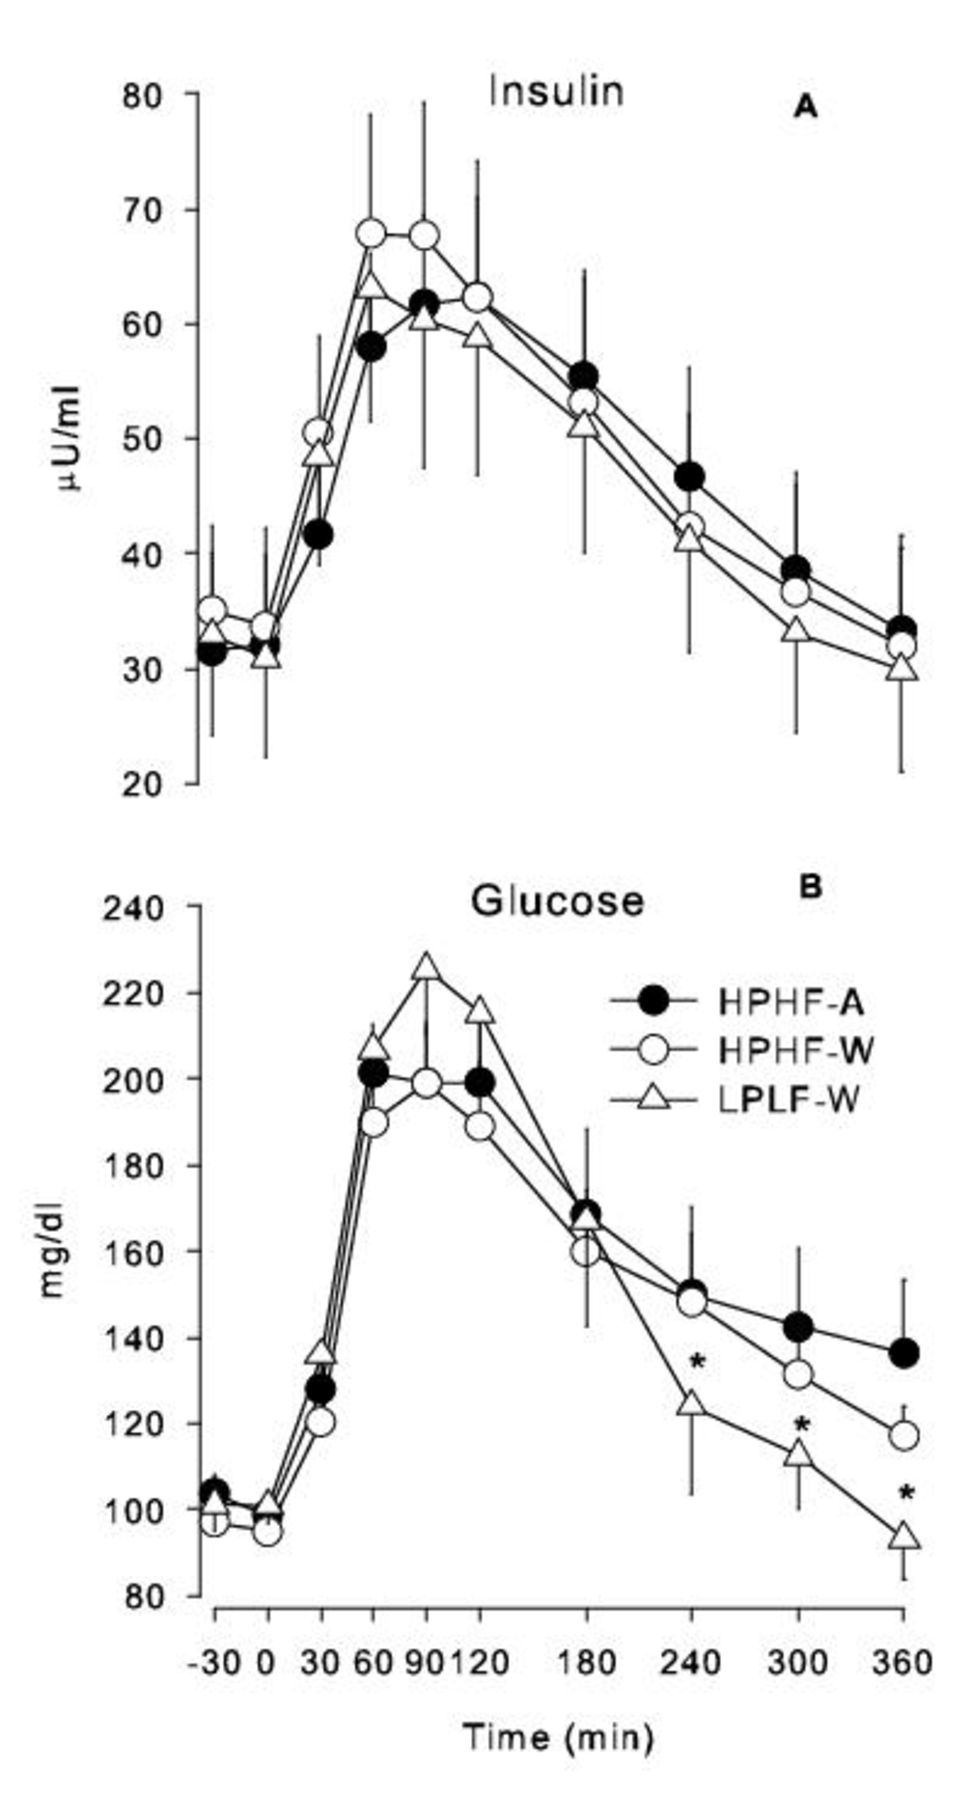
The mean insulin concentration was similar in the HPHF studies as compared with the LPLF-W study (+8% in HPHF-A vs LPLF-W, 95% CI 0.93 to 1.25; +9% in HPHF-W vs LPLF-W, 95% CI 0.94 to 1.27), without any significant interaction with time (p value for difference between studies=0.2969; figure 1).

Mean glucose and insulin concentration profiles during the studies. Meal is given at time 0. (A) Mean and SE of insulin concentration during the studies. Interaction between time and study condition was not significant (p=0.178). (B) Mean and SE of glucose concentration during the studies. *Different from the other two studies (post-hoc analysis on significant interaction between time and study condition, p=0.0088). HPHF-A, high protein, high fat meal, with alcohol; HPHF-W, high protein, high fat meal, without alcohol; LPLF-W, low protein, low fat meal, without alcohol.
The mean glucose concentration was also similar in the HPHF studies as compared with the LPLF-W study (+6% in the HPHF-A study vs the LPLF-W study, 95% CI 0.95 to 1.18; +1% in the HPHF-W study vs the LPLF-W study, 95% CI 0.91 to 1.13). Nevertheless, time significantly affected the differences between studies (Huynh-Feldt adjusted p=0.0088), where the mean glucose in the HPHF-A and HPHF-W studies was higher than the glucose in the LPLF-W study at time 240, 300 and 360 min: 27%, 24%, and 42% greater in HPHF-A; 30%, 17%, and 29% greater in HPHF-W (figure 1). Greater BMI resulted in greater PPG but without significant interaction with the study factor (online supplemental figure 1), while sex did not seem to have any effect (online supplemental figure 2). Hypoglycemia in the first 6 hours of the postprandial period was much more frequent in the LPLF-W study (7 of 12 subjects) as compared with HPHF-W (3 of 12 subjects) and HPHF-A (1 of 12 subjects). Accordingly, time in hypoglycemia was significantly greater in the LPLF-W study (71.6±6.1 min; 54.5 (0, 150) min) than in the HPHF-W (20.0±3.1 min; 0.0 (0, 45) min) and in the HPHF-A (10.0±2.9 min; 0 (0, 0) min) conditions (LPLF-W vs HPHF-W, 95% CI −103.3 to 0.1; LPLF-W vs HPHF-A, 95% CI −113.3 to −9.9; p=0.0179). In contrast, CGM data showed no difference between studies in the incidence and duration of hypoglycemia from 1 hour after termination of the meal test until the next morning at 10:30 (online supplemental figure 3).
Plasma alcohol concentration was undetectable in the HPHF-W and LPLF-W studies. In the HPHF-A studies, ethanol increased rapidly after ingestion, peaked at +60 min, and plateauing until +120 min when it started to decline at approximately 0.1 mg/dL/hour, being still significantly above baseline at the study end (figure 2).

Mean and SE of alcohol (A), free fatty acids (B), lactate (C), and pH (D) profiles during the studies. *Different from the other two studies; #different from the HPHF-A study (post-hoc analysis on significant interaction between time and study condition, p<0.0001). FFA, free fatty acids; HPHF-A, high protein, high fat meal, with alcohol; HPHF-W, high protein, high fat meal, without alcohol; LPLF-W, low protein, low fat meal, without alcohol.
Lactate was greater in the HPHF-A study as compared with the other two studies (a mean of 44% higher than HPHF-W (95% CI 1.31 to 1.59) and 41% than LPLF-W (95% CI 1.28 to 1.55), p<0.0001), the difference being significant from time 60 min until the end of the study. This was paralleled by a significant reduction of plasma pH, with a mean difference of 0.016 units (p=0.0023) (figure 2), and the HPHF-A to HPHF-W ratio and the HPHF-A to LPLF-W ratio being both 0.998 (95% CI 0.996 to 0.999).
Free fatty acids decreased postprandially from basal values in all studies with a nadir at time 180 (antilipolytic effect of insulin). It then started to increase toward preprandial values in the HPHF-W and LPLF-W studies, whereas it remained significantly more suppressed in the HPHF-A study (corrected p=0.000023 for interaction between study and time; figure 2).
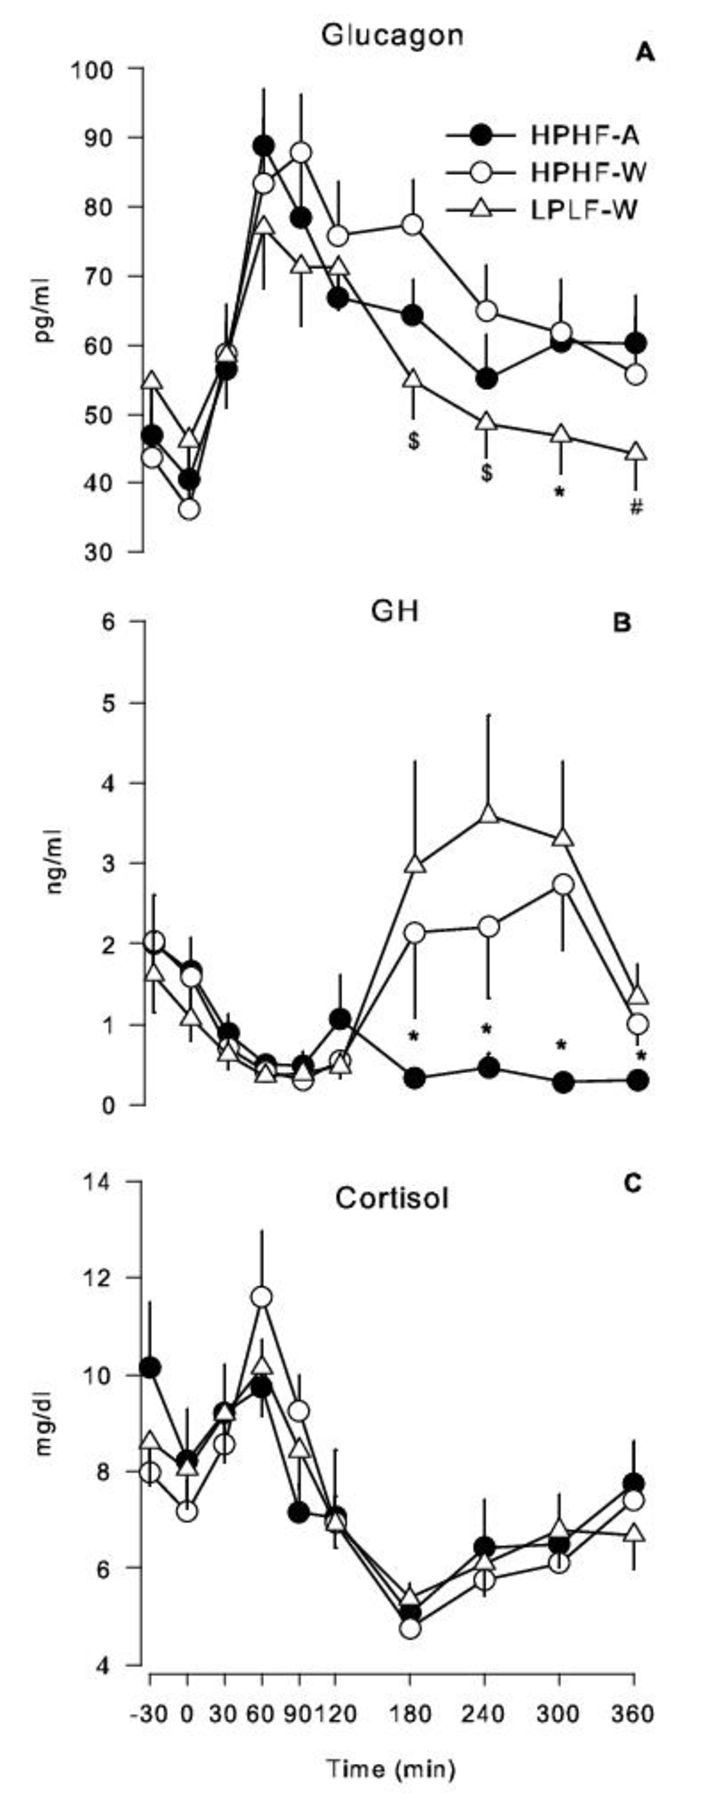
The mean glucagon concentration was slightly but not significantly greater in the HPHF studies as compared with the LPLF-W study (+8% in HPHF-A, 95% CI 0.84 to 1.37; +9% in HPHF-W, 95% CI 0.86 to 1.40). However, paralleling what was observed with glucose, time significantly affected the differences between studies (p=0.040) and glucagon appeared to be greater in the late postprandial phase in the HPHF studies, regardless of alcohol administration (figure 3).
Mean glucagon, GH, and cortisol profiles during the studies. Meal is given at time 0. (A) Mean and SE of glucagon concentration during the studies. *Different from the other two studies; #different from the HPHF-A study; $different from the HPHF-W study (post-hoc analysis on significant interaction between time and study condition, p<0.0001). (B) Mean and SE of GH concentration during the studies. *Different from the other two studies (post-hoc analysis on significant interaction between time and study condition, p<0.0001). (C) Mean and SE of cortisol concentration during the studies. Interaction between time and study condition was not significant (p=0.464). GH, growth hormone; HPHF-A, high protein, high fat meal, with alcohol; HPHF-W, high protein, high fat meal, without alcohol; LPLF-W, low protein, low fat meal, without alcohol.
GH was significantly lower in the HPHF-A study as compared with the other two studies: a mean of 39% lower than HPHF-W (95% CI 0.43 to 0.87) and 45% lower than LPLF (95% CI 0.39 to 0.68) (p=0.000621). Time significantly affected the differences between studies (p<0.0001), with post-hoc analysis indicating a significant difference from time +180 min until the end of the study (figure 3).
No difference in cortisol concentration was observed between studies (p=0.754).
Conclusions
This study confirms that the addition of proteins and fats to carbohydrates increases late postprandial blood glucose and that alcohol consumed as beer with a mixed meal has profound metabolic effects but with small positive net contribution to the plasma glucose pool. Then, in similar basal conditions, the risk of postprandial hypoglycemia is lower in case of meals with higher protein and fat composition and not increased by the concomitant alcohol consumption.
Regarding the impact of adding proteins and fats to carbohydrates, our results are qualitatively in line with those from other authors, demonstrating significant greater glucose values as compared with an LPLF meal starting from time 240 min post-meal.
Both proteins and fats have shown to significantly affect PPG. Proteins seem to increase ‘per se’ the AUC of PPG only at high amounts (≥75 g),30 whereas the impact in the context of a mixed meal may be apparent at lower doses, although with some degree of variability. Indeed, in crossover randomized studies in children/adolescents, a protein content of 26.6 g in one study18 and of 40 g in another14 increased mean glucose (19.8 mg/dL/hour over 10 hours),18 as compared with a meal with an identical carbohydrate but lower protein content (the difference being, respectively, of 16 g and 35 g); when the amount of protein was greater (110 g vs 28 g, along with 52 g vs 19 g of fats),15 the difference in glucose concentration increased accordingly (a mean of 47.3 mg/dL over 12 hours). The figure seems to be the same in adults, as in a study,12 where the protein content was 36 g, accompanied by 44 g of fats, and the incremental AUC of PPG was doubled as compared with the LPLF meal (the differences in protein and fat content being, respectively, of 27 and 40 g). In contrast, others failed to find significant differences in mean blood glucose over the study period.17 Nevertheless, all studies showed a significant interaction between plasma glucose concentration and time, with higher protein meals producing a significant increase as compared with lower ones, starting from 150 min to 180 min post ingestion until the end of the observation (range 5–12 hours).12 14 15 17 18 30–32
The best evidence regarding the impact of the amount of fats on PPG after a mixed meal has been given by Bell et al,16 who showed that, independent of the type of fat, increasing its content from 20 g to 40 g and 60 g did not affect the mean incremental AUC_PG0–5 hours as compared with carbohydrates only (45 g), but resulted in a significantly different shape of glucose time series with proportionally lower concentration in the 0–120 min period and greater values in the late postprandial phase (from 120 min until the end of the study at 5 hours). The same finding (same AUC but lower early PPG) has been confirmed in a slightly shorter study (4-hour duration, 60 g carbohydrates, 15 g proteins, 2 g vs 38 g fats).33 In contrast, findings from other authors seem to indicate that fats increase insulin requirements13 and that the effect of fats and protein may be additive in terms of glucose response,14 although the use of monounsaturated fats (extra virgin olive oil) instead of saturated ones (butter) may blunt the PPG response to meals with otherwise nearly identical macronutrient composition.34
In our study, the fat content in the HPHF meal was modest (23.3 g) and the difference between the two meals was relatively small (16 g). Although an additive effect with the protein component cannot be excluded, its net contribution to the late postprandial hyperglycemia was likely minimal (as shown by Bell et al16 with 20 g) and perhaps reduced by the use of monounsaturated fats.34 However, the difference in the protein content (45 g) between the high protein and the low protein meal is in line or even slightly greater than in all,12 14 17 31 but one,15 of the other crossover mixed meal studies. Nevertheless, the impact on late PPG was quantitatively lower, being 24 mg/dL at 6 hours post ingestion as compared with ≈100 mg/dL at 5 hours in one study14 and at 6 hours in others.12 15 Although this difference may be partly explained by the greater increment of fat content in all of the cited studies (respectively, 40 g, 31.2 g, and 33 g vs 16 g in ours)12 14 15 and much greater protein content in one of them,15 another possibility is that the impact of proteins and fats on PPG is a function not only of its absolute content but also of the absolute amount of carbohydrates or the ratio between carbohydrate/protein or carbohydrate/(protein+fat). Indeed, the carbohydrate content in our study was two to three times greater than that administered in most of the other studies. The only significant exception is the experiment by Borie-Swinburne et al,17 who administered 87 g of carbohydrate and, like us, found no difference in the early PPG concentration and smaller although significant differences 2.5–5 hours after meal. With respect to the mechanism through which proteins exert their positive effect on plasma glucose, our study also indicates a significant contribution from greater glucagon concentration (20%–40% higher than the LPLF-W study, starting from time 180 min). Besides, a direct contribution to gluconeogenesis from greater plasma amino acids concentration cannot be ruled out, as supported by data in the literature.35 36 On the other hand, free fatty acids were similar in the HPHF-W and LPLF-W studies and likely did not play any role.
Regarding the effect of alcohol in subjects with T1D, a few randomized controlled trials have evaluated its impact on PPG when consumed with a mixed meal,22 25 37 38 but none with beer.23 Our results confirm the findings from Koivisto et al37 and Kerr et al,25 who, giving ethanol amounts slightly greater than (1 g/kg/body weight) or similar to us (48 g women, 64 g men), respectively, did not find any difference in plasma PPG25 37 or in the following morning.37 Additionally, no hypoglycemic episodes ensued during the former study, while PPG at 4 hours (end of study) in the latter was 29 mg/dL greater in the ethanol arm (similarly to our results). In contrast, a small study (n=6) where ethanol (0.75 g/kg/body weight) was given 3 hours after dinner22 showed similar plasma PPG but lower values the next day (both fasting and post breakfast) with increased incidence of late-morning hypoglycemia. Partially in accordance, Richardson et al38 showed lower mean interstitial glucose (21.6 mg/dL over 24 hours), the greatest visual difference being 2–5 hours post meal, when ethanol (0.85 g/kg/body weight) was given at dinner. Moreover, the incidence of self-reported symptomatic hypoglycemia was twice greater as compared with placebo (range 0–4 vs 0–2). However, that was a non-controlled, free-living conditions study where plasma insulin was not measured and old CGM systems, known to have low accuracy, were used. Additionally, the number of patients experiencing hypoglycemia was not reported and the range of daily carbohydrate consumption was unusually wide and high (195–1350 g in the ethanol group). Therefore, the contribution of other factors like exercise or random variations in insulin absorption to the observed difference cannot be ruled out.
In our study, despite the lower carbohydrate content of the HPHF-A study (10.5±1.9 g) due to the unavoidable slight mismatch with non-alcoholic beer, PPG was not lower than the HPHF-W condition. Additionally, none but one patient experienced hypoglycemia (that patient was overdosed, since he/she had hypoglycemia under all study conditions). Importantly, this occurred with similar plasma insulin, but lower free fatty acids and GH concentrations, as seen by others.22 Thus, the observed PPG differences are probably underestimated and support the predominance of alcohol-induced insulin resistance25 39 and overinhibition of gluconeogenesis and lipolysis, at least in the 6 hours postprandial state. Additionally, a delayed alcohol effect promoting a greater incidence of nocturnal or next-morning hypoglycemia has been ruled out by CGM data (although data must be interpreted with caution due to uncontrolled conditions and the small sample size). This is in line with one study in adolescents, where alcohol consumption in the context of meals and sweetened mixers resulted in significantly less time spent in hypoglycemia than an alcohol-free evening.40
Importantly, we have shown that alcohol consumption was followed by a significant decrease in pH level, likely due to the known increase of beta-hydroxybutyrate (not measured) and specular to the increase in lactate concentration (resulting from inhibition of its peripheral conversion into pyruvate). Although the difference may seem small in absolute terms, it should be remembered that pH is tightly regulated and that in some patients pH fell below 7.35 despite high plasma insulin and suppressed lipolysis. This may have clinically relevant implications, especially in the context of inadequate prandial insulin titration.
The strengths of our study include the measurement of glucose in plasma instead of capillary blood or interstitial fluid, which reduces bias and the expected greater variance from a less accurate method; the measurement of plasma insulin, which excludes observed differences in plasma glucose that are affected by variability in insulin absorption; and the virtually identical normoglycemic values across patients and studies achieved with standardization of the preprandial glucose by means of an insulin feedback. Another strong point is the assessment of hormonal and metabolic concentrations since this allows a deeper explanation of our findings. Besides, the crossover design minimizes the risk of confounding factors.
The main weaknesses of our study are the relatively short duration, the use of only one type of alcoholic drink, and the small number of participants, which may not allow recognition of significant differences with respect to the mean incremental AUC_PPG. However, the study does include the entire duration of most postprandial periods since the interval between meals usually prolongs over 6 hours only during the night. Another limitation is the unblinded composition of the meal, since it could theoretically influence patients’ behavior or decisions (insulin dose, time of meal consumption, etc). However, blinding was not considered since the patients could easily identify the meal and non-alcoholic/alcoholic beer by the taste.
In summary, we can conclude that meal composition affects PPG response, the latter being greater when the fat-protein content increases, and probably in part mediated by glucagon increase. However, the absolute contribution of proteins to PPG seems to be attenuated when the carbohydrate content of the meal is high. Ethanol has relevant metabolic and hormonal effects (suppression of GH, increase of lactate, reduction of pH, and reduction of free fatty acids) with contrasting effects on glucose metabolism. Nevertheless, contrary to the widespread belief, when consumed as beer and with HPHF meals, its net balance in the postprandial state seems in favor of insulin resistance, without any increase in the risk of hypoglycemia, at least during the 6-hour postprandial period.
Data availability statement
Data are available upon reasonable request. The data are available on request from the corresponding author. Paolo Rossetti (prossetti73@gmail.com).
Ethics statements
Patient consent for publication
Ethics approval
The study received approval from the Ethical Committee of the Hospital Clínic Universitari de Valencia.
References
Supplementary materials
Supplementary Data
This web only file has been produced by the BMJ Publishing Group from an electronic file supplied by the author(s) and has not been edited for content.
Footnotes
Contributors PR designed the project, performed the experiments, researched the data, wrote the manuscript, contributed to the discussion, and reviewed/edited the manuscript. AG performed the experiments, researched the data, contributed to the discussion, and reviewed/edited the manuscript. VM researched the data, contributed to the discussion, and reviewed/edited the manuscript. AR-P reviewed the project, performed the experiments, and reviewed the manuscript. JD and MB designed and performed the laboratory part of the project and reviewed the manuscript. JB is the PI of the research group and acquired funding, designed the project, contributed to the discussion, and reviewed the manuscript.
Funding This paper presents independent research financially supported by Ministerio de Economía y Competitividad (MINECO) (DPI2016-78831-C2-1-R), Agencia Estatal de Investigación (PID2019-107722RB-C21/AEI/10.13039/501100011033), and the European Union through FEDER funds.
Competing interests None declared.
Provenance and peer review Not commissioned; externally peer reviewed.
Supplemental material This content has been supplied by the author(s). It has not been vetted by BMJ Publishing Group Limited (BMJ) and may not have been peer-reviewed. Any opinions or recommendations discussed are solely those of the author(s) and are not endorsed by BMJ. BMJ disclaims all liability and responsibility arising from any reliance placed on the content. Where the content includes any translated material, BMJ does not warrant the accuracy and reliability of the translations (including but not limited to local regulations, clinical guidelines, terminology, drug names and drug dosages), and is not responsible for any error and/or omissions arising from translation and adaptation or otherwise.