Article Text

Abstract
Introduction Decreased insulin sensitivity occurs early in type 2 diabetes (T2D). T2D is highly prevalent in the Middle East and North Africa regions. This study assessed the variations in insulin sensitivity in normal apparently healthy subjects and the levels of adiponectin, adipsin and inflammatory markers.
Research design and methods A total of 60 participants (aged 18–45, body mass index <28) with a normal oral glucose tolerance test (OGTT) completed hyperinsulinemic-euglycemic clamp (40 mU/m2/min) and body composition test by dual-energy X-ray absorptiometry scan. Blood samples were assayed for glucose, insulin, C peptide, inflammatory markers, oxidative stress markers, adiponectin and adipsin.
Results The subjects showed wide variations in the whole-body glucose disposal rate (M value) from 2 to 20 mg/kg/min and were divided into three groups: most responsive (M>12 mg/kg/min, n=17), least responsive (M≤6 mg/kg/min, n=14) and intermediate responsive (M=6.1–12 mg/kg/min, n=29). Insulin and C peptide responses to OGTT were highest among the least insulin sensitive group. Triglycerides, cholesterol, alanine transaminase (ALT) and albumin levels were higher in the least responsive group compared with the other groups. Among the inflammatory markers, C reactive protein (CRP) was highest in the least sensitivity group compared with the other groups; however, there were no differences in the level of soluble receptor for advanced glycation end products and Tumor Necrosis Factor Receptor Superfamily 1B (TNFRS1B). Plasma levels of insulin sensitivity markers, adiponectin and adipsin, and oxidative stress markers, oxidized low-density lipoprotein, total antioxidant capacity and glutathione peroxidase 1, were similar between the groups.
Conclusions A wide range in insulin sensitivity and significant differences in triglycerides, cholesterol, ALT and CRP concentrations were observed despite the fact that the study subjects were homogenous in terms of age, gender and ethnic background, and all had normal screening comprehensive chemistry and normal glucose response to OGTT. The striking differences in insulin sensitivity reflect differences in genetic predisposition and/or environmental exposure. The low insulin sensitivity status associated with increased insulin level may represent an early stage of metabolic abnormality.
- diabetes mellitus
- type 2
- glucose tolerance test
- hyperinsulinism
- insulin resistance
Data availability statement
Data are available upon reasonable request. All underlying data relating to this study will be made available upon reasonable request to the corresponding author.
This is an open access article distributed in accordance with the Creative Commons Attribution Non Commercial (CC BY-NC 4.0) license, which permits others to distribute, remix, adapt, build upon this work non-commercially, and license their derivative works on different terms, provided the original work is properly cited, appropriate credit is given, any changes made indicated, and the use is non-commercial. See: http://creativecommons.org/licenses/by-nc/4.0/.
Statistics from Altmetric.com
Significance of this study
What is already known about this subject?
Insulin resistance is one of the early indicators of type 2 diabetes.
Insulin resistance over a period triggers beta cell failure.
What are the new findings?
A wide range in insulin sensitivity and significant differences in lipids were present even in relatively young men despite the fact that the study subjects were homogenous in terms of age, gender and ethnic background, and all had normal screening comprehensive chemistry and normal glucose response to oral glucose tolerance test (OGTT).
Relying only on fasting glucose and hemoglobin A1c is not adequate for determining insulin sensitivity in individuals.
Low insulin-sensitive individuals may be at increased risk of developing type 2 diabetes.
How might these results change the focus of research or clinical practice?
This study may encourage researchers to use more hyperinsulinemic-euglycemic clamp procedures to determine insulin sensitivity rather than depending on the traditional method of using OGTT to determine insulin sensitivity.
Introduction
Insulin resistance is defined as a reduced response of insulin target tissues to the biological action of insulin.1 Insulin resistance is the earliest metabolic defect detected in subjects likely to develop type 2 diabetes (T2D).2 In response to insulin resistance, beta cells augment their insulin secretion and the compensatory hyperinsulinemia maintains normal glucose tolerance.3 As long as beta cells are capable of increasing insulin secretion to compensate for insulin resistance, normal glucose tolerance is maintained. Thus, hyperinsulinemia is a key feature in insulin-resistant individuals without diabetes.4
Insulin-resistant individuals manifest multiple subclinical metabolic abnormalities, such as impaired fasting plasma glucose concentration, impaired glucose tolerance, dyslipidemia (increased plasma triglyceride and/or decreased plasma high-density lipoprotein (HDL) concentrations), abdominal obesity and increased blood pressure, a clinical constellation known as the resistance metabolic syndrome.5–8 In addition to the above-mentioned metabolic abnormalities, insulin resistance alone could be an independent risk for atherosclerosis and cardiovascular diseases.5 8
Skeletal muscle, liver and adipose tissues are major target tissues to the metabolic action of insulin. Insulin stimulates muscle glucose uptake, inhibits hepatic glucose production and suppresses lipolysis in adipocytes;9 however, skeletal muscles are the major sites for insulin-stimulated glucose disposal in human.10–12 Impairment of insulin action in insulin-responsive tissues leads to insulin resistance.13 Higher insulin concentrations are required in insulin-resistant individuals, compared with insulin-sensitive people, to suppress hepatic glucose production and lipolysis to the same levels. For example, Groop et al13 reported that the half maximal effective concentrations for insulin to suppress hepatic glucose production and lipolysis are increased in patients with T2D compared with normal subjects without diabetes, from ~30 to ~70 µU/mL and from ~10 to ~20 µU/mL, respectively.
The etiology of insulin resistance is complex and involves both environmental and genetic factors. Environmental factors such as polluted air, soil, unhealthy diet intake resulting in overweight and obesity, and sedentary lifestyle are among the most important environmental factors responsible for the development of insulin resistance.12 14–16 The hyperinsulinemic-euglycemic clamp (HIEC), which represents the gold standard method for quantification of insulin-stimulated muscle glucose uptake, demonstrated 30%–40% decrease in insulin-stimulated glucose uptake in women with visceral obesity,17 and both weight loss and increased physical activity improve insulin sensitivity in obese individuals.18
The importance of genetic background in the pathogenesis of insulin resistance is well established.19 Studies in identical twins discordant for T2D demonstrated that the twin with normoglycemia manifests 24% decrease in insulin-stimulated glucose disposal compared with age-matched and body mass index (BMI)-matched normal individuals who do not have a family history of T2D.20 21 Similarly, the offspring of two parents with diabetes manifests ~50% decrease in insulin-stimulated glucose disposal compared with subjects without a family history of diabetes.22
T2D and gestational diabetes are highly prevalent in Qatar, with an estimated 17% of all adults having T2D and 23% of all pregnant women developing gestational diabetes.23–28 The high prevalence of metabolic disorders in Qatar suggests increased population risk for diabetes due to genetic and/or environmental factors. We raised the hypothesis that a significant number of apparently healthy people in Qatar may have decreased insulin sensitivity. The main objective of the present study was to evaluate insulin sensitivity in a homogenous group of apparently healthy young subjects with normoglycemia of Arabic background in Qatar. We were interested in investigating insulin and C peptide release pattern following oral glucose tolerance test (OGTT) in subjects with high, intermediate and low insulin sensitivity. Interestingly, we found striking variations in insulin sensitivity among subjects, which negatively correlates with insulin secretion and with plasma concentrations of inflammatory markers.
Methods
Study design and subject recruitment
The aim of this study was to determine insulin sensitivity in normal apparently healthy individuals. Written informed consent was obtained from all subjects. Apparently healthy adult male subjects of Arabic background, aged 18–45, with no chronic medications and with BMI ≤28 were recruited through advertisements on the Hamad Medical Corporation social media platform. All subjects were recruited between July 2016 and May 2018. Exclusion criteria included subjects involved in regular strenuous exercise by self-report, those who did not have a stable body weight in the past 6 months or those adhering to special diets (ketogenic, intermittent fasting). A total of 152 subjects were invited for initial screening, and from this 73 were enrolled following the inclusion/exclusion criteria. Eligible subjects were further screened with fasting blood tests for liver function, renal function, lipid profile, complete blood count, thyroid function and vitamin D level, as well as urine analysis and ECG. Those with normal values were then invited for a 75 g OGTT after 10–12 hours of overnight fasting, with blood sampling every 15 min to measure glucose, insulin and C peptide. A total of 60 individuals who fulfilled the inclusion/exclusion criteria agreed to complete the study protocol.
Dual-energy X-ray absorptiometry and HIEC
Whole-body dual-energy X-ray absorptiometry was performed to measure total fat, regional fat and fat-free mass using the Discovery 010-1596 instrument from Hologic and HIEC after overnight fast. The HIEC was performed according to the method of DeFronzo et al.29 Catheters were placed in the antecubital vein and in a vein on the back of the hand, which was placed on a heated box (60°C), for substrate infusion and blood draws, respectively. Insulin was infused at a constant rate of 40 mU (287 pmol) per minute per square meter of body surface area for 120 min. At the same time 20% glucose was infused in a separate vein and blood glucose levels were measured every 5 min. The glucose infusion rate was adjusted to maintain plasma glucose at 5 mmol/L. The rate of whole-body disposal of glucose per minute per kilogram of body weight (M value) was calculated. The M value (mg of infused glucose/kg body weight/min) was calculated from the glucose infusion rates during the last 60 min of the euglycemic clamp.30
Glucose assay
Blood samples during the OGTT and HIEC were collected in plain microtubes, rapidly centrifuged in a microcentrifuge, and the supernatant serum was assayed for glucose concentrations using Analox (GM9; Analox Instrument, UK). The intra-assay and interassay variations were less than 2%.
Insulin and C peptide assays
Insulin (cat# DINS00) and C peptide (cat# DICP00) were measured on EDTA plasma (0.1 mL) using an ELISA kit from R&D Systems (North America, USA), which has a detection range of 1–100 mIU/mL for insulin and 1–100 pg/mL for C peptide, respectively. The intra-assay and interassay variations for insulin and C peptide were less than 4% and less than 7%, respectively.
Adiponectin and adipsin assays
Adiponectin and adipsin levels were measured by the Bioplexpro magnetic bead-based multiplex assay kit (171A7002M), which is designed to measure multiple proteins in small volumes of serum, plasma or other biological fluids. The useful detection range for adiponectin was 0.3–1132 ng/mL and for adipsin 0.01–32.50 ng/mL. The intra-assay and interassay variations were 4.4% and 3%, respectively. The samples were diluted 1600 times prior to assay.
Inflammatory marker assays
The plasma concentrations of C reactive protein (CRP) and tumor necrosis factor receptor superfamily 1B (TNFRSF1B) were measured by ELISA from R&D Systems (CRP kit cat# DCRP00; sRAGE kit cat# DRG00; interleukin 6 kit cat# D6050; and TNFRSF1B kit cat# DRT 200). The preparation of all reagents, the working standards and the protocol were according to the manufacturer’s instructions. Absorbance was measured at 450 nm and subtracted from 570 nm using dual filters on an ELISA plate reader (Tecan). All samples were thawed only once and assayed in duplicates. The useful detection range for CRP was 0.8–50 ng/mL, for soluble receptor for advanced glycation end products (sRAGE) 1.23–16.14 pg/mL and for TNFRSF1B 7.8–500 pg/mL. The intra-assay and interassay variations were less than 4% and 8%, respectively.
Oxidative stress marker assays
Oxidized low-density lipoprotein (LDL; cat# 10-1143-01) and glutathione peroxidase 1 (GPX-1; cat# ab193767) were measured by an ELISA kit from Mercodia AB (Uppsala, Sweden) and Abcam (USA), respectively. Total antioxidant capacity (TAC) was measured by the TAC Assay Kit (cat# ab65329; Abcam) according to the manufacturer’s protocol. The detection range for oxidized LDL was 1.4–21.3 mU/L and for GPX-1 0.4–25 ng/mL. The intra-assay and interassay variations were 4.2% and 9.8%, respectively.
Enhanced liver fibrosis score and NAFLD score calculations
Enhanced liver fibrosis (ELF) score was calculated by measuring the circulating levels of tissue inhibitor of metalloproteinase 1 (TIMP-1; cat# DTM100) and hyaluronic acid (HA; cat# DHYAL0) obtained from R&D Systems and amino-terminal propeptide of type III procollagen (PIIINP; cat# ABX576014) obtained from Abbexa (Cambridge, UK). All measurements were done by ELISA. The useful detection range for TIMP-1 was 0.156–10 ng/mL, for HA 0.65–40 ng/mL and for PIIINP 62.5–4000 pg/mL. ELF score was calculated as demonstrated previously in a study.31 Non-alcoholic fatty liver disease (NAFLD) score was calculated using an online NAFLD calculator as demonstrated previously.32
Statistical analyses
Descriptive statistics and mean±SD were calculated for all continuous data variables. Preliminary statistical analyses were conducted to examine the distribution of the data variables using the Kolmogorov-Smirnov test. Baseline characteristics include anthropometric, fat mass distribution, hemoglobin A1c (HbA1c) and other biochemical parameters measured across different groups (least sensitive, intermediate sensitive and most sensitive) and were compared using one-way analysis of variance followed by Bonferroni statistical test for multiple comparisons. Bar graph plots and scatter diagram (linear regression) were constructed to depict the distribution of various quantitative outcome parameters and assess the strength of the linear relationship between the M value and the OGTT insulin area under the curve (AUC) values. AUCs for glucose, insulin and C peptide levels during OGTT were calculated using the trapezoidal method. All p values presented were two-tailed and p<0.05 was considered statistically significant. All statistical analyses were done using SPSS V.24.0 statistical packages.
Results
Basic characteristics of the study subjects
A total of 60 participants completed the study (figure 1) and showed a large variation in M values between 2 and 20 mg/kg/min (figure 2A). To understand the biochemical correlates to insulin sensitivity, we divided the participants into three groups based on M values: least sensitive (M value ≤6 mg/kg/min, n=14), intermediate sensitive (M value 6.1–12 mg/kg/min, n=29) and most sensitive (M value >12 mg/kg/min, n=17) (figure 2B). We measured insulin concentrations during the clamp and there was no significant difference between the different groups in terms of insulin level achieved during the clamp (figure 2C,D).
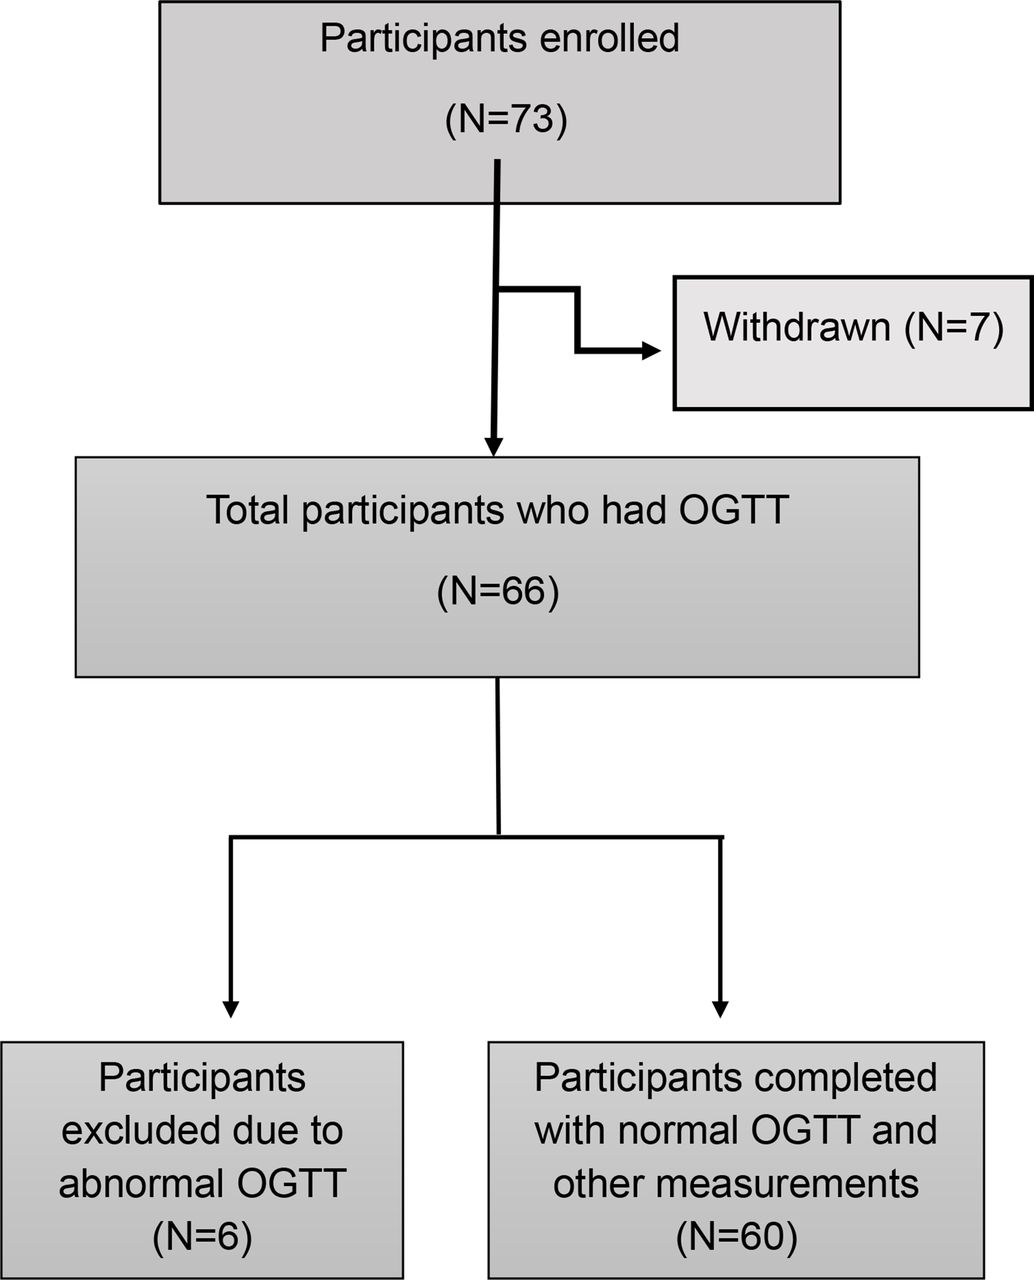
Study participants’ recruitment criteria. OGTT, oral glucose tolerance test.
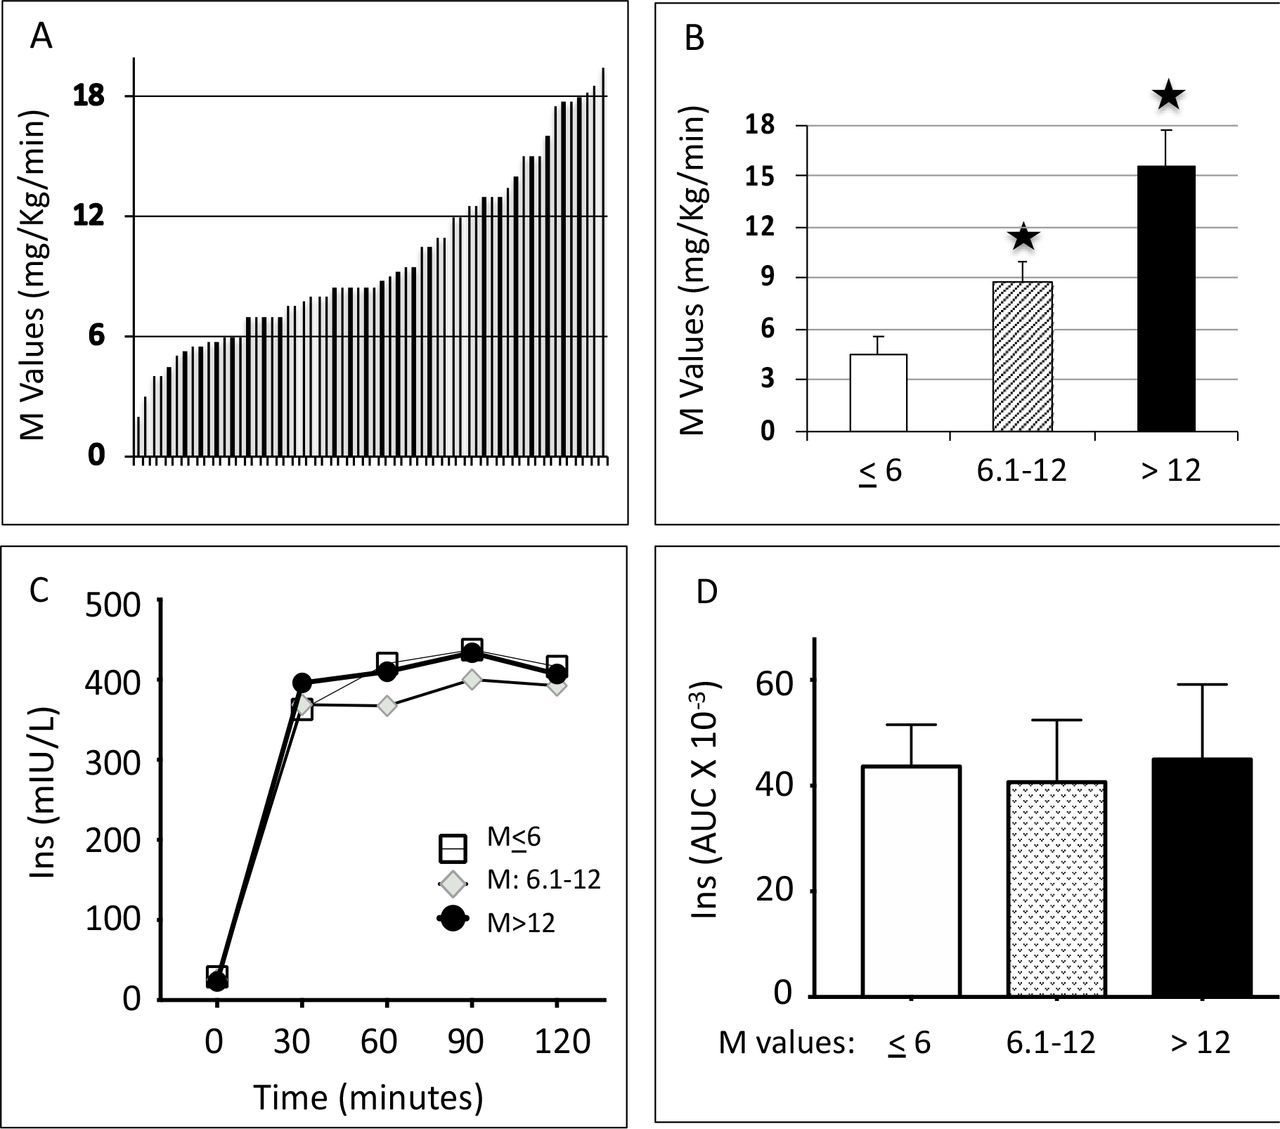
(A) Individual M values across the 60 individuals, arranged by increasing order. (B) Mean±SEM of M values grouped into three groups: least sensitive (M≤6), intermediate sensitive (M=6.1–12) and most sensitive (M>12). One-way analysis of variance followed by Bonferroni statistical test was performed for multiple comparisons. *P<0.001 versus the least sensitive group. (C) Insulin concentrations during the clamp procedure and (D) AUC for insulin concentrations during the clamp procedure. AUC, area under the curve; Ins, insulin; M value, whole-body glucose disposal rate.
Fasting insulin and platelets were significantly higher in the least sensitive group (p<0.05; table 1). Our study groups did not differ in terms of age, BMI, fat mass, fat mass distribution, HbA1c, ELF score, NAFLD score and Homeostatic Model Assessment 2 for Insulin Resistance (HOMA2-IR); this reflects the high degree of homogeneity of the selected study subjects (table 1). Furthermore, the groups also did not differ in terms of family history of T2D, which reflects the high prevalence of family history of T2D in Qatar. In fact, most of the participants (77%) have a family history of T2D. Serum albumin, cholesterol and alanine transaminase (ALT) concentrations were higher in the least sensitive group than in the other two groups. Triglycerides showed a trend toward achieving significance.
Baseline characteristics of the study subjects
Insulin and C peptide responses to OGTT
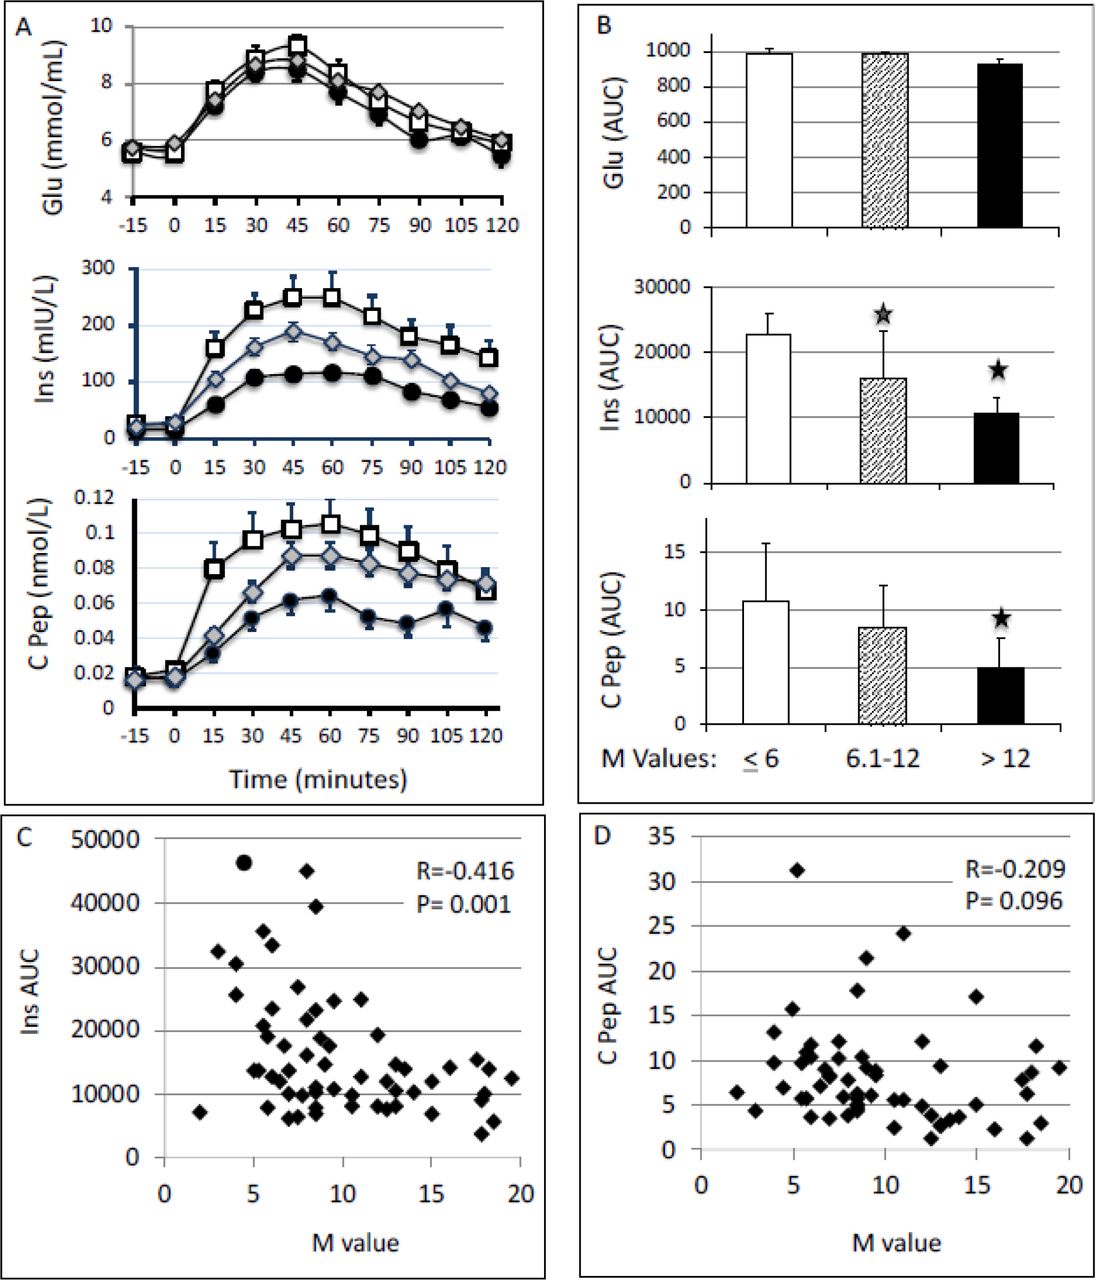
By study design all participants had normal glucose tolerance as assessed by OGTT (figure 3); however, an exaggerated insulin (p<0.01) and C peptide (p<0.01) response was noted in the least and the intermediate sensitivity groups as compared with the most sensitive group (figure 3A,B). The correlation between the M value of all subjects and the AUC for insulin response to OGTT was significant (r=−0.416, p=0.001; figure 3C). The correlation of the M value with the AUC of C peptide during OGTT was weaker and not statistically significant (figure 3D). We performed both hyperbolic curve and linear curve fit to understand the relation between (1) M value and insulin AUC and (2) M value and C peptide AUC. The hyperbolic curve fit was not better compared with the linear fit. Hence, linear fit was used to show the relationship between M value, C peptide AUC and insulin AUC (figure 3C).
(A) Plasma concentrations of glucose (mmol/L), insulin (mIU/L) and C peptide (nmol/L) during 75 g OGTT. White square: most sensitive group (M>12); gray diamond: intermediate sensitive group (M=6.1–12); and black circle, least sensitive group (M≤6). (B) AUCs for the glucose, insulin and C peptide responses during OGTT were calculated using the trapezoid method. One-way analysis of variance followed by Bonferroni statistical test was performed for multiple comparisons. *P<0.01 versus M≤6. (C and D) Correlation between M values and the AUC of insulin (C) and C peptide (D) responses to OGTT. AUC, area under the curve; C pep, C peptide; Ins, insulin; M value, whole-body glucose disposal rate; OGTT, oral glucose tolerance test.
Adiponectin, adipsin and oxidative stress markers
Adiponectin, adipsin and oxidative stress markers were measured in the fasting plasma samples at baseline in the three groups (table 2). No significant difference was observed in the mean plasma concentrations of adiponectin, adipsin, oxidized LDL, TAC and GPX-1 among the three groups.
Fasting plasma concentrations (mean±SD) of adiponectin, adipsin, and oxidative stress markers oxLDL, TAC and GPX-1 in the three different insulin sensitivity groups: M≤6 (n=14), M=6.1–12 (n=29) and M>12 (n=17)
Inflammatory markers
The plasma samples were further analyzed for CRP, TNFRSF1B and sRAGE. CRP concentrations were significantly increased in the least and intermediate sensitivity groups compared with the most sensitive group (table 2). There was no significant change in sRAGE and TNFRSF1B among the three groups.
Correlation of M value, insulin secretion during OGTT and HOMA2-IR with subject demographics and fasting biochemical data
To understand the relationship of whole-body glucose disposal and/or insulin secretion and HOMA2-IR with subject demographic characteristics and basal biochemical data, we performed Pearson rank analysis (table 3). The analysis showed negative correlations between the M value and hemoglobin, albumin, triglycerides, CRP, fasting insulin and insulin secretion during OGTT. On the other hand, insulin secretion during OGTT (OGTT-Ins-AUC) showed a positive correlation with ALT, cholesterol, triglycerides, LDL, regional fat distribution, android fat content, total fat, CRP and oxidized LDL. OGTT-Ins-AUC showed a negative association with fat-free mass and adiponectin levels. HOMA2-IR showed a positive correlation with heart rate, ALT, HDL, fasting insulin, fat mass and its distribution, insulin and C peptide secretion during OGTT (OGTT-Ins-AUC, OGTT-C pep-AUC), C peptide AUC, and CRP, and a negative correlation with adiponectin (table 3). CRP shows a negative correlation with M values of all subjects combined with p=0.013 (online supplemental figure 1).
Supplemental material
Pearson correlations of M value calculated from the hyperinsulinemic-euglycemic clamp and insulin secretion (AUC) during OGTT with demographics and fasting biochemical data
Discussion
The high prevalence of T2D, pre-diabetes and gestational diabetes mellitus in Qatar raises the possibility that a high number of subjects with apparent normoglycemia in Qatar are predisposed to developing T2D.23–28 The progression from normoglycemia to pre-diabetes to T2D occurs over a very long time. Both insulin sensitivity and beta cell functions decrease gradually during the development of T2D; lifestyle and environmental factors play an important role. Therefore, we examined the insulin sensitivity among people with normoglycemia in Qatar. Interestingly, we find a wide range of insulin sensitivity among the study subjects despite their relative homogeneity, being young, healthy, euglycemic, male and relatively lean. Consistent with the variations in insulin sensitivity measured by the HIEC, the subjects with the least insulin sensitivity had the highest plasma concentrations of insulin during OGTT, indicating that, as predicted, beta cells increase insulin secretion and compensate for the low insulin sensitivity. The wide range of insulin sensitivity in the study subjects could be due to different genetic backgrounds and/or different environmental exposures that influence insulin sensitivity.33 34 Variations in insulin sensitivity were previously reported in subjects with normoglycemia; however, their samples contained a wide range of BMI (19.5–52.2); the fasting glucose cut-off was in the pre-diabetes range (<6.4 mmol/L); and the study subjects came from different ethnicities.35 Our study subjects were selected to be highly homogenous, being young men with BMI less than 28 and of Arab ethnicity. Further, our cohort was selected to be euglycemic using all the following three criteria: fasting blood glucose below 5.6 mmol/L, 2-hour glucose post 75 g OGTT below 7.8 mmol/L and HbA1c below 5.6%.
The glucose disposal rate, as reflected by the M value, was negatively correlated with both fasting insulin level and AUC of the insulin response to OGTT. This illustrates that maintenance of normoglycemia in subjects with low insulin sensitivity requires high insulin secretion. However, the measured insulin level in the peripheral blood reflects both insulin secretion and insulin clearance. Interindividual variations in hepatic clearance of insulin play an important role in determining the level of peripheral insulin.
The difference in HOMA2-IR levels among the three groups was at the limit of significance (p=0.056). HOMA-IR is a good indicator of insulin resistance in a large cohort that includes a range of euglycemia, pre-diabetes and diabetes. However, in our cohort, all subjects were selected to be normoglycemic by all three criteria: normal fasting blood glucose, normal 2-hour plasma glucose after 75 g glucose challenge and normal HbA1c; in addition, all had BMI below 28. It is therefore plausible that HOMA-IR variations may not be sensitive to reflect different levels of insulin sensitivity in such a homogenous cohort.
Since adiponectin promotes insulin action,36 37 we hypothesized that adiponectin plasma concentrations may be lower in the low sensitivity group; however, we did not observe significant differences in adiponectin levels between the groups. Adipsin is another adipokine secreted by adipose tissues involved in increasing insulin secretion in response to glucose.38 The lack of differences in adiponectin and adipsin levels among the low and high insulin sensitivity groups in our study suggests that insulin sensitivity in this homogenously selected population is not related to adipokine functions and/or subcutaneous adiposity.
CRP is a non-specific marker of inflammation.39 CRP levels were reported to be increased in young Peruvians with insulin resistance,40 and independently associated with fasting hyperinsulinemia in women without diabetes,41 in smokers with insulin resistance42 and in young women with polycystic ovarian syndrome.43–45 Mendelian randomization studies using CRP gene Single Nucleotide Polymorphism (SNP) variations did not reveal a causal relationship between CRP and insulin resistance or incident diabetes, although the association between high CRP levels and insulin resistance was confirmed.46 Brunner et al46 concluded that the associations between serum CRP and insulin resistance, glycemia and diabetes are likely to be non-causal and that inflammation may play a causal role via upstream effectors rather than the downstream marker CRP. In our study, the subjects in the low and intermediate insulin sensitivity groups had higher CRP levels than the subjects in the high insulin sensitivity group; however, other markers of inflammation, TNFRSF1B and sRAGE, were not different among the groups. Our study thus confirms the association of CRP with reduced insulin sensitivity; however, the study does not establish a role of inflammation in the pathogenesis of subclinical insulin resistance.
Oxidative stress is known to play a role in insulin resistance.47 48 We did not find differences in TAC, GPX-1 or oxidized LDL level among the insulin sensitivity groups. However, we found a positive association between oxidized LDL and total insulin secretion during HIEC in our study. Oxidative stress could be a late event in the development of insulin resistance syndromes.49
Previous studies in a Korean population showed higher platelet levels in insulin-resistant individuals and a positive association was observed between platelets and HOMA-IR.50 51 In agreement with the above studies, we also observed a higher platelet count in the least sensitive group. ALT levels were shown to associate with insulin resistance in several studies52–56 of clinically established metabolic disease, such as diabetes, obesity and metabolic syndrome. Interestingly, we also found that ALT levels were significantly higher in the least sensitive group as compared with the other groups, although the individuals tested in the three groups were healthy, young, relatively lean and normoglycemic, and that decreased insulin sensitivity in the lowest sensitivity group was not associated with a clinical syndrome. We performed ELF and NAFLD scores, which showed good correlations with fibrosis stages in chronic liver disease.31 32 Our data showed no significant differences in ELF and NAFLD scores between the groups, suggesting that our subjects most likely did not have hepatic fibrosis; however, we did not perform direct measurement of hepatic fat content and therefore we could not assess the fatty liver status of the study participants.
Further, insulin sensitivity measured by HIEC reflects muscle glucose utilization, as glycogenolysis and glycolysis are suppressed by the high insulin. Therefore, the association of ALT, a hepatic enzyme, with low insulin sensitivity by HIEC is intriguing and suggests a role of ALT in reduced insulin sensitivity outside the liver.57 The positive correlation between HOMA-2-IR and ALT (table 3) in our cohort suggests that HOMA-IR is related to hepatic insulin resistance.
Increased serum albumin level was reported to be associated with insulin resistance in a Korean cohort.58 However, follow-up of incident pre-diabetes for 35 807 person-years revealed that the increase in albumin actually protected progression from pre-diabetes to T2D.59 Interestingly, our study shows that serum albumin levels in the least sensitive group were significantly higher than the most sensitive group. Taken together with the data of Jun et al,59 we suggest that the increase in serum albumin in the low insulin sensitivity group could be a protective physiological reaction against decreased insulin sensitivity. Hemoglobin levels are tightly controlled by insulin resistance inducible factors.60 We observed an increasing trend in hemoglobin with increase in insulin resistance and a significant negative association between M value and hemoglobin level. This observation agrees with a report from Chen et al’s60 study, which also showed that hemoglobin levels increase with increase in insulin resistance. Further Pearson correlation analysis showed a negative correlation between M value and hemoglobin, albumin, triglycerides and insulin AUC and a positive correlation with CRP (table 3).
One limitation of the present study is that we did not measure endogenous glucose production, which might contribute to the variations in the measured M value among the study individuals. However, the high insulin infusion rate in our protocol resulted in a high steady-state plasma insulin concentration in the range of 400 mIU/L (figure 2C); this would result in a complete suppression of endogenous glucose production.13 Thus, the glucose infusion rate during the insulin clamp is a reliable representation of M value. Another limitation of this study is that we did not measure hepatic fat content and thus we cannot rule out the contribution of the liver to overall insulin resistance.
In conclusion, a wide range of insulin sensitivity and differences in CRP concentrations were observed in the participants despite the fact that these subjects were healthy, of the same gender and ethnic background, and with normal glycemia as documented by OGTT and fasting glucose. The striking differences in insulin sensitivity in apparently healthy and relatively homogenous subjects are intriguing and may indicate an increased risk of metabolic disorders in the least sensitive group.
Data availability statement
Data are available upon reasonable request. All underlying data relating to this study will be made available upon reasonable request to the corresponding author.
Ethics statements
Patient consent for publication
Ethics approval
All participants provided informed consent. Protocols were approved by the Institutional Review Board of Hamad Medical Corporation, Qatar (IRB protocol #14224/14).
Acknowledgments
The authors thank Mutasem Shraim RN and Ayat Fared RN for their nursing help, Hamza Rustom, Hoda Isam, Rasha Alsiddig, Elli Concepcion and Bader Alkhalaf for technical help, and Mary Anne Tourette for administrative support.
References
Supplementary materials
Supplementary Data
This web only file has been produced by the BMJ Publishing Group from an electronic file supplied by the author(s) and has not been edited for content.
Footnotes
NS and MA are joint first authors.
Contributors AI, TAS, MR, MA, FM, IB and JJ performed various protein measurements and contributed to the manuscript. NS, MA and ABA-S wrote the manuscript. PC helped with statistical data analysis and contributed to manuscript preparation. IA, MA and SH performed the OGTT and HIEC procedures. TAS, MR and AI prepared the tables and figures for the manuscript. MR and ABA-S revised and edited the manuscript. MS and ABA-S designed the experiments, supervised progress, analyzed the data, and revised and approved the final version of the article. ABA-S accepts full responsibility for the work and/or the conduct of the study, had access to the data, and controlled the decision to publish.
Funding This work was funded by a grant from the Qatar National Research Fund (NPRP-74613117), a member of Qatar Foundation, Doha, Qatar and by the Qatar Metabolic Institute of Hamad Medical Corporation.
Competing interests None declared.
Provenance and peer review Not commissioned; externally peer reviewed.
Supplemental material This content has been supplied by the author(s). It has not been vetted by BMJ Publishing Group Limited (BMJ) and may not have been peer-reviewed. Any opinions or recommendations discussed are solely those of the author(s) and are not endorsed by BMJ. BMJ disclaims all liability and responsibility arising from any reliance placed on the content. Where the content includes any translated material, BMJ does not warrant the accuracy and reliability of the translations (including but not limited to local regulations, clinical guidelines, terminology, drug names and drug dosages), and is not responsible for any error and/or omissions arising from translation and adaptation or otherwise.