Article Text

Abstract
Introduction We aimed to investigate whether the proportion of undiagnosed diabetes varies by socioeconomic status and healthcare consumption, in a Norwegian population screened with glycated hemoglobin (HbA1c).
Research design and methods In this cohort study, we studied age-standardized diabetes prevalence using data from men and women aged 40–89 years participating in four surveys of the Tromsø Study with available data on HbA1c and self-reported diabetes: 1994–1995 (n=6720), 2001 (n=5831), 2007–2008 (n=11 987), and 2015–2016 (n=20 170). We defined undiagnosed diabetes as HbA1c ≥6.5% (48 mmol/mol) and no self-reported diabetes. We studied the association of education, income and contact with a general practitioner on undiagnosed diabetes and estimated adjusted prevalence ratio (aPR) from multivariable adjusted (age, sex, body mass index) log-binomial regression.
Results Higher education was associated with lower prevalence of diagnosed and undiagnosed diabetes. Those with secondary and tertiary education had lower prevalence of undiagnosed diabetes (aPR for tertiary vs primary: 0.54, 95% CI: 0.44 to 0.66). Undiagnosed as a proportion of all diabetes was also significantly lower in those with tertiary education (aPR:0.78, 95% CI: 0.65 to 0.93). Household income was also negatively associated with prevalence of undiagnosed diabetes. Across the surveys, approximately 80% of those with undiagnosed diabetes had been in contact with a general practitioner the last year, similar to those without diabetes.
Conclusions Undiagnosed diabetes was lower among participants with higher education. The hypothesis that those with undiagnosed diabetes had been less in contact with a general practitioner was not supported.
- diagnosis
- epidemiology
- education
Data availability statement
Data may be obtained from a third party and are not publicly available. Data may be obtained from https://uit.no/research/tromsostudy/project?pid=709148.
This is an open access article distributed in accordance with the Creative Commons Attribution Non Commercial (CC BY-NC 4.0) license, which permits others to distribute, remix, adapt, build upon this work non-commercially, and license their derivative works on different terms, provided the original work is properly cited, appropriate credit is given, any changes made indicated, and the use is non-commercial. See: http://creativecommons.org/licenses/by-nc/4.0/.
Statistics from Altmetric.com
Significance of this study
What is already known about this subject?
Low socioeconomic status is associated with higher prevalence of undiagnosed diabetes.
What are the new findings?
Lower education was associated with higher prevalence of undiagnosed diabetes.
Lower income was also associated with undiagnosed diabetes even after adjustment for education.
Nearly 80% of those with undiagnosed diabetes had been in contact with a general practitioner the last year.
How might these results change the focus of research or clinical practice?
Those with low education had higher prevalence and higher proportion of undiagnosed diabetes suggesting that efforts should be directed not only at prevention but also at diagnosis and case finding.
Introduction
Diabetes is a chronic metabolic condition characterized by high blood glucose levels. Type 2 diabetes may especially be unrecognized for several years, and it has been estimated that 25%–50% of all diabetes cases are undiagnosed.1 2 Monitoring the proportion of undiagnosed diabetes is critical to estimate the total diabetes burden and to evaluate public health efforts to prevent and diagnose diabetes. Screening with oral glucose tolerance tests (OGTTs), fasting plasma glucose (FPG) or glycated hemoglobin (HbA1c) may identify slightly different subsets of individuals with diabetes, and result in different diabetes prevalence estimates. Yet, at present, HbA1c has become the method of choice.3 4 Both the American Diabetes Association from 2009, and the WHO from 2011, have recommended HbA1c as the primary diagnostic test.5 6 In Norway, HbA1c has been the preferred diagnostic method from September 2012.7 As HbA1c can be used in a non-fasting state, reflects the average blood glucose in the last 8–12 weeks, and shows limited pre-analytical variation and low day-to-day variation, HbA1c is well suited for diabetes screening.6
There is limited information about time trends in undiagnosed diabetes from repeated population-based screening studies.8–12 Both prevalence and incidence of type 2 diabetes are well known to be substantially higher in people with lower indicators of socioeconomic status such as education.13–16 Fewer studies have investigated undiagnosed diabetes in association with socioeconomic status, but there is reason to believe that the prevalence of undiagnosed diabetes also varies in a similar way with socioeconomic status.1 17–19 However, if both undiagnosed and diagnosed diabetes are more common in those with low education, it is not obvious whether undiagnosed diabetes as a proportion of all diabetes is higher in those with lower education.
An understudied question is to what degree people with undiagnosed diabetes have been seeing a doctor but were nevertheless not tested for diabetes, or they have simply not seen a doctor recently. Such information is important for targeting campaigns to reduce the occurrence of undiagnosed diabetes.
Since 1994, around 47 000 HbA1c samples have been collected in the population-based Tromsø Study.20 21 We aimed to investigate whether the proportion of undiagnosed diabetes varies by educational level and income, and to what degree people with undiagnosed diabetes have been in contact with a general practitioner (GP) in the 12 months prior to the health examination.
Material and methods
Participants
The Tromsø Study is a large population-based prospective study among inhabitants of the Tromsø municipality, North Norway, currently with a population of 77 000. The study was initiated in 1974, and seven surveys (Tromsø 1–7) have been performed to date. We used data from men and women aged 40–89 years participating in Tromsø 4 (1994–1995), Tromsø 5 (2001), Tromsø 6 (2007–2008) and Tromsø 7 (2015–2016),20–22 who answered the question on self-reported diabetes and had at least one HbA1c measurement (see flow chart in online supplemental figure 1 and online supplemental methods). By design, the Tromsø 5 and Tromsø 6 surveys included different participant groups. In Tromsø 5, the largest group comprised individuals who had participated in the previous Tromsø 4 survey as well as a random sample consisted of people in the following age groups: 30, 40, 45, 60 or 75 years. In Tromsø 6, men and women who previously had participated in Tromsø 4, a 10% random sample aged 30–39 years, all individuals aged 40–42 and 60–87 years and a 40% random sample aged 43–59 years were invited.
Supplemental material
Data collection
Trained personnel collected blood samples and data on physiological measurements. Laboratory analyses were performed at the University Hospital of North Norway, except for HbA1c in Tromsø 4 performed at the Laboratory for Metabolic Research at the University of Tromsø and HbA1c in Tromsø 5 performed at the study site laboratory in accordance with the hospital gold standard. HbA1c was analyzed by immunoturbidimetry with Cobras Mira Plus (Unimate 5 HbA1c, F Hoffmann‐La Roche, Basel, Switzerland) (Tromsø 4),23 DCA 2000 (Bayer Diagnostics, Tarrytown, New York, USA) (Tromsø 5), and by high-performance liquid chromatography with Variant II (Bio-Rad Laboratories, Hercules, California, USA) (Tromsø 6)21 and Tosoh G8 (Tosoh Bioscience, San Francisco, USA) (Tromsø 7).
Data from questionnaire and examination
Information on education, income and GP visits was retrieved from questionnaires (online supplemental methods). Attained education level was stratified into three categories: (1) primary and lower secondary, (2) higher secondary (high school or vocational school) and (3) college and university, referred in the paper as primary, secondary and tertiary education. Total household income (in the last two surveys only) was divided in three categories, based on percentiles (<33, 33–66 and over 66). Visit to a GP the previous 12 months was a yes/no question. Height and weight were measured at examination. Body mass index (BMI) was calculated as weight in kilograms divided by the square of height in meters (kg/m2). BMI was stratified into normal (<25 kg/m2), overweight (25–29 kg/m2), obesity class I and II (30–39 kg/m2) and obesity class III (≥40 kg/m2).
Diabetes definition
Known diabetes was defined by the question ‘Do you have diabetes?’ retrieved from questionnaires (details described in the online supplemental methods). Undiagnosed diabetes or screening-detected diabetes was defined as HbA1c ≥6.5% (≥48 mmol/mol), and no self-reported diabetes.
Sensitivity analysis
In Tromsø 7, self-reported diabetes also included the answer category ‘Previously’. We assessed the influence of this on our results by rerunning analyses, including participants reporting previous diabetes in the ‘known diabetes’ category.
Statistical analysis
We estimated the crude and standardized prevalence of known and undiagnosed diabetes in the four surveys, stratified by educational level and other covariates. The various surveys’ data collections included different age groups. Therefore, the prevalence estimates were age standardized to the age distribution in the most recent survey using 5-year age groups. To assess potential influence of adjusting for covariates, we estimated adjusted prevalence ratio (aPR) and 95% CIs with log-binomial regression models and with undiagnosed diabetes as the outcome. The number of individuals with missing data on covariates was generally low and is specified in the footnotes of tables 1 and 2. Missing data were not imputed. In pooled analyses across multiple surveys, we accounted for repeated observations for individuals participating in more than one survey by using clustered robust variance. In addition, we accounted for time trends in education and diabetes prevalence by adjusting for age and period of survey. We assessed the relationship between HbA1c levels in the undiagnosed diabetes group and age, sex, BMI, educational level and household income. We estimated the proportion of participants visiting a GP among those without diabetes and those with undiagnosed diabetes. Stata software was used for data management and statistical analysis (StataCorp, 2019; Stata Statistical Software: V.16; College Station, Texas, USA).
Characteristics of the study participants by survey and diabetes status, the Tromsø Study 1994–2016
Associations between education and prevalence of undiagnosed diabetes, the Tromsø Study 1994–2016
Results
Analyses included 44 678 HbA1c measurements from 27 576 participants (11 619 participated in two or more surveys). The age distribution varied by survey, and the proportion of participants with obesity and tertiary education was higher in the later surveys (table 1).
Diabetes prevalence was slightly higher among men than women throughout all surveys, and age was positively associated with the prevalence of both known and undiagnosed diabetes (online supplemental figure 2). Undiagnosed diabetes as a proportion of all diabetes also tended to increase with age, from around 20% in those aged 40–49 years old to around 30% in those aged 80–89 years old (online supplemental figure 3). Higher BMI was strongly associated with higher prevalence of both diagnosed and undiagnosed diabetes (online supplemental figure 4). Undiagnosed diabetes as a proportion of all cases tended to increase with increasing BMI, with some variation between surveys that may be due to small number of observations in some strata. Online supplemental table 1 presents the mean HbA1c stratified by survey, age and other characteristics in those participants without diagnosed diabetes and in those with undiagnosed diabetes.
Undiagnosed diabetes by education and income
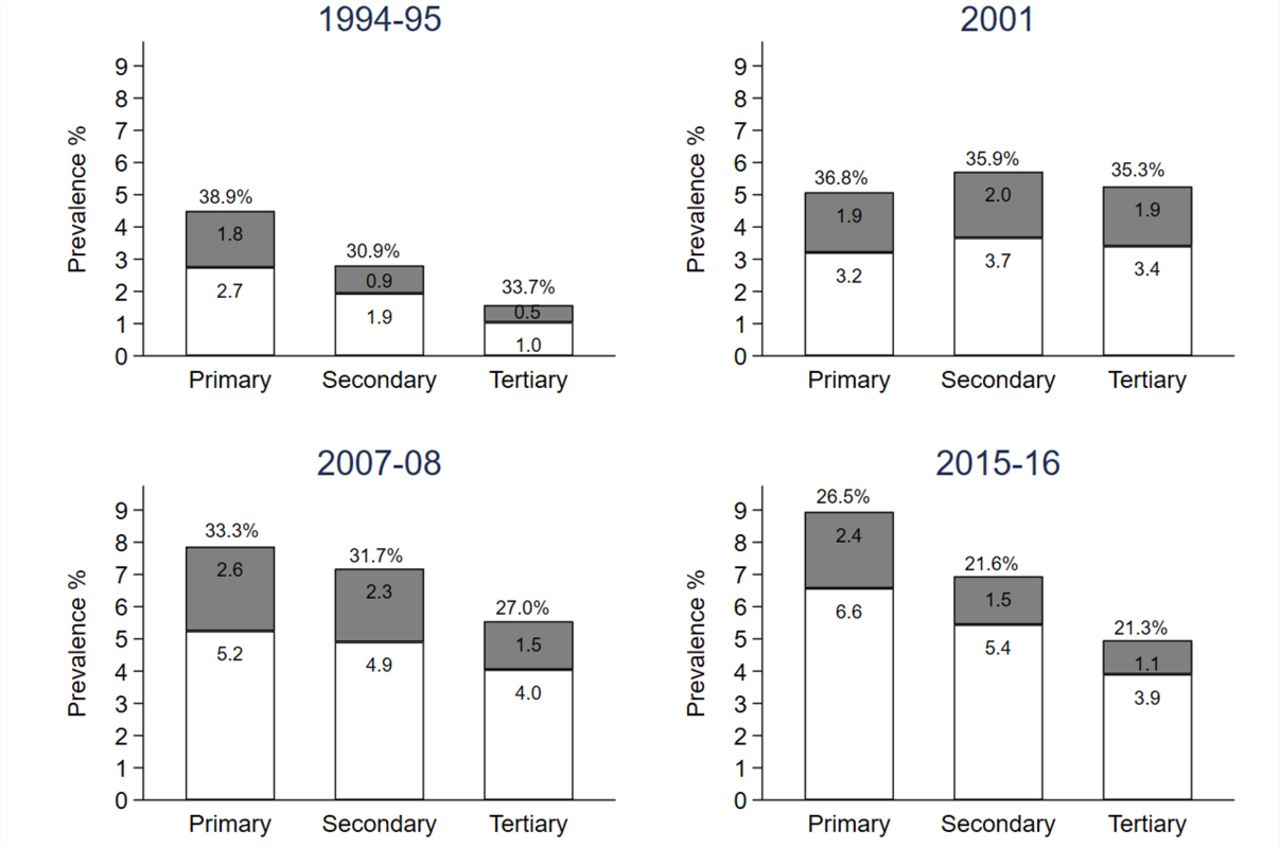
Undiagnosed diabetes, both prevalence and as a proportion of all diabetes, was more common in the group with lowest education and lowest in the group with highest education (figure 1 and table 2). In pooled data from all four surveys, after adjustment for age and sex, the groups with secondary and tertiary education had lower relative prevalence of undiagnosed diabetes (aPR 0.75, 95% CI: 0.63 to 0.88 and 0.54, 95% CI: 0.44 to 0.66, respectively), compared with those with primary education only (table 3). Higher education was inversely associated with undiagnosed diabetes and this association was stronger in women than in men (table 3), with a significant interaction (p=0.04). The educational gradient in undiagnosed diabetes did not significantly vary by time (all p(interaction)>0.16).
Association between education and prevalence of undiagnosed diabetes, the Tromsø Study 1994–2016

Age-standardized diabetes prevalence by educational level in Tromsø 4 (1994–1995), Tromsø 5 (2001), Tromsø 6 (2007–2008) and Tromsø 7 (2015–2016). In white, percentage of known diabetes and in gray percentage of undiagnosed diabetes; defined as HbA1c measurement ≥6.5% (48 mmol/mol) and no self-reported diabetes. The percentage value on the top of the bars represents the proportion of undiagnosed diabetes to all diabetes. HbA1c, glycated hemoglobin.
Household income in Tromsø 6 and 7 was also inversely associated with prevalence of undiagnosed diabetes even after adjustment for education. However, there was no significant association between income and undiagnosed diabetes as a proportion of all diabetes (online supplemental table 2).
Healthcare consumption
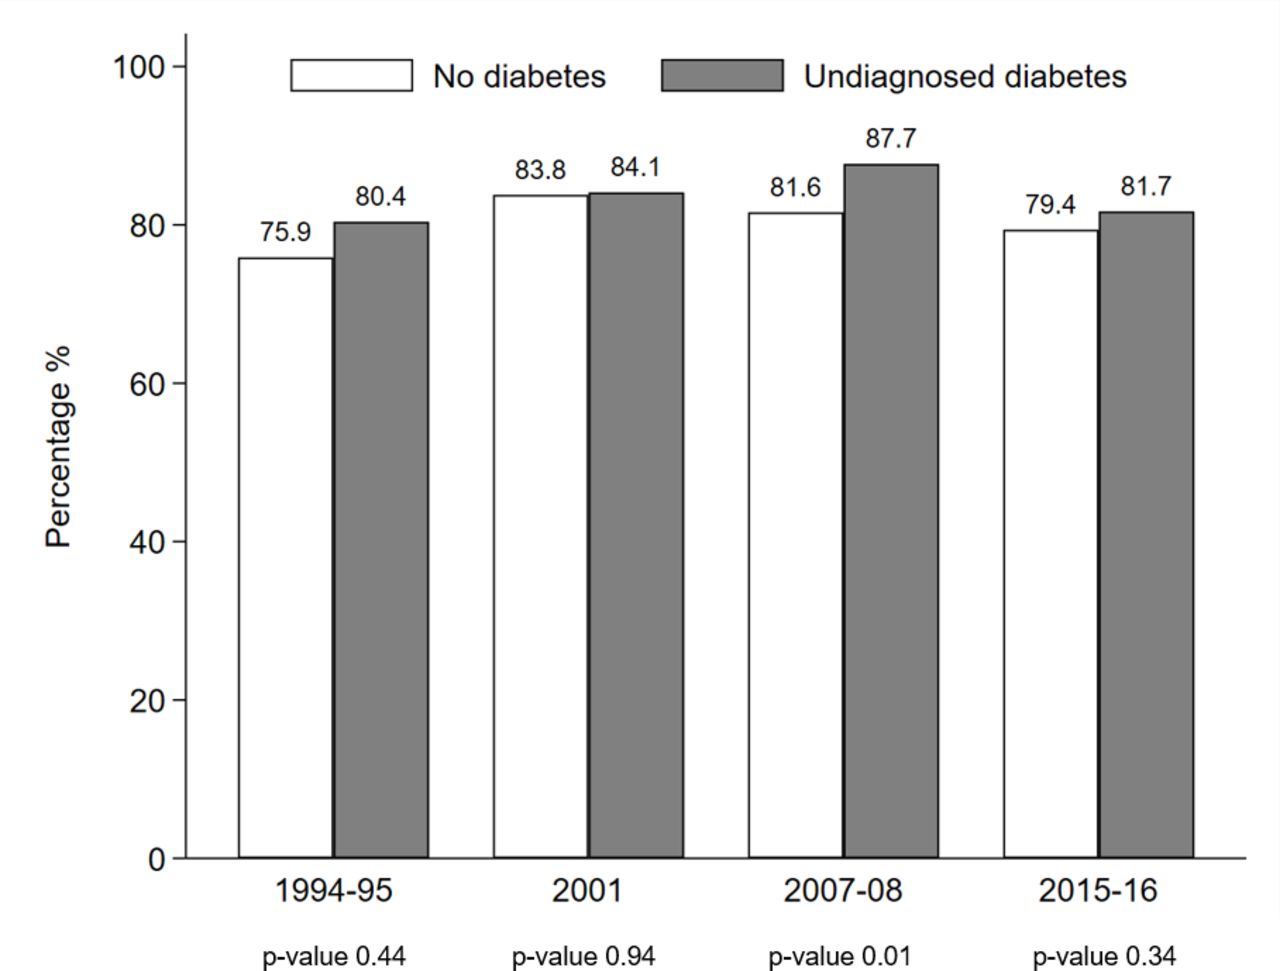
Around 80% people with undiagnosed diabetes had been in contact with a GP in the past 12 months (figure 2), similar to participants without diabetes, and consistent among men and women, age groups, education, income and BMI (online supplemental table 3). After adjustment for sex, age, BMI and education, the OR for GP contact in those with undiagnosed diabetes compared with those without diabetes was non-significant for the four surveys (figure 2).

Percentage of participants who visited a general practitioner during the last 12 months prior to screening visit among participants with undiagnosed diabetes and no diabetes. Tromsø 4 (1994–1995), Tromsø 5 (2001), Tromsø 6 (2007–2008) and Tromsø 7 (2015–2016). In white, percentage of participants without diabetes and in gray percentage of undiagnosed diabetes, defined by an HbA1c measurement ≥6.5% (48 mmol/mol) and not self-reported diabetes. After adjustment for sex, age, BMI and education, the OR for general practitioner contacts in those with undiagnosed diabetes compared with those without diabetes was 1.18 (p=0.64) in Tromsø 4. In Tromsø 5, the OR was 0.84 (p=0.45), in Tromsø 6 the OR was 1.09 (p=0.67) and in Tromsø 7 the OR was 0.80 (p=0.17). Results stratified by sex, age, education, income, and BMI are shown in the online supplemental table 3. BMI, body mass index; HbA1c, glycated hemoglobin.
Sensitivity analysis
We reran the analyses of undiagnosed diabetes in Tromsø 7 by adding those who reported previous but not current diabetes to the group with known diabetes. This resulted in undiagnosed diabetes as a proportion of all cases being lower in Tromsø 7 (20.9%, 95% CI: 18.8 to 23.1), while stratification by educational level showed similar proportions of undiagnosed diabetes cases as in the main analyses, 24.9%, 20.0% and 19.4% for primary, secondary, and tertiary education, respectively.
We studied the influence of repeated participation in previous surveys and related diabetes screening. The repetitive surveys may have influenced the proportion of undiagnosed diabetes in the study population at later time points (online supplemental table 4).
Discussion
Using ~45 000 HbA1c measurements from repeated population-based surveys during 1994–2016 in Tromsø municipality in Norway, we found that the prevalence of undiagnosed diabetes was lower among those with higher education, and we found a similar pattern for undiagnosed diabetes as a proportion of all diabetes. Our hypothesis that people with undiagnosed diabetes tend to seek medical care less often was not supported as most participants with undiagnosed diabetes had been in contact with a GP to the same extent as participants without diabetes.
The proportion of undiagnosed cases depends on the diagnostic criteria used, with a higher prevalence of undiagnosed cases typically found when using OGTT, and to some extent FPG, compared with a definition based on HbA1c.24 25 The Tromsø Study has been repeated at regular intervals and participants were provided information about abnormal values, and we believe that this may have affected the proportion of undiagnosed diabetes and the screening in the Tromsø municipality,12 especially in the Tromsø 5 and Tromsø 6 surveys where many individuals had participated in previous survey.
Social inequality in health is a major public health challenge.26 Understanding determinants of such inequalities is critical to improve the healthcare system and get optimal health treatments to all individuals. A previous study of older women in the UK based on FPG did not report any association between socioeconomic status and undiagnosed diabetes.27 In a study using National Health and Nutrition Examination Survey (NHANES) data (men only), higher proportion of undiagnosed cases was found in those with low education compared with those with high education, consistent with our results.18 Our findings that education and income were associated with undiagnosed diabetes were consistent with a British study on an annual sample from 2009 to 2013.28
It is important to clarify the extent to which people with undiagnosed diabetes have been in contact with the healthcare service, as this could identify a room for improvement in the system and there are few published studies on this topic.11 29 30 Our results indicate that most participants with undiagnosed diabetes had been in contact with a GP during the last 12 months, similar results were found in a Danish study where 72% of those with undiagnosed diabetes had been in contact with their GP.29 Clinical guidelines typically advise GPs to test HbA1c in patients with risk factors such as high BMI, high age, and family history of diabetes. However, many of the screening-identified participants in our study had in fact high BMI or age. In contrast to our findings, studies from Germany30 and the USA11 found that those with undiagnosed diabetes reported less frequent contact with the health system in the previous year.
We could speculate that opportunistic screening for diabetes has increased over time in Norway, based on the decreased proportion in undiagnosed diabetes and the increased availability of HbA1c point-of-care testing. HbA1c was not recommended as a diagnostic test in Norway before 2012, however GPs may have started using the test before that time.
Strengths and limitations
The main strength of the present study was the use of a large population-based sample and a high number of HbA1c measurements. Data collection throughout two decades enabled us to examine the association of education on undiagnosed diabetes prevalence over time. We also provided updated estimates of undiagnosed diabetes across categories by sex, age groups, and BMI. Our study included people born over a long period of time, during which the average educational attainment has increased. We controlled confounding by time trends by adjusting for both age and period of survey.
HbA1c test is highly specific but has poor sensitivity to diagnose diabetes compared with other methods, especially OGTT.31 Some misclassification is therefore expected. Furthermore, we classified cases based on one single test, without the recommended confirmatory test for clinical diagnosis in asymptomatic individuals.11 On balance, however, HbA1c is probably the best single test for use in epidemiological studies.25 During the study period, the WHO diagnostic criteria for diabetes used changed twice. In 1999, the diagnostic cut-off for FPG was lowered from 7.8 mmol/L to 7.0 mmol/L, that may have led to a lower prevalence of known diabetes in the earliest data collection (Tromsø 4). However, before 1999, OGTT was commonly regarded as a gold standard for diagnosis and use for this test in clinical practice would have the opposite effect due to its higher sensitivity. Another limitation of our study is that HbA1c was measured using different methods in the four data collections, and HbA1c instruments were not calibrated across surveys.
The pooled estimate should be interpreted with caution due to differences in sampling procedures across the surveys, although we have adjusted for the main confounders in the regression analysis. Some age groups were over-represented in some surveys, however, we age standardized the data using the last survey (with a high number of participants) to enable comparison between surveys. The pooled results of education and diabetes are driven mostly by results from Tromsø 6 and 7 due to larger number of participants. However, while there was some variation in point estimates of educational gradient over time, this variation was not statistically significant. In the latest survey, the question on self-reported diabetes may have introduced a possibility of misclassification by including an option to report previous but not current diabetes. While diabetes is normally a chronic disease, participants who previously, but not currently received glucose-lowering medication, may have answered that they previously had diabetes. However, the sensitivity analysis did not show any difference in the association with education and undiagnosed diabetes when these participants were included.
Diabetes status was self-reported. While this may be regarded a weakness, several studies had reported a high concordance between self-reported diabetes and medical records.32–34 As most other screening studies, we could not distinguish between type 1 and type 2 diabetes, but type 2 diabetes is known to constitute around 90% or more of all diabetes in this age group. We cannot rule out that some women with previous gestational diabetes may have reported having had diabetes. In the last survey, most of these women are likely to have reported having had diabetes previously (and not currently), and we therefore believe that gestational diabetes erroneously reported as known diabetes has not seriously biased our result (women who were currently pregnant were removed from the analysis so current gestational diabetes cannot have influenced our results).
Population-based studies may be prone to selection bias, due to healthier participants being more willing to participate.35 However, individuals with undiagnosed diabetes may be ‘symptom free’ in most of the cases. The Tromsø Study is representative for the inhabitants of Tromsø municipality in the studied age groups, with most of the participants being Caucasian, however, ethnic minorities are under-represented.
In conclusion, undiagnosed diabetes was lower among participants with tertiary education, both in prevalence and as a proportion of all diabetes. There was no difference in the proportion of participants in contact with their GP among undiagnosed diabetes compared with participants without diabetes. Knowing the proportion of undiagnosed diabetes and the distribution in different socioeconomic strata may help to develop targeted strategies in screening and prevention.
Data availability statement
Data may be obtained from a third party and are not publicly available. Data may be obtained from https://uit.no/research/tromsostudy/project?pid=709148.
Ethics statements
Patient consent for publication
Ethics approval
The Regional Committee for Medical and Health Research Ethics of North Norway approved the current study and analysis (Regional Committees for Medical and Health Research Ethics D, reference number 74507). All the participants have given informed consent before taking part in the study.
Acknowledgments
The authors thank the participants of the Tromsø Study for their participation. The surveys in 1994–1995 and 2001 were conducted in collaboration with The National Health Screening Service.
References
Supplementary materials
Supplementary Data
This web only file has been produced by the BMJ Publishing Group from an electronic file supplied by the author(s) and has not been edited for content.
Footnotes
LCS and HLG are joint senior authors.
Contributors PLDR and LCS had full access to all the data in the study and take responsibility for the integrity of the data and the accuracy of the data analysis. LCS, HLG and LAH were responsible for study concept and design. AEE and GG were responsible for data acquisition, planning and funding. All authors did the analysis or interpretation of data. PLDR wrote the first draft of the manuscript and subsequent revisions. PLDR and LCS performed the statistical analyses. LAH and HLG provided administrative, technical, or material support. All authors critically revised the paper for important intellectual content and approved the final version.
Funding The Tromsø Study has been funded from several sources, including UiT The Arctic University of Norway and Northern Norway Regional Health Authority (Helse Nord RHF). The Norwegian Diabetes Association contributed to funding for HbA1c testing.This research was partly supported by a grant from the South-Eastern Norway Regional Health Authority (Helse Sør-Øst RHF, grant to HLG, to support salary to PLDR, grant number 2019114).
Disclaimer The sponsors had no role in the design and conduct of the study; collection, management, analysis, and interpretation of the data; preparation, review, or approval of the manuscript; and decision to submit the manuscript for publication.
Competing interests None declared.
Provenance and peer review Not commissioned; externally peer reviewed.
Supplemental material This content has been supplied by the author(s). It has not been vetted by BMJ Publishing Group Limited (BMJ) and may not have been peer-reviewed. Any opinions or recommendations discussed are solely those of the author(s) and are not endorsed by BMJ. BMJ disclaims all liability and responsibility arising from any reliance placed on the content. Where the content includes any translated material, BMJ does not warrant the accuracy and reliability of the translations (including but not limited to local regulations, clinical guidelines, terminology, drug names and drug dosages), and is not responsible for any error and/or omissions arising from translation and adaptation or otherwise.