Article Text

Abstract
Introduction Rapid weight gain is often observed following initiation of insulin therapy in children with type 1 diabetes mellitus (T1DM) and girls are particularly at risk of becoming overweight. The authors evaluated body composition changes in children during the first year after diagnosis and related this to markers of cardiovascular risk.
Methods Body mass index (BMI) and body composition measured by whole body dual energy x-ray absorptiometry (DEXA) were assessed in 30 patients (18 boys) with T1DM 3–10 days after diagnosis, 6 weeks later and at 1 year, and on two occasions 1 year apart in 14 controls (8 boys). Cardiovascular risk markers were assessed in T1DM subjects at 1 year.
Results T1DM subjects had lower BMI SD scores (SDS) at diagnosis than controls (mean (SD) BMI SDS −0.67 (1.34) vs 0.20 (1.14), p<0.05) and reduced percentage body fat (20.3% (4.6) vs 24.5% (7.7), p<0.05). T1DM subjects normalised their body composition at 6 weeks and this was maintained 1 year later. Girls with diabetes were thinner than boys at diagnosis (BMI SDS −1.64 (1.02) vs −0.02 (1.17), p<0.05) and at 1 year (BMI SDS −0.58(0.9) vs 0.65 (0.98), p<0.05). Girls had higher glycated haemoglobin (HbA1c) (8.8% (1.2) vs 7.8% (1.0), p<0.05), insulin dose (1.01 (0.30) vs 0.82 (0.18) U/kg/day, p=0.04), total cholesterol (4.30 (0.45) vs 3.79 (0.50) mmol/l, p<0.05) and high-density lipoprotein (2.62 (0.53) vs 2.02 (0.37) mmol/l). High sensitivity C reactive protein and fibrinogen were in the normal range and there were no differences between genders.
Discussion Insulin deficiency at diagnosis of diabetes causes a catabolic state that is predominantly lipolytic. Body composition normalises within 6 weeks of treatment, though girls remain thinner than boys both at diagnosis and 1 year thereafter, in contrast to published findings. Despite girls being prescribed a larger insulin dose, their HbA1c and cholesterol levels are higher at 1 year suggesting increased insulin resistance and cardiovascular risk.
Statistics from Altmetric.com
Introduction
Rapid weight gain is often observed with insulin therapy in children with newly diagnosed type 1 diabetes (T1DM). Although acute changes are often attributed to rehydration, an unknown contribution may arise from the anabolic effect of insulin on lean and fat tissue. Body fat increases substantially in girls during puberty but may be especially marked in girls with diabetes.1,–,4 Furthermore, from early childhood, girls have persistently greater adiposity and are more insulin resistant than boys.5 6 Excess adiposity is associated with adverse cardiovascular risk; diabetic women are more insulin resistant than diabetic men and have greater cardiovascular risk,7 8 whereas in adults without diabetes, men have a greater cardiovascular mortality than women.8
What is already known on this topic
▶ Rapid weight gain is often observed following initiation of insulin therapy in children with newly diagnosed diabetes.
▶ Young people with type 1 diabetes (T1DM), particularly girls, are predisposed to overweight and excess adiposity in later life.
What this study adds
▶ Girls with T1DM were leaner than boys at diagnosis and 1 year later, suggesting the onset of obesity occurs later in the disease.
▶ Body composition in children with T1DM normalises within 6 weeks of starting treatment.
Various markers including total cholesterol, low-density lipoprotein (LDL) cholesterol, fibrinogen and high sensitivity C reactive protein (HSCRP) are associated with adverse cardiovascular events in the general population.9,–,11 In T1DM, hyperfibrinogenaemia was found to be positively associated with components of the insulin resistance syndrome including body mass index (BMI), glycated haemoglobin (HbA1c), total cholesterol and LDL.12 Raised HSCRP is associated with increased risk of cardiovascular disease in the general population10 11 and in adults with diabetes.13
Although there is a tendency towards increased adiposity and risk of cardiovascular disease in patients with T1DM, the tempo of changes in body composition following diagnosis are unknown. We undertook this study to examine the relationship between body composition changes after diagnosis of T1DM and markers of cardiovascular risk.
Methods
Thirty newly diagnosed children with T1DM (0–18 years) and 14 controls were enrolled prospectively during a 1-year period from a single teaching hospital. Subjects were within 1 week of diagnosis of T1DM and after correction of their dehydration and metabolic derangement at presentation.
Measures of height and weight were taken using a wall mounted Harpenden stadiometer (Holtain Ltd, Crymych, Pembrokeshire, UK) and beam scales with BMI calculated as weight (kg)/height2 (metres). Waist circumference (WC) was measured from the front at the narrowest point between the rib cage and the iliac crest after full expiration. Hip circumference was measured from the side at the maximal extension of the buttocks, allowing calculation of the waist to hip ratio. SD scores (SDS) were calculated using UK standards.14 15
Body composition was measured by dual energy x-ray absorptiometry (DEXA; Hologic Discovery QDR, Hologic, Bedford, MA, USA), providing measures of lean mass (fat free body mass), fat mass and percentage body fat. Pubertal status was assessed in all subjects by clinical observation or self-report.16 17
Blood pressure was measured by an automatic portable digital sphygmomanometer (Omron 7051T, Omron Healthcare UK, Milton Keynes, UK) on the right arm, after the patients had been seated for 10 min, and was also converted to SDS using UK standards.
Auxological, body composition and blood pressure measurement were made shortly after diagnosis, at 6 weeks and at 1 year. HbA1c was measured at diagnosis and at each clinic visit, with measurements of HSCRP, fibrinogen and lipids (total, high-density lipoprotein (HDL) and LDL cholesterol and triglycerides) made 1 year after diagnosis.
Age- and sex-matched controls were selected using best friends or siblings and the controls underwent auxological and body composition measurement on two occasions, 1 year apart.
Written informed consent was obtained from each patient and parent or guardian. Ethical approval for the study was obtained from the South and East Wales Local Research Ethics Committee.
Statistical analysis
The study numbers were calculated to detect a difference of 0.5 BMI SDS or 3% body fat by DEXA between groups and within groups over time. All analyses were performed using SPSS V.14.0. Auxological and body composition measurements were compared between groups using unpaired Student t tests and within groups using paired t tests. Univariate analysis was used to compare markers of cardiovascular risk and changes in body composition. HSCRP distribution is skewed towards lower values and normally log transformed for analyses. However, many authors use the categories of <1, 1–3 and 3–10 mg/l to define HSCRP as low, moderate or high cardiovascular risk.10 Based on these categories, non-parametric tests, χ2 test and Mann–Whitney U test were used. Correlations were performed using bivariate correlation and Pearson's correlation coefficient with two-sided significance.
Results
Thirty children (18 boys) with T1DM and 14 controls (8 boys) were recruited. There were no differences in the age of patients and controls (table 1) or their pubertal status. Nineteen patients were prepubertal (63%) eight pubertal (Tanner stage 2–3, 23%) and three postpubertal (Tanner stage 4–5, 13%). Ten controls were prepubertal (71%), three pubertal (21%) and one postpubertal (5%). Two patients were treated with multiple daily injections from diagnosis and 28 patients with twice daily insulin regimens throughout the study.
Weight, WC SDS, BMI SDS, body composition by dual energy x-ray absorptiometry scan and blood pressure SDS
There was no difference between height SDS at diagnosis and at 1 year (−0.02 (0.93) vs (1.00) 0.03, p=0.29). There was no difference in height SDS between patients and controls at diagnosis or at 1 year. At diagnosis, subjects with diabetes had significantly lower BMI SDS and percentage body fat than controls (table 1), although absolute values for fat mass and lean mass were no different. After 6 weeks of insulin treatment, BMI SDS, percentage body fat, fat mass and lean mass were restored and no different to controls. At 1 year after diagnosis, controls and T1DM subjects had similar body composition.
Girls had significantly lower percentage fat at diagnosis (20.7% (3.8)) and at 6 weeks (22.7% (3.3)) compared with control girls at the start of the study (30.5% (7.5), p<0.005) which remained the case at 1 year (24.1% (3.6) vs 30.1% (8.7), p=0.05). Girls with diabetes had a significantly lower BMI SDS than boys at diagnosis (table 2). Although both genders gained BMI SDS, the gender difference remained at 6 weeks and 1 year with girls having a lower BMI SDS than boys. Similarly, the waist to hip ratio was lower in girls with diabetes at diagnosis, 6 weeks and 1 year compared with boys. WC SDS was also lower in girls at diagnosis and at 6 weeks but not at 1 year. Girls with diabetes had a significantly higher HbA1c at 1 year compared with boys, despite receiving a higher daily dose of insulin/kg body weight (table 2) suggesting increased insulin resistance even within this young and predominantly prepubertal cohort.
Gender differences in cardiovascular risk markers, waist:hip ratio, waist circumference SDS, systolic and diastolic blood pressure SDS
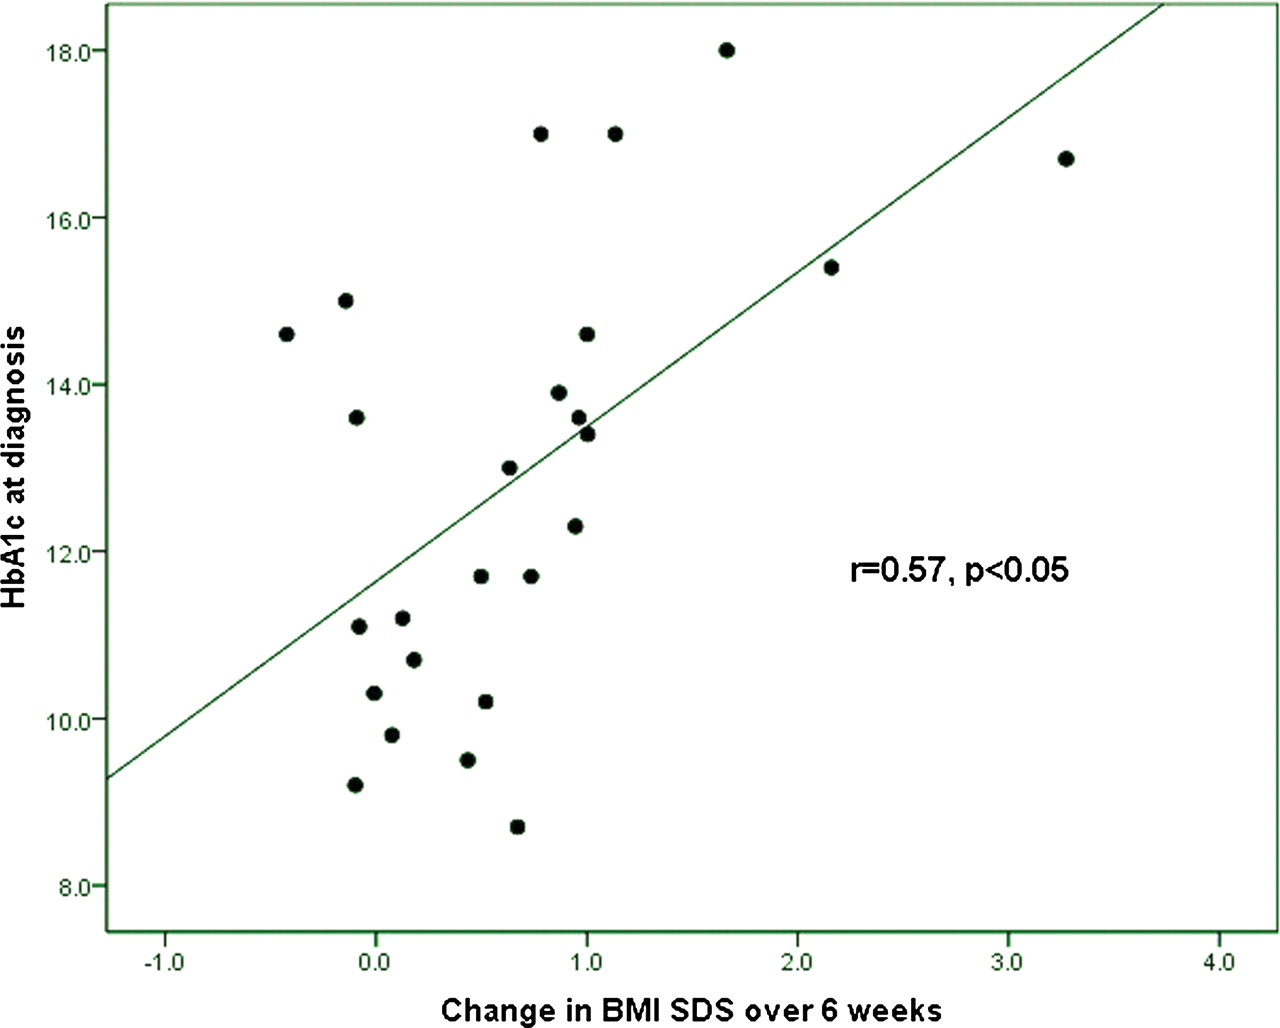
HbA1c at diagnosis correlated with the increase in body fat in grams (r=0.60, p<0.05) and BMI SDS (r=0.57, p<0.005) over the first 6 weeks of treatment (figure 1), suggesting that the magnitude of the changes in body composition over the first 6 weeks was related to the severity of the metabolic prodrome as reflected by HbA1c.

Relationship between glycated haemoglobin (HbA1c) at diagnosis and the increase in body mass index SD scores (BMI SDS) over the first 6 weeks of treatment
All blood pressure measurements were within the normal range for age and gender and there were no differences between patients and controls or between genders. Systolic blood pressure (SBP) SDS reduced over the first 6 weeks in T1DM subjects but there was no difference between SBP SDS at diagnosis and at 1 year. Fibrinogen concentrations were normal (mean (SD) 2.41 (0.46) g/l) in those with diabetes (normal range 2–4.5 g/l for all age groups). The median HSCRP was <0.16 mg/l, with a range of <0.16–2.27 mg/l. The distribution of HSCRP in the diabetic subjects was 30% <0.16 mg/l, 80% <1.00 mg/l and 92% <2.00 mg/l, similar to other data in healthy children.18 Although total cholesterol levels were within the normal range, girls had significantly higher levels than boys (table 2). HDL cholesterol was also higher in girls so that the total cholesterol to HDL ratio was similar in girls and boys.
There were no correlations between lipids, HSCRP or fibrinogen and BMI SDS, waist to hip ratio, WC SDS, HbA1c or insulin dose at 1 year or with changes in BMI SDS over the year. Log HSCRP correlated with fat gain over the year (r=0.51, p<0.05) and increase in percentage body fat in 1 year (r=0.54, p<0.05).
Discussion
Children with newly presenting T1DM have a lower BMI SDS and percentage body fat than controls suggesting that insulin deficiency prior to diagnosis causes a catabolic state which is predominantly lipolytic. Normal body composition was restored within 6 weeks as a result of gaining relatively more fat than lean mass. This observation is consistent with insulin deficiency being associated with a predominantly lipolytic process and insulin administration reversing this effect. The correlation of body composition changes over 6 weeks with HbA1c at diagnosis may reflect the severity of the metabolic prodrome.
Studies in adults19 show that weight lost before diagnosis is mainly fat and that weight gain in the first year after diagnosis comprises a higher proportion of fat than muscle. However, the final weight after a year of treatment was reported to be still lower than the premorbid weight and the final body composition was still lower in fat. Our results are consistent with these findings although they suggest that children recover more rapidly since body composition is restored within 6 weeks. Newly diagnosed children with T1DM have been shown to have a more pronounced food-induced thermogenesis and resting energy expenditure in response to subcutaneous insulin infusion than children with established diabetes suggesting increased sensitivity to insulin at diagnosis, which may account for their relatively quick recovery.20
Lifelong insulin resistance is greater in girls compared with boys5 with differences increasing at puberty.21 Girls also have greater body fat than boys throughout life,6 more markedly after puberty. Adult women with diabetes are known to have increased cardiovascular risk compared with men,7 8 which may be partly related to the differences in body composition and insulin resistance. By contrast, the BMI SDS of girls with T1DM in our study was lower than that of boys at diagnosis, perhaps related to a longer or more pronounced prodrome in girls (suggested by a trend to a higher HbA1c) with greater loss of body fat prior to diagnosis.
At 6 weeks and 1 year, body composition in those with T1DM normalised, but gender differences in BMI SDS remained and were associated with a higher dose of insulin and a higher HbA1c at 1 year, consistent with increased insulin resistance in the girls. Our findings suggest that the onset of obesity in girls occurs in those with more long-term established diabetes and may be related to excessive weight gain in puberty.1,–,3
All blood pressure measurements were within the normal range for age and gender and there were no differences between patients and controls or between genders. The fall in SBP SDS over the first 6 weeks in T1DM subjects was small but may have been related to the stress of diagnosis. Girls have higher total serum cholesterol and HDL concentrations than boys but a similar total cholesterol to HDL ratio. This was unexpected and in contrast to the published differences in lipid profiles of healthy girls and boys.22 23 In addition, most papers report an increased cardiovascular risk in diabetes which is associated with insulin resistance, obesity and central adiposity.24 25 We have shown apparent increased insulin resistance in girls despite their relative leanness at a young age and early stage of T1DM. This is consistent with other adult studies showing worse metabolic profiles and diabetes complications in women with T1DM than men.7 Our findings suggest increased cardiovascular risk in T1DM may start in childhood and adolescence, early in the course of T1DM. We acknowledge that our study has small numbers and larger studies are warranted to examine this further.
In conclusion, our study shows that insulin deficiency at diagnosis of diabetes causes a catabolic state that is predominantly lipolytic. Normalisation of body composition occurs within 6 weeks of starting treatment and the magnitude of these changes may reflect the severity of the metabolic prodrome. Girls have a higher HbA1c than boys despite their increased insulin dose at 1 year. Their relatively reduced BMI SDS compared with boys is consistent with the increased insulin resistance. These findings suggest that obesity in girls with diabetes occurs later after diagnosis. However, these findings together with the presence of raised serum total cholesterol concentrations suggest that a predisposition to later metabolic problems and cardiovascular risk can be detected soon after diagnosis.
Acknowledgments
Department of Medical Biochemistry and Immunology and Department of Special Coagulation, University Hospital of Wales, Cardiff, UK.
References
Footnotes
-
Competing interests None.
-
Ethics approval This study was approved by the South and East Wales Local Research Ethics Committee.
-
Provenance and peer review Not commissioned; externally peer reviewed.