Article Text

Abstract
Aims Diabetic retinopathy screening aims to detect people at risk of visual loss due to proliferative diabetic retinopathy, but also refers cases of suspected macular oedema (maculopathy). At the introduction of screening, ophthalmology was concerned that referral rates would be unmanageable. We report yield of referable disease by referral reason for the first 5 years of the programme.
Methods We extracted screening results from a nationwide clinical diabetes database to calculate annual referral rates to ophthalmic clinics. We used logistic regression to examine associations between clinical measures and referable disease.
Results 182 397 people underwent ≥1successful retinal screening between 2006 and 2010. The yield of referable eye disease was highest in the first 2 years of screening (7.0% and 6.0%) before stabilising at ∼4.3%. The majority of referrals are due to maculopathy with 73% of referrals in 2010 based on a finding of maculopathy.
Conclusions The commonest cause for referral is for suspected macular oedema (maculopathy). Referral rates for retinopathy have stabilised, as predicted, at relatively low rates. However, ophthalmology workload continues to rise as new treatment options (ie, monthly intraocular injections) have unexpectedly increased the impact on ophthalmology. A review of the screening referral path for maculopathy may be timely.
- Epidemiology
- Retina
- Macula
This is an Open Access article distributed in accordance with the terms of the Creative Commons Attribution (CC BY 3.0) license, which permits others to distribute, remix, adapt and build upon this work, for commercial use, provided the original work is properly cited. See: http://creativecommons.org/licenses/by/3.0/
Statistics from Altmetric.com
Introduction
Diabetic retinopathy (DR) is one of the leading causes of visual impairment in the UK,1 and treatment to prevent vision loss requires early detection and careful monitoring to be most effective.2 Following a Health and Technology Board Assessment, Scotland launched a national Scottish DR Screening service (DRS) in 2006. The principal aim of screening was to prevent vision loss due to proliferative DR (PDR), with individuals identified as high risk being referred to eye clinics for assessment and further management. Maculopathy (MAC) did not meet the requirements to justify a screening programme, but as it can be detected on retinal photography, a MAC grading is included in the DRS protocols with referral based on MAC as well as DR grades. Based on pilot data from the Grampian region the expected long-term referral rate from the programme was expected to be 3–4%. This workload was thought to be manageable within existing ophthalmology provision.3 The aim of this study is to report the yield of referable disease over the first 5 years of the DRS (2006–2010), a measure important for health service planning, and to estimate the burden due to referable MAC.
Methods
DRS protocols
The national roll out of the DRS began in 2006 to improve availability of high quality retinal screening in Scotland4 attaining nationwide coverage in 2007. Patients eligible for screening are identified via the national diabetes registry—the Scottish Care Information-Diabetes Collaboration (SCI-DC) database—which automatically captures data on people with a diagnosis code for diabetes and has an estimated current coverage of >99% of the Scottish population with diagnosed diabetes mellitus (DM). All new registrants on SCI-DC who are aged ≥12 years are automatically registered as new patients on the DRS database and this triggers their first appointment. Those who are already attending eye clinics for DM-related eye disease, and those who are too unfit or frail for screening, are suspended from the screening programme with suspensions reviewed at least every 3 years. The screening examination involves a single central 45° field digital photograph with mydriasis if required, and with centralised grading.3 When photographic images are ungradable, slit-lamp examination is undertaken within the screening programme. Slit-lamp examination gradings were not available for all health boards for the whole time course of the study, but where slit-lamp data are available it is included in the results (within this study 4.2% of grades were from slit-lamp exams). The use of a single central field for detection of sight-threatening retinopathy has been validated.5–8 The programme includes internal and external quality control protocols to ensure the quality of the photographs and the grading.9
DRS grading
The grading system in Scotland provides a DR grade and a MAC grade (see online supplementary table S1). Action is determined by the most severe finding in the worst eye with grades of R3 (referable background retinopathy), R4 (proliferative retinopathy) or M2 (referable MAC) triggering referral to a specialist eye clinic. Previous analyses from the pilot phase of the DRS reported an overall referral rate for eye disease of ∼3%.3 ,10 DRS grading data is automatically uploaded into the SCI-DC database. We use the results for the worst eye to determine grading in this study.
Data sources
We used an anonymised extract of SCI-DC data that includes data on all individuals alive and registered on SCI-DC as of 31 May 2008 (the most recent SCI-DC extract data available) which has updated DRS data up to 31 December 2010. Data was extracted from the SCI-DC audit server by an automated process and then cleaned and anonymised prior to use in this study.
Study population
All individuals age >12 years who were registered on SCI-DC with a diagnosis of diabetes before 31 May 2008 and had at least one successful DRS examination were included in this study.
Covariate data
Diabetes type was based on the type listed in SCI-DC by clinicians. Additionally, we employed an algorithm to identify individuals at high risk of being mislabelled, based on age of diagnosis and prescribed treatment. The date of diagnosis for DM was based on the diagnosis date entered into SCI-DC by clinicians, taking the earliest date where multiple dates were entered. This diagnosis date was checked against multiple data sources including prescription and hospital discharge records for any evidence of diabetes prior to the SCI-DC date of diagnosis. Where there is evidence of DM prior to the recorded date of diagnosis we used the earliest date available.
To determine the risk factor profile for cases of referable eye disease we considered risk factor data for those examined in 2008. Measures of Body Mass Index (BMI), HbA1c, serum total cholesterol, systolic and diastolic blood pressure and smoking status were selected from SCI-DC taking the measure made nearest to the screening exam. In order to limit missing risk factor data while retaining a temporal relationship between measure and screening we used a series of cut-points (HbA1c ±180 days, blood pressure ±90 days and BMI or smoking status ±1085 days). If no measure was available the data was considered to be missing. We used prescription data to determine diabetes treatment at the time of the screening examination.
Statistical methods
The proportion of screened individuals with referable eye disease was calculated by year. Where an individual had more than one screening examination in a year the worst result was used. We used univariate and multivariate logistic regression models to examine the role of DM type, age, sex and diabetes duration along with other covariates on risk for referable eye disease. All statistical analysis was undertaken using SAS v.9.2 (Cary, North Carolina, USA). We used a p value of <0.05 to indicate statistical significance.
Results
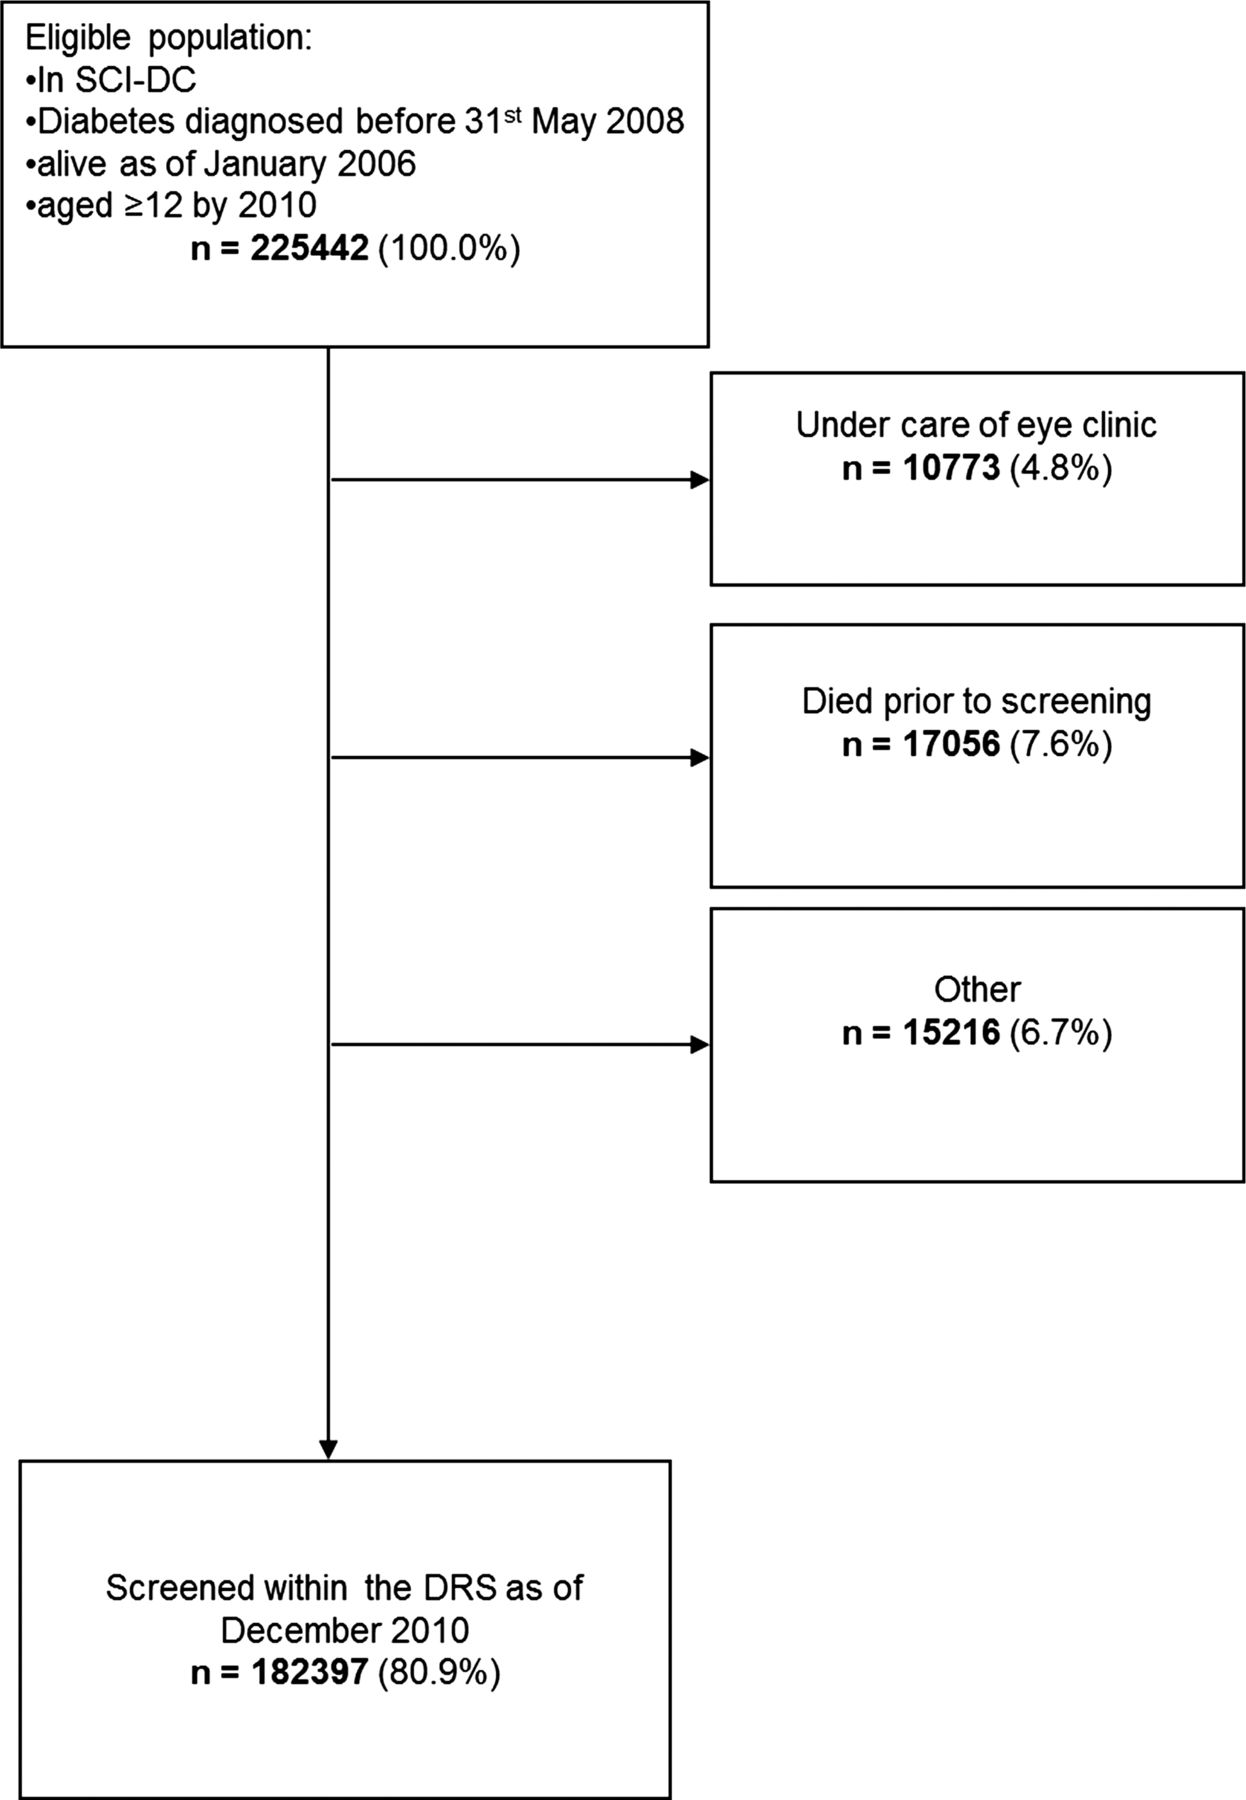
There were 225 442 individuals eligible for inclusion in this study. During the course of the study 187 822 (83.3%) were screened at least once by the DRS, with 182 397 having at least one gradable result (figure 1). Demographics for the study population are shown in table 1.
Baseline demographics for population
Flow diagram to demonstrate use of DRS among individuals from SCI-DC during the period 1 January 2006–31 December 2010. DRS, Diabetic Retinopathy Screening service; SCI-DC, Scottish Care Information-Diabetes Collaboration.
Yield of referable eye disease
We included data on 560 362 screening episodes resulting in gradable images between 2006 and 2010. Slit-lamp examinations accounted for 23 311 (4.8%) of the data. Each individual had a median of three (IQR 2–4) successful screens during the study period and this did not differ by DM type (table 2). The yield of referable eye disease was greatest in the first 2 years of the programme where 7.0% and 6.0% of individuals successfully screened in the DRS had referable disease in 2006 and 2007, respectively. Over time, the proportion of people attending who had attended at least one previous screen by the DRS increased from 23.5% of screens in 2007 to >90% of screens in 2009 and 2010. Referral rates were highest for first-time attendees with 6.9% of first screens finding referable eye disease compared to 3% for people attending their 4th or 5th screen.
Yield of referable eye disease by year of screening
For 2008 and onwards, the yield was stable at 4.3%. For all years, the yield for referable MAC was higher than that for referable DR accounting for between 60% of referrals in 2006 to 73% in 2010. Overall, the referral rates were higher for those screened by slit-lamp (7.2%) than those screened by retinal photography (5.1%).
Referable eye disease by type of diabetes
We excluded 741 individuals from this analysis as they had neither type 1 (T1DM) nor type 2 (T2DM) (eg, MODY, pancreatic causes, etc; table 3). There were 20 521 people with T1DM and 161 135 people with T2DM (table 2). The prevalence of referable eye disease was consistently higher among those with T1DM compared to those with T2DM (table 3). The proportion of referrals due to MAC alone were similar for both types of DM in 2006 (59.0% for T1DM and 60.3% for T2DM), but in subsequent years the proportion rose among the T2DM population to 76.1% in 2010 compared to 63.2% of the referrals among the T1DM population.
Yield of referable eye disease for individuals with type 1 or type 2 diabetes by year of screening
Risk factor profile for referable eye disease
Table 4 shows the risk factor profile by retinal screening grade. Regardless of diabetes type, compared to the no retinopathy group, those with referable disease were more often male, with longer DM duration, higher HbA1c, and higher systolic blood pressure. Additionally, for people with T1DM, referable disease was also associated with older age, higher BMI, higher diastolic blood pressure and higher prevalence of smoking. By contrast, in T2DM, referable disease was also associated with lower prevalence of smoking, lower BMI and greater use of insulin therapy.
Risk factors for referable eye disease for individuals with type 1 or type 2 diabetes in 2008
Compared to people referred for DR, people referred with MAC had shorter DM duration and lower HbA1c values. Additionally, among people with T1DM, MAC referrals tended to be for older women with higher BMI than referrals for DR, whereas for people with T2DM, MAC referral was associated with lower BMI and lower systolic blood pressure,
In multivariate models restricted to those with no missing data (n=78 814) including all covariates and screening mode male sex, longer DM duration and higher HbA1c remained significantly associated with referable disease regardless of DM type. For T2DM, higher blood pressure, lower prevalence of smoking and higher prevalence of insulin use were also associated with referable disease.
In a univariate logistic regression model for the presence of any referable eye disease using data for 2008, the OR for T1DM compared to T2DM was 3.08 (95% CI 2.89 to 3.28, p<0.001), with risk seemingly mediated principally via DM duration (OR for referral due to T1DM 0.81 (95% CI 0.73 to 0.91) after adjustment for age, sex, DM duration and screening method). T1DM was a positive risk factor for referral due to PDR even after adjustment for age, sex and DM duration and screening method (OR=1.35, OR 1.06 to 1.73, p=0.017). However, due to the limited overlap between age and DM duration ranges for the DM types (table 4) these models may not fully account for the covariates.
Discussion
The yield of referable eye disease within the DRS was at its highest during the first 2 years of the programme (2006–2007) when 7% of successfully screened individuals were referred to the eye clinic. Since 2008, the annual referral rate has been stable at 4.3% (∼5500 referrals per year). This suggests that the DRS successfully screened people who had been missed by earlier non-national screening programmes and has now reached a steady level. This workload should be manageable within existing ophthalmology provision.3 In keeping with this, we showed that referable disease was more commonly found at an individual's initial screening which reflects our earlier work on screening intervals.11 However, despite the screening programme being designed for the prevention of sight loss due to PDR, 73% of referrals in 2010 were for suspected macular oedema. That so many of the referrals are due to suspected macular oedema is important as we are facing a shift in treatment options for macula oedema. While patients with diabetic macular oedema used to be routinely offered a finite course of laser treatment, patients are now being offered monthly, indefinite, intraocular injections. As laser for macular oedema cannot restore vision, it was important to offer treatment to patients, even when asymptomatic. However, new treatments restore vision in many, albeit at the cost of indefinite monthly intraocular injections.12 ,13 This new development questions the need to detect patients with macular oedema while they are still asymptomatic, suggesting the way the DRS deals with macula oedema deserves review. Of note, this study is based on the finding of referable disease and, thus, is not influenced by clinical factors that may influence whether an individual attends eye clinic subsequent to screening.
Strengths of the study are the inclusion of data from a national DR screening programme. The DRS methodology has also been validated for detection of sight-threatening DR,5–8 and while there have been adjustments to the grading algorithm over time these changes have not effected the referable disease gradings which have remained consistent. As Scotland also has a means for linking an individual's medical data from a variety of sources (via a unique health identifier the CHI number) we can incorporate clinical data to the DR screening data. There are also weaknesses to the study. Primarily, the current data extract only includes individuals diagnosed with DM prior to 31 May 2008. Therefore, for the years 2008–2010, we are missing data on people with DM diagnosed after 31 May 2008. We do not believe this will have greatly altered the prevalence of referable eye disease reported in the study, as referable disease is very rare in newly diagnosed people with T1DM,14 and in this population <2% of individuals with newly diagnosed T2DM have referable retinopathy at their first screening examination.15 Thus, it is probable that our estimate of yield is higher than the true. We also cannot report outcomes of referral as we lack data from eye clinics.
The reported overall referral rates are in line with those proposed during the pilot stage of the DRS 3 and in keeping with reports of regional data from England.16 The principle risk factors we identified as associated with referable eye disease at screening are in keeping with those reported for DR as a whole, and are independent of the screening method (slit-lamp vs photography), that is, hyperglycaemia, hypertension, DM duration17 and insulin therapy for T2DM.18 The role of BMI as a risk factor for retinopathy is less clear-cut with positive associations reported in T1DM19 and T2DM,20 ,21 while the association we report between lower BMI and referable MAC in T2DM is consistent with findings from the WESDR.18 Similarly, there is inconsistent data for the role of smoking and referable eye disease.22 ,23
In the USA, the prevalence of sight-threatening retinopathy among people with T1DM is as high as 30%.24 In the past, for people with DM of >20 years duration, the prevalence of any DR among people with T1DM approaches 100% 14 compared to ∼60% in people with T2DM.18 ,24 However, recent data from Wisconsin shows a lower prevalence of DR at 20 years DM duration for people diagnosed with T1DM in 1987–1992 compared with those diagnosed prior to 1980.25
While we may see reductions in the prevalence of referable disease over time due to improvements in DM management, the current referral rates indicate a steady rate of new referrals from the national screening programme with the majority a result of referable MAC rather than of referable DR. A review of the referral pathway for MAC to better reflect the changing treatment options could have a significant impact on the screening pathway and on ophthalmology workload.
Acknowledgments
We wish to thank the members of the Scottish Diabetes Research Network (SDRN), the Diabetes Retinal Screening Collaborative and the SCI-DC team. Further, we wish to acknowledge the contributions of the people with diabetes in Scotland, the General Practitioners and Hospital Staff. We also acknowledge the vital work carried out by the retinal screening staff and all who contribute to the work of the Scotland Diabetic Retinopathy Screening collaborative who have been vital to the success of this project.
References
Supplementary materials
Supplementary Data
This web only file has been produced by the BMJ Publishing Group from an electronic file supplied by the author(s) and has not been edited for content.
Files in this Data Supplement:
- Data supplement 1 - Online supplement
Footnotes
-
Contributors HCL researched the data, contributed to the discussion, wrote and edited the manuscript; SON researched the data and reviewed the manuscript; HMC researched the data, contributed to the discussion and edited the manuscript. MWB, DTC, JD, GPL, NL, SP, DWMP and JAO researched the data, contributed to the discussion and reviewed the manuscript. RSL, JAM, ADM and SHW contributed to the acquisition of the data, and reviewed and edited the manuscript. All authors reviewed and approved the final version of the manuscript.
-
Funding This work was supported by the Wellcome Trust through the Scottish Health Informatics Programme (SHIP) Grant (Ref WT086113). SHIP is a collaboration between the Universities of Aberdeen, Dundee, Edinburgh, Glasgow and St Andrews and the Information Services Division of NHS Scotland.
-
Competing interests None.
-
Ethics approval Approval was obtained from the Scotland A Research Ethics Committee, the Caldicott (data privacy) Guardian for the 14 Scottish Health Boards and the ISD Privacy Advisory Committee.
-
Provenance and peer review Not commissioned; externally peer reviewed.