Article Text

Abstract
Background We assessed impacts of a large, nationwide cardiovascular disease (CVD) risk assessment and management programme on sociodemographic group inequalities in (1) early identification of hypertension, type 2 diabetes (T2D) and chronic kidney disease (CKD); and (2) management of global CVD risk among high-risk individuals.
Methods We obtained retrospective electronic medical records from the Clinical Practice Research Datalink for a randomly selected sample of 138 788 patients aged 40–74 years without known CVD or diabetes, who were registered with 462 practices between 2009 and 2013. We estimated programme impact using a difference-in-differences matching analysis that compared changes in outcome over time between attendees and non-attendees.
Results National Health Service Health Check attendance was 21.4% (29 672/138 788). A significantly greater number of hypertension and T2D incident cases were identified in men than women (eg, an additional 4.02%, 95% CI 3.65% to 4.39%, and 2.08%, 1.81% to 2.35% cases of hypertension in men and women, respectively). A significantly greater number of T2D incident cases were identified among attendees living in the most deprived areas, but no differences were found for hypertension and CKD across socioeconomic groups. No major differences in CVD risk management were observed between sociodemographic subgroups (eg, programme impact on 10-year CVD risk score was −1.13%, −1.48% to −0.78% in male and −1.53%, −2.36% to −0.71% in female attendees).
Conclusion During 2009–2013, the programme had low attendance and small overall impacts on early identification of disease and risk management. The age, sex and socioeconomic subgroups appeared to have derived similar level of benefits, leaving existing inequalities unchanged. These findings highlight the importance of population-wide interventions to address inequalities in CVD outcomes.
- health inequalities
- health services
- prevention
- screening
- cardiovascular disease
Statistics from Altmetric.com
Introduction
Cardiovascular disease (CVD) is the leading cause of death globally and a major contributor to inequalities in health.1 In the UK, mortality from coronary heart disease (CHD) has fallen substantially over the past few decades, but rates declined differentially between socioeconomic subgroups with steeper reductions favouring the most advantaged groups.2 3 Time trends in CHD prevalence in the UK have followed a similar pattern, and much of these may be due to inequalities in major cardiovascular risk factors among age, gender and socioeconomic population subgroups.4 Alarmingly, the gap in underdiagnosis of major CVD risk factors remains persistent, and the number of cases of untreated hypertension, undiagnosed type 2 diabetes (T2D) and chronic kidney disease (CKD), and those with elevated levels of estimated CVD risk generally increase with advancing age and lower socioeconomic position, and are often greater in men than women (except of CKD).5–7
In April 2009, the National Health Service (NHS) Health Check was introduced in England to strengthen the country’s primary prevention strategy for CVD, as well as to reduce inequalities in cardiovascular health outcomes.8 The programme involves inviting all residents aged 40–74 years in England without known vascular conditions for a ‘Health Check’ every 5 years.8 Attendees receive a cardiovascular risk assessment followed by appropriate risk management strategies (eg, medication prescribing of statins, referral to smoking cessation, weight management intervention) and healthy lifestyle advice.8
The NHS Health Check principally targets individuals at high risk of having a CVD event, as opposed to the population-wide approach that attempts to lower cardiovascular risk across the population.9 10 Concerns have been raised where interventions focus on high-risk groups or require a higher level of engagement may widen health inequalities if individuals from low-income groups are less likely to attend, which has been described as the ‘Inverse Care Law’.9 11 In our previous evaluation of the NHS Health Check using a nationally representative primary care dataset, we found that the programme was associated with a modest reduction in CVD risks and increased identification of hypertension, T2D and CKD incident cases compared with usual care.12 However, little is known about the differential impacts of the programme between sociodemographic subgroups. Therefore, we extend previous work by examining inequalities in programme impacts on (1) early identification of hypertension, T2D and CKD among age, sex and deprivation population subgroups; and (2) management of CVD risk among people at high risk of CVD by age, sex and deprivation as measured by area-level Index of Multiple Deprivation (IMD).
Methods
Data source
We extracted data from the Clinical Practice Research Datalink (CPRD, http://www.cprd.com/), a large database that routinely collects longitudinal and anonymised electronic medical records from participating general practices in the UK. The CPRD is nationally representative and currently covers approximately 6.9% of the UK population.13 The database undergoes regular data quality checks and is widely used for research studies.13 14 It contains detailed information on patients’ demographics, medical history, laboratory test results (eg, serum cholesterol), drug prescriptions and referrals to secondary care.14
Study population
We obtained a randomly selected sample of 194 248 English patients aged 40–74 years who were registered with a CPRD practice during the first 4 years of the NHS Health Check programme (1 April 2009 to 31 March 2013). Following the eligibility criteria for Health Checks, we excluded 55 460 patients with a previous diagnosis of vascular condition (atrial fibrillation, CHD, CKD, hypercholesterolemia, heart failure, hypertension, peripheral vascular disease, stroke, transient ischaemic attack or diabetes) as shown in online appendix figure 1.15
Supplemental material
Patients were categorised into Health Check attendees and non-attendees. Due to a delay in publicising a universal code for recording Health Check attendance in general practices, we identified attendees based on the recording of four risk factors (blood pressure, Body Mass Index (BMI), cholesterol and smoking status) clustered within a 6-month window when a patient was continuously eligible for the programme. Attendees were assigned a date of Health Check when the last of their four risk factors was recorded. This method has achieved good validity as documented previously.16 Other research studies have consistently reported a high completeness of these risk factor data among attendees who were identified using the universal code.17 18
We considered two groups within our study population: (1) Health Check eligible population as defined earlier and (2) subset of the eligible population with high CVD risk at baseline (online appendix figure 1). We defined high risk as having an estimated global CVD risk score of ≥20%.8 19
Outcome measures
Primary outcomes were the diagnosis of hypertension, T2D and CKD among the Health Check eligible population. Secondary outcomes included 10-year global CVD risk scores, systolic blood pressure (SBP, mm Hg), diastolic blood pressure (DBP, mm Hg), BMI (kg/m2), total cholesterol (mmol/L), prevalence of smoking, prescribing of statins and antihypertensive medications among the high-risk population.
We used the National Institute for Health and Care Excellence (NICE) Framingham algorithm instead of QRISK2 when estimating global CVD risk scores because it was widely used and recommended in the clinical guidelines at the time when NHS Health Check was introduced.16 NICE Framingham risk scores remained very popular before it was removed from the clinical guidelines in 2014, and the small sample size of those identified with QRISK2 score ≥20% in the study cohort meant that robust subgroup analyses were not feasible.20–22 We computed CVD risk scores based on Anderson’s Framingham algorithm and applied adjustments by a factor of 1.4 for South Asian men and 1.5 for those with family history of premature CHD as recommended by UK clinical guidelines at the time.19 23
Statistical analysis
For the purpose of this study, we used a difference-in-differences matching (DIDM) model that has been described in our previous publication.12 In brief, the DIDM model estimates impact of an intervention by computing the average changes in outcome from before to after the intervention among the intervention group, and subtracting from it, the average changes in outcome among the propensity score matched control group. This analytic approach removes biases due to differences in observed characteristics between groups, or due to unobserved heterogeneity fixed over time or following parallel time trends between groups.24
Since the DIDM model requires a comparison of individuals’ outcome data between baseline and follow-up periods around an intervention date, we defined the intervention date as the date of Health Check (see above) for attendees and as the midpoint of the eligibility period (defined by age and registration status of each individual) for non-attendees.
The study population had no diagnosis of hypertension, T2D or CKD at baseline due to their eligibility for Health Check, but we considered a diagnosis of these conditions on or within 3 months after the intervention date to be associated with the intervention.25 We obtained patients’ baseline risk factor data from the latest measurement taken on or within 5 years before the intervention date, and follow-up data from the latest measurements taken after the intervention date but before the end of the study period (31 March 2013). We assumed patients were on medication if they received prescription within 12 months before or after the intervention date for the baseline and follow-up data, respectively.
Before calculating individuals’ CVD risk scores, we used multiple imputation by chained equations to estimate missing BP (17% and 43% missing at baseline and follow-up respectively), BMI (36% missing at baseline and 66% at follow-up) and log-transformed total and high-density-lipoprotein cholesterol data (for skewed distribution, 39% and 59% missing data at baseline and follow-up, respectively) while individuals’ demographic characteristics, smoking status, region (geographical location) and an indicator for Health Check attendance were included as auxiliary variables. We generated 10 imputed datasets and computed individuals’ global CVD risk score on each of them.
We considered subgroups of the study population by patients’ age (37–44, 45–54, 55–64 or 65–74 years), sex (men or women) and quintiles of their practices’ IMD 2010, and assessed inequalities in early identification of hypertension, T2D and CKD by computing the levels of programme impact on changes in the percentage of diagnoses for each subgroup using the DIDM model. IMD is a composite measure of socioeconomic status assigned to each Lower layer Super Output Area (~650 households) in England based on seven principal domains of deprivation (eg, income, employment).26
For the subset of the study population who had high estimated CVD risk at baseline, we used the DIDM model to assess inequalities in risk management by computing the levels of programme impact on changes in global CVD risk, risk factors and prescribing of medications among subgroups of age (37–54, 55–64 or 65–74 years), sex and quintiles of deprivation. This was performed on each imputed dataset and the point estimates and SEs were combined using Rubin’s rules.27
Data management and statistical analyses were conducted using Stata SE V.12.1. We specified kernel matching for the DIDM models and allowed matching to build on these variables—patient’s age, sex, ethnicity (white, non-white or missing), IMD quintile and region. We assigned ethnicity as ‘missing’ for 35.8% of the study population because they had no ethnicity data recorded or preferred not to state it. Baseline levels of clinical risk factors (SBP, BMI, total cholesterol and smoking status) were additionally matched for intermediate outcomes. We compared subgroup differences in programme impact via examining 95% CIs as suggested in literature and used a more conservative interpretation of statistical significance when two CIs had zero overlap, which corresponds to a p value of approximately 0.01.28–30
Results
Our study population comprised 138 788 patients from 462 practices who were eligible for a Health Check between April 2009 and March 2013, and 9.5% (13 167/138 788) were estimated to have high CVD risk at baseline. Moreover, 21.4% (29 672/138 788) of the study population and 31.4% (4130/13 167) of those estimated with high CVD risk at baseline attended a Health Check during the first 4 years. Detailed characteristics of attendees and non-attendees are presented in online appendix table 1.
We observed for the majority of age groups, men and women, and areas of deprivation, a significantly greater identification of incident hypertension, T2D and CKD among Health Check attendees compared with usual care (figure 1). In addition, a significantly greater percentage of incident T2D cases were identified among attendees living in the most deprived areas (1.60%, 95% CI 1.23% to 1.97%) compared with those living in the least deprived areas (0.79%, 0.52% to 1.06%). However, no significant difference in the identification of incident hypertension or CKD cases was observed between attendees across deprivation quintiles, for example, an additional 2.81%, 2.29% to 3.35% and 2.91%, 2.36% to 3.46% of attendees living in the least and the most deprived areas were detected with hypertension with respect to usual care, respectively.

Impact of the National Health Service Health Check on the identification of hypertension, type 2 diabetes and chronic kidney disease among the population who were eligible for a Health Check between April 2009 and March 2013 in England (n=138 788). Sample sizes were 29 672 for attendees and 109 116 for non-attendees before propensity score matching. Adjusted difference—difference in the percentage of new diagnosis between Health Check attendees and non-attendees after propensity score matching. Patients were categorised according to their age in 2009; therefore, some of them may be younger than 40 years old in 2009. Deprivation measure was based on quintile of Index of Multiple Deprivation 2010.
Health Checks may be associated with a significantly greater percentage of men than women identified with hypertension or T2D (eg, an additional 4.02%, 3.65% to 4.39% and 2.08%, 1.81% to 2.35% male and female attendees were identified with hypertension, respectively). Moreover, the programme may be associated with a significantly greater percentage of older attendees identified with hypertension or CKD compared with their younger counterparts, except for hypertension cases identified among attendees aged 65–74 years, but no difference in the identification of T2D incident cases was observed between older and younger attendees.
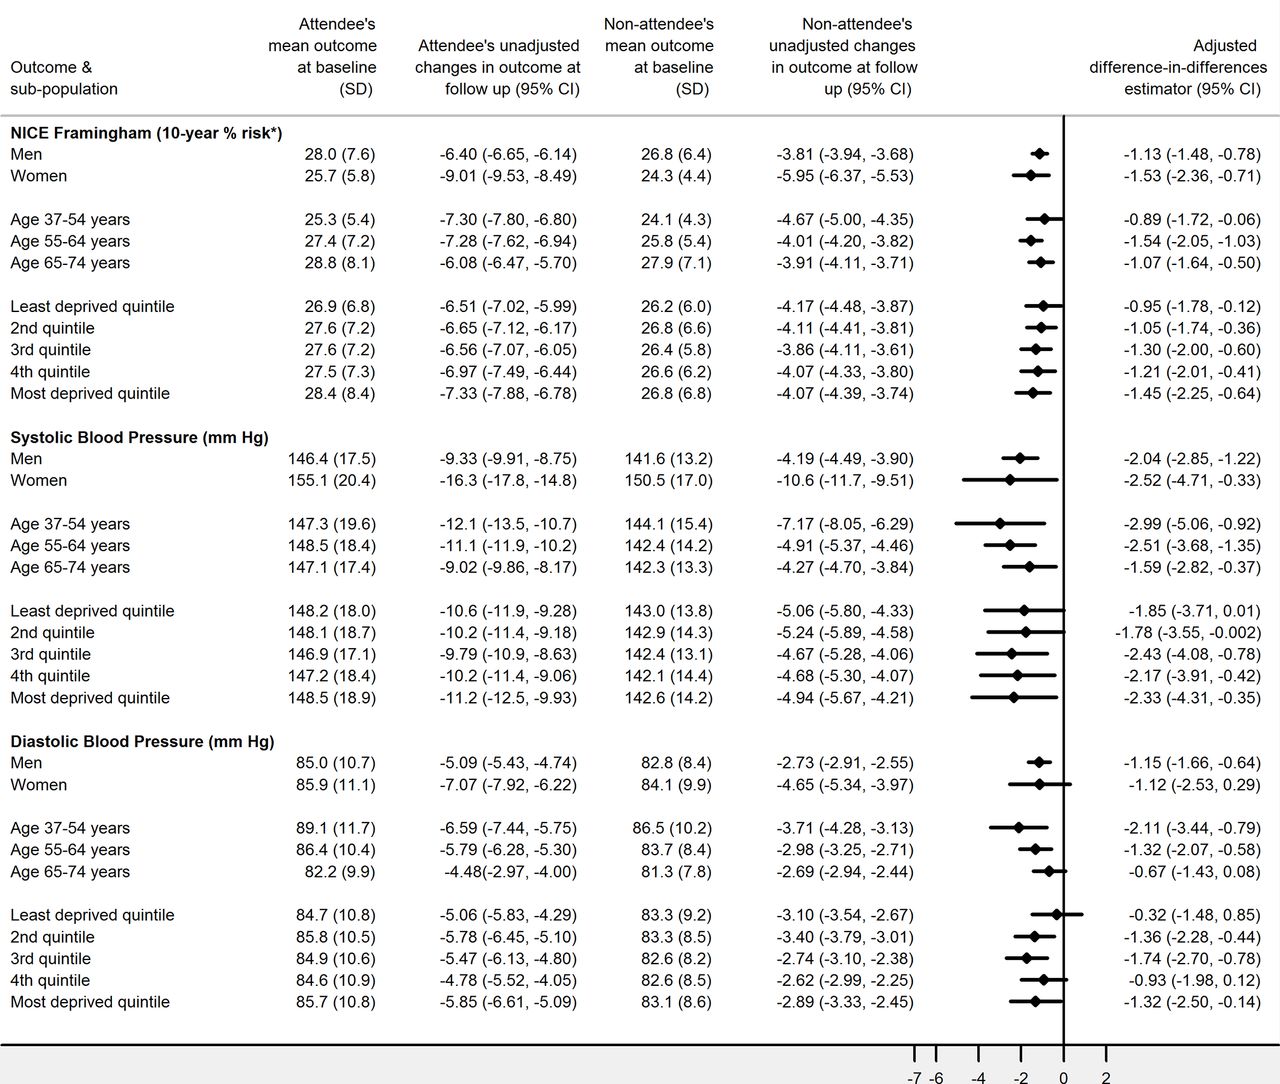
We observed some differences in mean CVD risk (figure 2) and risk factors (figures 2–4) among population subgroups who were estimated to have high CVD risk at baseline. For example, global CVD risk was higher in men than women (28.0% vs 25.7%), SBP was higher in women than men (155.1 mm Hg vs 146.4 mm Hg), total cholesterol was higher in younger than older persons (6.2 mmol/L vs 5.6 mmol/L) and higher smoking prevalence was positively associated with increased levels of deprivation (46.4% vs 28.5% for the most and least deprived quintile, respectively). After a median follow-up time of 2 years, we observed significant reductions in global CVD risk and risk factors, and increased prescribing of statins and antihypertensives (figure 4) in both high-risk cohort of attendees and non-attendees (except for BMI among non-attendees), with considerably larger beneficial effects among high-risk attendees compared with non-attendees.

Impact of the National Health Service Health Check on the management of global cardiovascular disease (CVD) risk and blood pressure among the eligible population with ≥20% CVD risk score* at baseline (n=13 167). *CVD risk score was calculated based on Framingham equations adjusted by a factor of 1.4 for South Asian men and 1.5 for family history of premature coronary heart disease. Adjusted difference-in-differences estimator—difference in the changes in outcome over time between Health Check attendees and non-attendees after propensity score matching. Patients were categorised according to their age in 2009; therefore, some of them may be younger than 40 years old in 2009. Deprivation measure was based on quintile of Index of Multiple Deprivation 2010. NICE, National Institute for Health and Care Excellence.

Impact of the National Health Service Health Check on the management of total cholesterol and Body Mass Index among the eligible population with ≥20% cardiovascular disease (CVD) risk score* at baseline (n=13 167). *CVD risk score was calculated based on Framingham equations adjusted by a factor of 1.4 for South Asian men and 1.5 for family history of premature coronary heart disease. Adjusted difference-in-differences estimator—difference in the changes in outcome over time between Health Check attendees and non-attendees after propensity score matching. Patients were categorised according to their age in 2009; therefore, some of them may be younger than 40 years old in 2009. Deprivation measure was based on quintile of Index of Multiple Deprivation 2010.

Impact of the National Health Service Health Check on the management of smoking prevalence and medication prescribing among the eligible population with ≥20% cardiovascular disease (CVD) risk score* at baseline (n=13 167). *CVD risk score was calculated based on Framingham equations adjusted by a factor of 1.4 for South Asian men and 1.5 for family history of premature coronary heart disease. Adjusted difference-in-differences estimator—difference in the changes in outcome over time between Health Check attendees and non-attendees after propensity score matching. Patients were categorised according to their age in 2009; therefore, some of them may be younger than 40 years old in 2009. Deprivation measure was based on quintile of Index of Multiple Deprivation 2010.
When compared with usual care, additional reductions in global CVD risk, SBP and total cholesterol were observed in most subgroups of high-risk attendees whereas statin prescribing increased. However, the estimated programme impacts were not significantly different among attendees of different age groups, sex or quintiles of deprivation. For instance, the observed reductions in global CVD risk relative to usual care were −1.13% (−1.48% to −0.87%) in male and −1.53% (−2.36% to −0.71%) in female high-risk attendees, respectively.
Discussion
Main findings
The NHS Health Check programme may be associated with the identification of more incident cases of hypertension and T2D in men than women, and more incident cases of hypertension identified among older compared with younger attendees. Moreover, we observed that the programme may be associated with the identification of more incident cases of T2D among attendees living in more deprived areas compared with affluent areas. However, the incident cases of hypertension or CKD identified at follow-up were not found significantly different between socioeconomic subgroups. Since the burden of underdiagnosed hypertension, T2D and CKD in England is sociodemographically patterned, it is expected that more incident cases will be identified in some subgroups than the others (eg, more undiagnosed cases in deprived than affluent areas, in older than younger persons and in men than women except for CKD).5–7 Given this, our findings indicate that the Health Check programme may have only modest impacts in reducing inequalities in the identification of undiagnosed cases.
Furthermore, the reductions in global CVD risk that may be attributable to the programme did not differ between age, gender and deprivation subgroups, which implies the existing inequalities in CVD risks may have remained unchanged. This includes inequalities in higher smoking prevalence among high-risk attendees living in more deprived than more affluent areas; higher global CVD risks in male compared with female high-risk attendees; higher levels of DBP, total cholesterol and BMI among younger than older high-risk attendees; and higher global CVD risks were observed among those living in the most deprived than most affluent areas.
Comparison with other studies
Only a few previous studies have assessed the effects of NHS Health Check on the detection of vascular conditions, and most studies did not examine inequalities between population subgroups. In a previous national evaluation of the NHS Health Check, greater detection of T2D incident cases was identified among male and older attendees compared with female and younger attendees.22 Another study that evaluated a local Health Check programme in Leicester City also observed greater T2D, hypertension and CKD incident cases detected among older than younger attendees and among male than female attendees except for CKD incidence.31 Our findings on the absolute reductions in CVD risk and increases in statin prescribing among age, gender and deprivation subgroups of high-risk attendees are largely consistent with that reported in previous studies.21 22
Although the longer term impact of the programme on inequalities requires further evaluation, two recent microsimulation studies have modelled the future health benefits attributable to the programme.32 33 One of these studies that modelled cardiovascular outcomes suggests that the programme is generating population-level health benefits while reducing health inequalities.32 However, the other study showed that compared with universal screening for the primary prevention of CVD (NHS Health Check), combined population-wide interventions with targeted Health Check among the most deprived populations may be a more effective and equitable strategy.33
Strengths and limitations
This study has several strengths and limitations. The NHS Health Check programme was rolled out nationally in England after inception, thus no natural control group was considered in its design. We assessed programme performance in the first 4 years while not all eligible patients have attended a Health Check and employed a robust quasi-experimental study design that permits causal inference of policy impact to be exploited.34 Moreover, we used propensity score matching to ensure that the observed characteristics of Health Check attendees and matched non-attendees were similar, thereby reducing biases due to individual’s self-selection to participate in the programme as previously identified.16 However, the potential for residual bias due to unobserved variables may not be ruled out completely.
Our study is limited by the poor initial coding of Health Check attendance in general practice information systems due to the delay in publicising a universal code. Although our definition of Health Check attendance may have resulted in some misclassification in our sample, an increasing number of studies have reported high completeness of major risk factors data among attendees and our definition has been previously validated.16–18 Missing data were encountered when we assessed programme impacts on changes in risk factors, and these were estimated using multiple imputation by chained equations that is robust when data are missing at random. We justified this by including all variables that may be predictive of the missing risk factors in our dataset. In the recently updated clinical guidelines for lipid modification, QRISK2 became the sole recommended CVD risk algorithm while the threshold for high CVD risk reduced from 20% to 10%. This implies that more patients within our study population will be eligible for statin treatment and this may affect programme performance. Prescribing of statins is the result of mutual agreement between patients and their general practitioners, but many patients may have opted out as shown by the low number of statin prescriptions among the high-risk cohort in our study. Finally, we were unable to assess differential impacts of the programme between ethnic groups due to the small number of ethnic minority patients estimated with CVD risk scores ≥20% in this nationally drawn sample.
Policy implications
The NHS Health Check has been delivered with aims to prevent CVD, detect undiagnosed disease and reduce inequalities in health.35 Local authorities in England were given full autonomy to expand the programme tailoring to the needs of their local population, but the initial planning of the programme was poor as reflected by the slow progression in coverage observed in most areas of England.8 16 Public Health England has recently issued the ‘NHS Health Check health equity audit guidance’ that aims to support local governments in assessing and monitoring equity of access and health outcomes associated with the programme,35 but its effectiveness awaits evaluation.
Health Checks are often criticised as an intervention focusing on people at high CVD risk requires active engagement from the individual and therefore may disfavour socially disadvantaged groups with limited resources.9 11 On the contrary, population-wide interventions aim to reduce CVD risks across the whole population, resulting in an overall shift in the population distribution of risk. There has been an increasing number of studies documenting the effectiveness of population-wide approaches in reducing inequalities in health outcomes while the high-risk approaches generally show the opposite.36 37 For example, population-wide interventions such as raising the prices of tobacco products have consistently been found associated with reduced socioeconomic inequalities in smoking prevalence.36 However, high-risk, individually focused smoking cessation support appeared to have widened socioeconomic inequalities in many studies.36 Our findings provide support for the view that high-risk approaches may not be the most effective in reducing inequalities in cardiovascular health. Staying with the example of tobacco, our findings suggest that the NHS Health Check may have failed to reduce overall levels of socioeconomic inequalities in smoking prevalence. These findings are concerning and raise an important question of the relative benefits of investing in similar CVD risk assessment and management programmes, as recommended by WHO,38 at the expense of population-wide approaches, especially in low-income and middle-income countries where healthcare resources are much limited.
Conclusions
During 2009–2013, the NHS Health Check had low attendance and small overall impacts on early identification of disease and risk management. The age, sex and socioeconomic subgroups appeared to have derived similar level of benefits, leaving most existing inequalities in case finding and CVD risks unchanged. These findings highlight the importance of population-wide interventions to address inequalities in CVD outcomes.
What is already known on this subject
The National Health Service (NHS) Health Check is one of the world’s largest cardiovascular disease (CVD) risk assessment and management programmes, and was implemented in April 2009 in England.
Previous studies reported greater detection of hypertension and type 2 diabetes, and clinically small but significant reductions in global CVD risk following a Health Check.
Few research studies have examined the differential impacts of the NHS Health Check between sociodemographic subgroups, and no control group has been considered.
What this study adds
Between 2009 and 2013, the NHS Health Check had small overall impacts on early identification of disease and risk management, and the age, sex and socioeconomic subgroups appeared to have derived similar level of benefits, leaving existing inequalities unchanged.
Individually focused risk assessment programmes should be implemented alongside population-wide interventions to address known inequalities in CVD outcomes.
Acknowledgments
The Public Health Policy Evaluation Unit is grateful for support from the NIHR School of Public Health Research. Imperial College London is grateful for support from the NIHR Imperial Biomedical Research Centre and the NIHR CLAHRC for Northwest London.
References
Footnotes
Contributors CM and AM set up the study concept. KC, EPV and CM designed the study. KC analysed the data. EPV, RP and JTL advised and reviewed statistical analysis. All authors discussed data analyses and interpreted the results. KC, EPV, CM and AM wrote the first draft of the manuscript. All authors critically revised and approved the final manuscript. KC has full access to all the data used in the study and takes responsibility for the integrity of the data and the accuracy of the data analysis. KC is the guarantor.
Funding This study is an independent research commissioned and funded by the NIHR Policy Research Programme (National Evaluation of the NHS Health Check Program 009/0051). KC and CM are funded through an NIHR Research Professorship awarded to CM.
Disclaimer The views expressed in this article are those of the authors and not necessarily those of the NHS, the NIHR, the Department of Health, ‘arms’ length bodies or other government departments.
Competing interests AM is a GP Principal in a general practice that takes part in the NHS Health Check programme.
Patient consent Not required.
Ethics approval CPRD Independent Scientific Advisory Committee (protocol no. 12_039).
Provenance and peer review Not commissioned; externally peer reviewed.
Data sharing statement No additional data available. Patient-level data were obtained under license and remain the property of the Clinical Practice Research Datalink.