Article Text

Abstract
Objective To evaluate the German Diabetes Risk Score (GDRS) among the general adult German population for prediction of incident type 2 diabetes and detection of prevalent undiagnosed diabetes.
Methods The longitudinal sample for prediction of incident diagnosed type 2 diabetes included 3625 persons who participated both in the examination survey in 1997–1999 and the examination survey in 2008–2011. Incident diagnosed type 2 diabetes was defined as first-time physician diagnosis or antidiabetic medication during 5 years of follow-up excluding potential incident type 1 and gestational diabetes. The cross-sectional sample for detection of prevalent undiagnosed diabetes included 6048 participants without diagnosed diabetes of the examination survey in 2008–2011. Prevalent undiagnosed diabetes was defined as glycated haemoglobin ≥6.5% (48 mmol/mol). We assessed discrimination as area under the receiver operating characteristic curve (ROC-AUC (95% CI)) and calibration through calibration plots.
Results In longitudinal analyses, 82 subjects with incident diagnosed type 2 diabetes were identified after 5 years of follow-up. For prediction of incident diagnosed diabetes, the GDRS yielded an ROC-AUC of 0.87 (0.83 to 0.90). Calibration plots indicated excellent prediction for low diabetes risk and overestimation for intermediate and high diabetes risk. When considering the entire follow-up period of 11.9 years (ROC-AUC: 0.84 (0.82 to 0.86)) and including incident undiagnosed diabetes (ROC-AUC: 0.81 (0.78 to 0.84)), discrimination decreased somewhat. A previously simplified paper version of the GDRS yielded a similar predictive ability (ROC-AUC: 0.86 (0.82 to 0.89)). In cross-sectional analyses, 128 subjects with undiagnosed diabetes were identified. For detection of prevalent undiagnosed diabetes, the ROC-AUC was 0.84 (0.81 to 0.86). Again, the simplified version yielded a similar result (ROC-AUC: 0.83 (0.80 to 0.86)).
Conclusions The GDRS might be applied for public health monitoring of diabetes risk in the German adult population. Future research needs to evaluate whether the GDRS is useful to improve diabetes risk awareness and prevention among the general population.
- A1C
- Risk Assessment
- Validation
- Risk Factor Modeling
This is an Open Access article distributed in accordance with the Creative Commons Attribution Non Commercial (CC BY-NC 4.0) license, which permits others to distribute, remix, adapt, build upon this work non-commercially, and license their derivative works on different terms, provided the original work is properly cited and the use is non-commercial. See: http://creativecommons.org/licenses/by-nc/4.0/
Statistics from Altmetric.com
Key messages
In a nationwide cohort of German adults, the most recently updated version of the German Diabetes Risk Score—both as a comprehensive and simplified tool—showed an excellent discrimination for 5-year risk prediction of diagnosed type 2 diabetes.
In a nationwide cross-sectional sample representative of the German adult population, the most recently updated version of the German Diabetes Risk Score—both as a comprehensive and simplified tool—showed an excellent discrimination for detection of prevalent undiagnosed diabetes.
The German Diabetes Risk Score might be applied for public health monitoring of diabetes risk in the German adult population.
Introduction
Several diabetes risk scores have been developed in different countries, intended either to predict risk for future type 2 diabetes or to detect undiagnosed diabetes.1–6 Performance of a risk score is usually weaker in external populations than in the original population in which it was developed.2 ,7 Moreover, the performance of a risk score may vary by its application in different countries.6 Therefore, risk scores should be validated within the target population prior to their practical application.2
The German Diabetes Risk Score (GDRS) was developed for application as an online tool based on data of the European Prospective Investigation into Cancer and Nutrition (EPIC)-Potsdam for prediction of the 5-year risk to develop type 2 diabetes.8 Further, it is recommended as a primary screening tool for diabetes in the practice guideline of the German Diabetes Association.9 The original GDRS version included information on age, anthropometric measures, history of hypertension, and lifestyle factors.8 It was subsequently extended by information on family history of type 2 diabetes.10 Recently, the GDRS was further updated to refine information on dietary variables and smoking.11 ,12 In addition, a simplified paper version of the GDRS was developed.11 ,13
Until now, validation of the comprehensive GDRS tool is limited to the first versions based on regional samples from Germany or other European countries6 ,8 ,10 ,14–16 and validation of the simplified GDRS tool has not been performed. Therefore, we aimed to validate the most recently updated comprehensive GDRS—and in additional analyses, also the simplified GDRS—for (1) prediction of incident diagnosed type 2 diabetes in a nationwide longitudinal sample and (2) detection of prevalent undiagnosed diabetes in a nationwide cross-sectional sample representative of the German population aged 18–79 years.
Research design and methods
Health interview and examination surveys
The ‘German National Health Interview and Examination Survey 1998’ (GNHIES98; 1997–1999) comprises a representative sample of the non-institutionalized population in Germany aged 18–79 years.17 For the ‘German Health Interview and Examination Survey for Adults' (DEGS1; 2008–2011), eligible participants of GNHIES98 were invited to re-participate (response: 62%). To retain a representative cross-sectional sample of the non-institutionalized population in Germany aged 18–79 years, this sample was extended by a sample of first-time invitees (response: 42%).17 ,18 Both surveys were approved by the Federal Commissioner for Data Protection and DEGS1 was approved by the Ethics Committee of the Charité-Universitätsmedizin Berlin (number EA2/047/08). All participants provided written informed consent.18
Study population
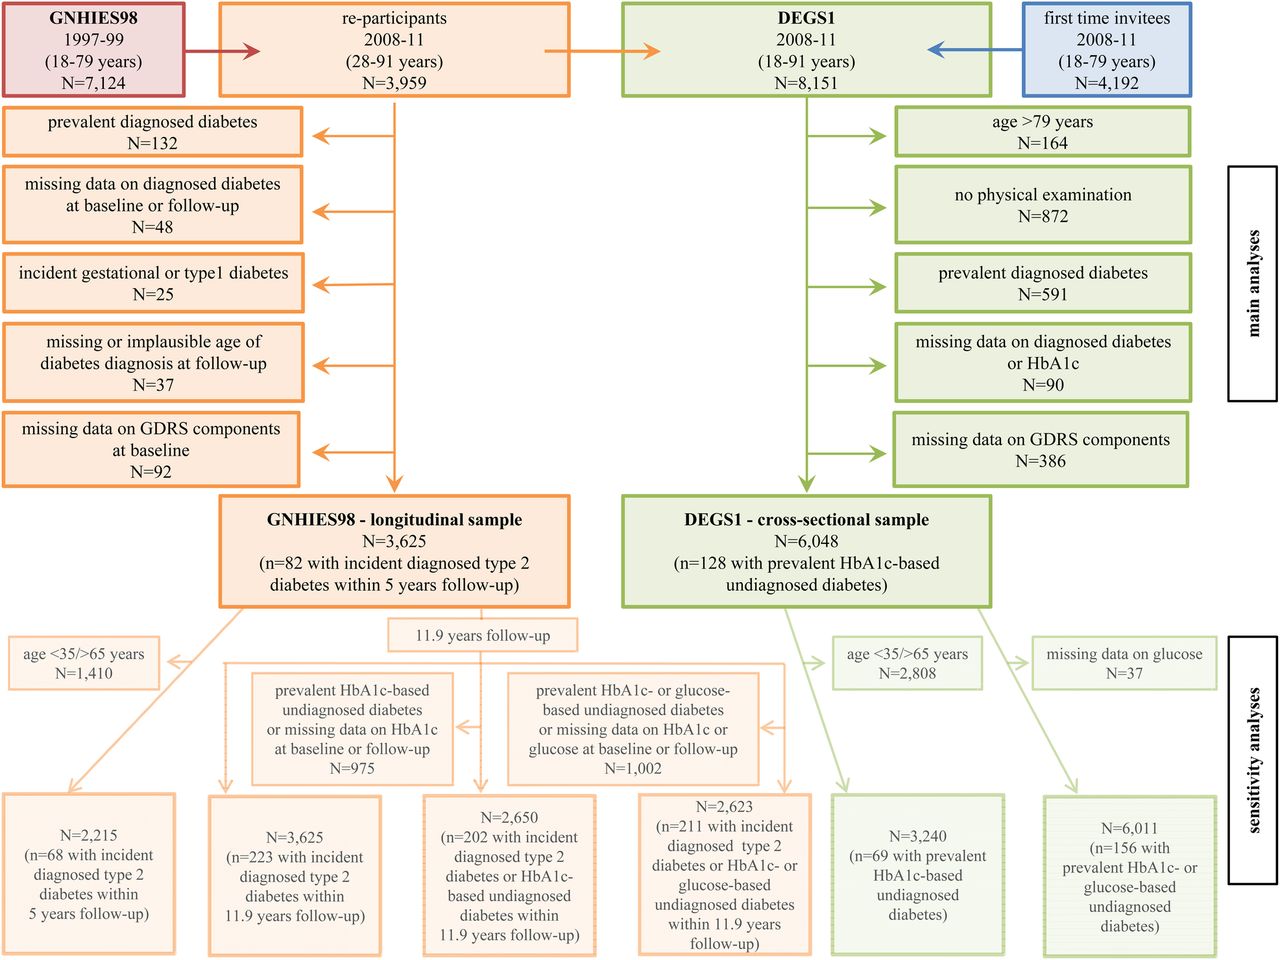
Figure 1 depicts the overall flow chart of the study population. In the longitudinal analysis, persons who participated in GNHIES98 (baseline) and DEGS1 (follow-up, n=3959) were considered. Exclusion criteria are shown in figure 1. The final ‘GNHIES98—longitudinal sample’ for validating the GDRS for prediction of incident diagnosed type 2 diabetes included 3625 subjects.

Participant flow diagram for the ‘GNHIES98—longitudinal sample’ and the ‘DEGS1—cross-sectional sample’. DEGS1, German Health Interview and Examination Survey for Adults; GDRS, German Diabetes Risk Score; GNHIES98, German National Health Interview and Examination Survey 1998; HbA1c, glycated haemoglobin.
In the cross-sectional analysis, DEGS1 participants aged 18–79 years who completed the examination part (n=7115) were considered. Exclusion criteria are displayed in figure 1. The final ‘DEGS1—cross-sectional sample’ for validating the GDRS for detection of prevalent undiagnosed diabetes included 6048 subjects.
Ascertainment of diabetes status
Incident diagnosed type 2 diabetes was defined as physician diagnosis of diabetes or intake of antidiabetic medication reported for the first time at follow-up. Incident cases of type 1 or gestational diabetes were excluded as previously described.19 Since the GDRS was developed for prediction of the 5-year diabetes risk, we only considered those who developed type 2 diabetes within the first 5 years of follow-up as incident cases in the main analyses.
Prevalent undiagnosed diabetes was defined according to the glycated haemoglobin (HbA1c)-diagnostic criterion recommended by the American Diabetes Association.20 HbA1c was measured in previously thawed whole blood with an immunoturbidimetric method using the Architect ci8200 device (Abbott, Wiesbaden, Germany).21 We relied solely on HbA1c as a diagnostic criterion in the main analyses since fasting glucose was only obtained in a non-random subsample. However, in a sensitivity analysis, we additionally considered glucose values by using different cut-offs for the fasting and the non-fasting subsamples.9
Assessment of GDRS components
The GDRS includes the following components: age, waist circumference, height, history of hypertension, physical activity, smoking, family history of diabetes, intake of red meat, wholegrain and muesli, and coffee consumption.11 While the comprehensive GDRS version considers continuous risk factor units where applicable, the simplified version exclusively considers categorized units.11
In GNHIES98 and DEGS1, these components were measured as follows. Information on smoking and sport activity was assessed by standardized self-administered questionnaires. Smoking status was assessed as never, daily, occasional, or former smoking including the number of cigarettes smoked per day. For calculation of GDRS points in the current study, daily smoking and occasional smoking were aggregated into current smoking. Regular sport activity was assessed by five categories (‘no sport’, ‘<1 hour/week’, ‘1–2 hours/week’, ‘2–4 hours/week’, ‘>4 hours/week’). For calculation of GDRS points in this study, the mean time of each category was assigned to create a quasi-continuous variable (0, 0.5, 1.5, 3.0, 4.5 hours/week).
Standardized physician administered interviews were used to assess physician-diagnosed hypertension in surveys and parental history of diabetes in DEGS1. To preclude exclusion of participants with missing information on parental history of diabetes in this study, we assigned the prevalence of a history of diabetes among participants with available information to those with missing information as a constant. This constant was calculated before application of further exclusion criteria. Information on a sibling history of diabetes was not assessed in GNHIES98 or DEGS1. Thus, we assigned the prevalence of a sibling history of diabetes observed in EPIC-Potsdam (5.0%) as a constant to all participants.10 Body height and waist circumference were assessed by standardized measurements to the nearest 0.1 cm performed by trained health professionals.
In GNHIES98, dietary intake was assessed through a food frequency questionnaire (FFQ) with seven categories (from ‘(almost) never’ to ‘several times/day’). Additionally, in a subset of 4030 GNHIES98 participants who participated in the Nutrition Survey module, a dietary history interview was conducted assessing usual frequencies and amounts consumed during the past 4 weeks.22 ,23 In this subset, the mean amount consumed per day of each respective item was calculated for each category of frequency as used for the GNHIES98-FFQ and stratified according to sex and age group (18–39, 40–59, ≥60 years). The obtained values were allocated to the respective categories of frequency for all GNHIES98 participants. To account for differences in food grouping between the GNHIES98-FFQ and the use as in the GDRS, namely ‘coffee with caffeine’ versus ‘coffee’, ‘meat (including poultry)’ versus ‘red meat’ and ‘muesli, cornflakes, and oatmeal’ versus ‘muesli’, only compatible information from the Nutrition Survey module was used to calculate daily amounts, which were then allocated to the aforementioned FFQ categories for all GNHIES98 participants.
In DEGS1, a semiquantitative FFQ was applied with 11 categories of frequency (from ‘never’ to ‘>5 times/day’) and 5 categories of amounts (from ‘≤0.5 cup’ to ‘≥4 cups’ for coffee, ‘≤0.5 slice or roll’ to ‘≥4 slices or rolls’ for wholegrain bread/rolls, ‘≤0.25 bowl’ to ‘≥3 bowls’ for muesli, and ‘0.25 portion’ to ‘≥3 portions’ for red meat). Since categories of amount were comparable in DEGS1 and EPIC-Potsdam, calculation of the average intake in grams per day was based on standard portion sizes from EPIC-Potsdam (ie, 150 g for red meat, 150 mL for coffee, 50 g for wholegrain bread and muesli).
Statistical analysis
Points of the recently updated comprehensive GDRS version were calculated by the following formula:11
5.1×age (years)+7.6×waist circumference (cm)—2.7×height (cm)+47×history of hypertension—2×physical activity (hours/week)+15×former smoking (<20 cigarettes/day)+45×former smoking (≥20 cigarettes/day)+23×current smoking (<20 cigarettes/day)+77×current smoking (≥20 cigarettes/day)+55×red meat (portions (150 g)/day)—7×wholegrain bread and muesli (portions (50 g)/day)—5×coffee (cups (150 mL)/day)+56×one parent with diabetes+106×both parents with diabetes+48×at least one sibling with diabetes.
On the basis of calculated GDRS points for each individual, predicted 5-year diabetes risk was determined (P5 years=1–0.99061exp((GDRS points—474.17096591)/100)). The comprehensive GDRS is available as an online tool with an automatic calculation of predicted diabetes risk after entry of individual risk factor values.12
For validation of the GDRS, we assessed discrimination by logistic regression as area under the receiver operating characteristic curve (ROC-AUC). According to previous suggestions, an ROC-AUC of 0.7–0.8 was rated as acceptable and of >0.8 as excellent.24 The 95% CI was estimated via a bootstrap procedure with 2000 replicates by resampling the sample points25 and using the 2.5% and 97.5% percentiles of the bootstrapped distribution as CI. In addition, for prediction of incident type 2 diabetes, we evaluated calibration with a calibration plot comparing the observed risk, that is, the proportion of observed incident cases in each of the predefined groups, with the predicted risk, that is, the geometric mean of predicted risk in each of the respective groups.26 Owing to the relatively low number of persons with incident type 2 diabetes within 5 years of follow-up, we defined quintiles based on predicted diabetes risk instead of the commonly applied deciles. Besides, we calculated sensitivity, specificity, positive and negative predictive value (PPV and NPV) using the same cut-offs of predicted diabetes risk as in previous analyses.10
Further, we performed several sensitivity analyses (figure 1). For longitudinal sensitivity analyses, first, the study population was confined to participants aged 35–65 years according to the age range of EPIC-Potsdam. Second, information on incident diagnosed type 2 diabetes within the entire follow-up period was considered. Third, persons with incident HbA1c-defined undiagnosed diabetes (HbA1c≥6.5% (≥48 mmol/mol))20 were additionally included as cases. Fourth, persons with incident glucose-defined undiagnosed diabetes (fasting glucose ≥7.0 mmol/L or non-fasting glucose ≥11.0 mmol/L)9 were additionally included as cases.
For cross-sectional sensitivity analyses, first, the study population was confined to participants aged 35–65 years. Second, persons with glucose-defined undiagnosed diabetes were additionally considered to the HbA1c-defined cases (based on the criteria described above). Moreover, we investigated the score's performance for detection of prevalent pre-diabetes (defined as HbA1c 5.7–6.4% (39–47 mmol/mol),20 n=1426) after exclusion of participants with prevalent undiagnosed diabetes from the ‘DEGS1—cross-sectional sample’ (n=5920).
In the longitudinal and cross-sectional analyses, we additionally validated the most recently updated simplified paper version of the GDRS. For the simplified GDRS, risk factors were assessed in categories with points allocated to each category. Based on the sum of these points for each individual, predicted 5-year diabetes risk was calculated (P5 years=1–0.99061exp((simplified GDRS points—38.4558938)/10)).11 When using the paper version, predicted risk is easily derivable by assigning determined GDRS points to a graphically presented scale.27
Analyses were performed with SAS V.9.4 (SAS Institute, Cary, North Carolina, USA) using complex survey procedures and including weighting factors as described in detail previously.28 To determine whether exclusion of subjects with missing data had influence on the findings of this study, multiple imputation of missing data in GDRS components was applied using the fully conditional specification method.29 In total, 10 complete data sets were imputed. In the longitudinal and cross-sectional analyses, results only marginally changed when multiple imputation was applied (data not shown).
Results
Prediction of incident diagnosed type 2 diabetes
During 5 years of follow-up, 82 of the 3625 participants in the ‘GNHIES98—longitudinal sample’ reported a new diagnosis of type 2 diabetes. Incident cases on average were older and shorter, had a higher waist circumference, a lower sport activity and wholegrain intake, were less likely current smokers of <20 cigarettes per day and more likely to have a history of hypertension and parental history of diabetes than those without incident diabetes (table 1). Accordingly, GDRS points (714.3 vs 488.2 points) and the corresponding predicted 5-year diabetes risk (9.6% vs 1.1%) were considerably higher among participants with incident diabetes compared with those without incident diabetes.
Baseline characteristics of the ‘GNHIES98—longitudinal sample’ (N=3625) stratified by status of incident diagnosed type 2 diabetes
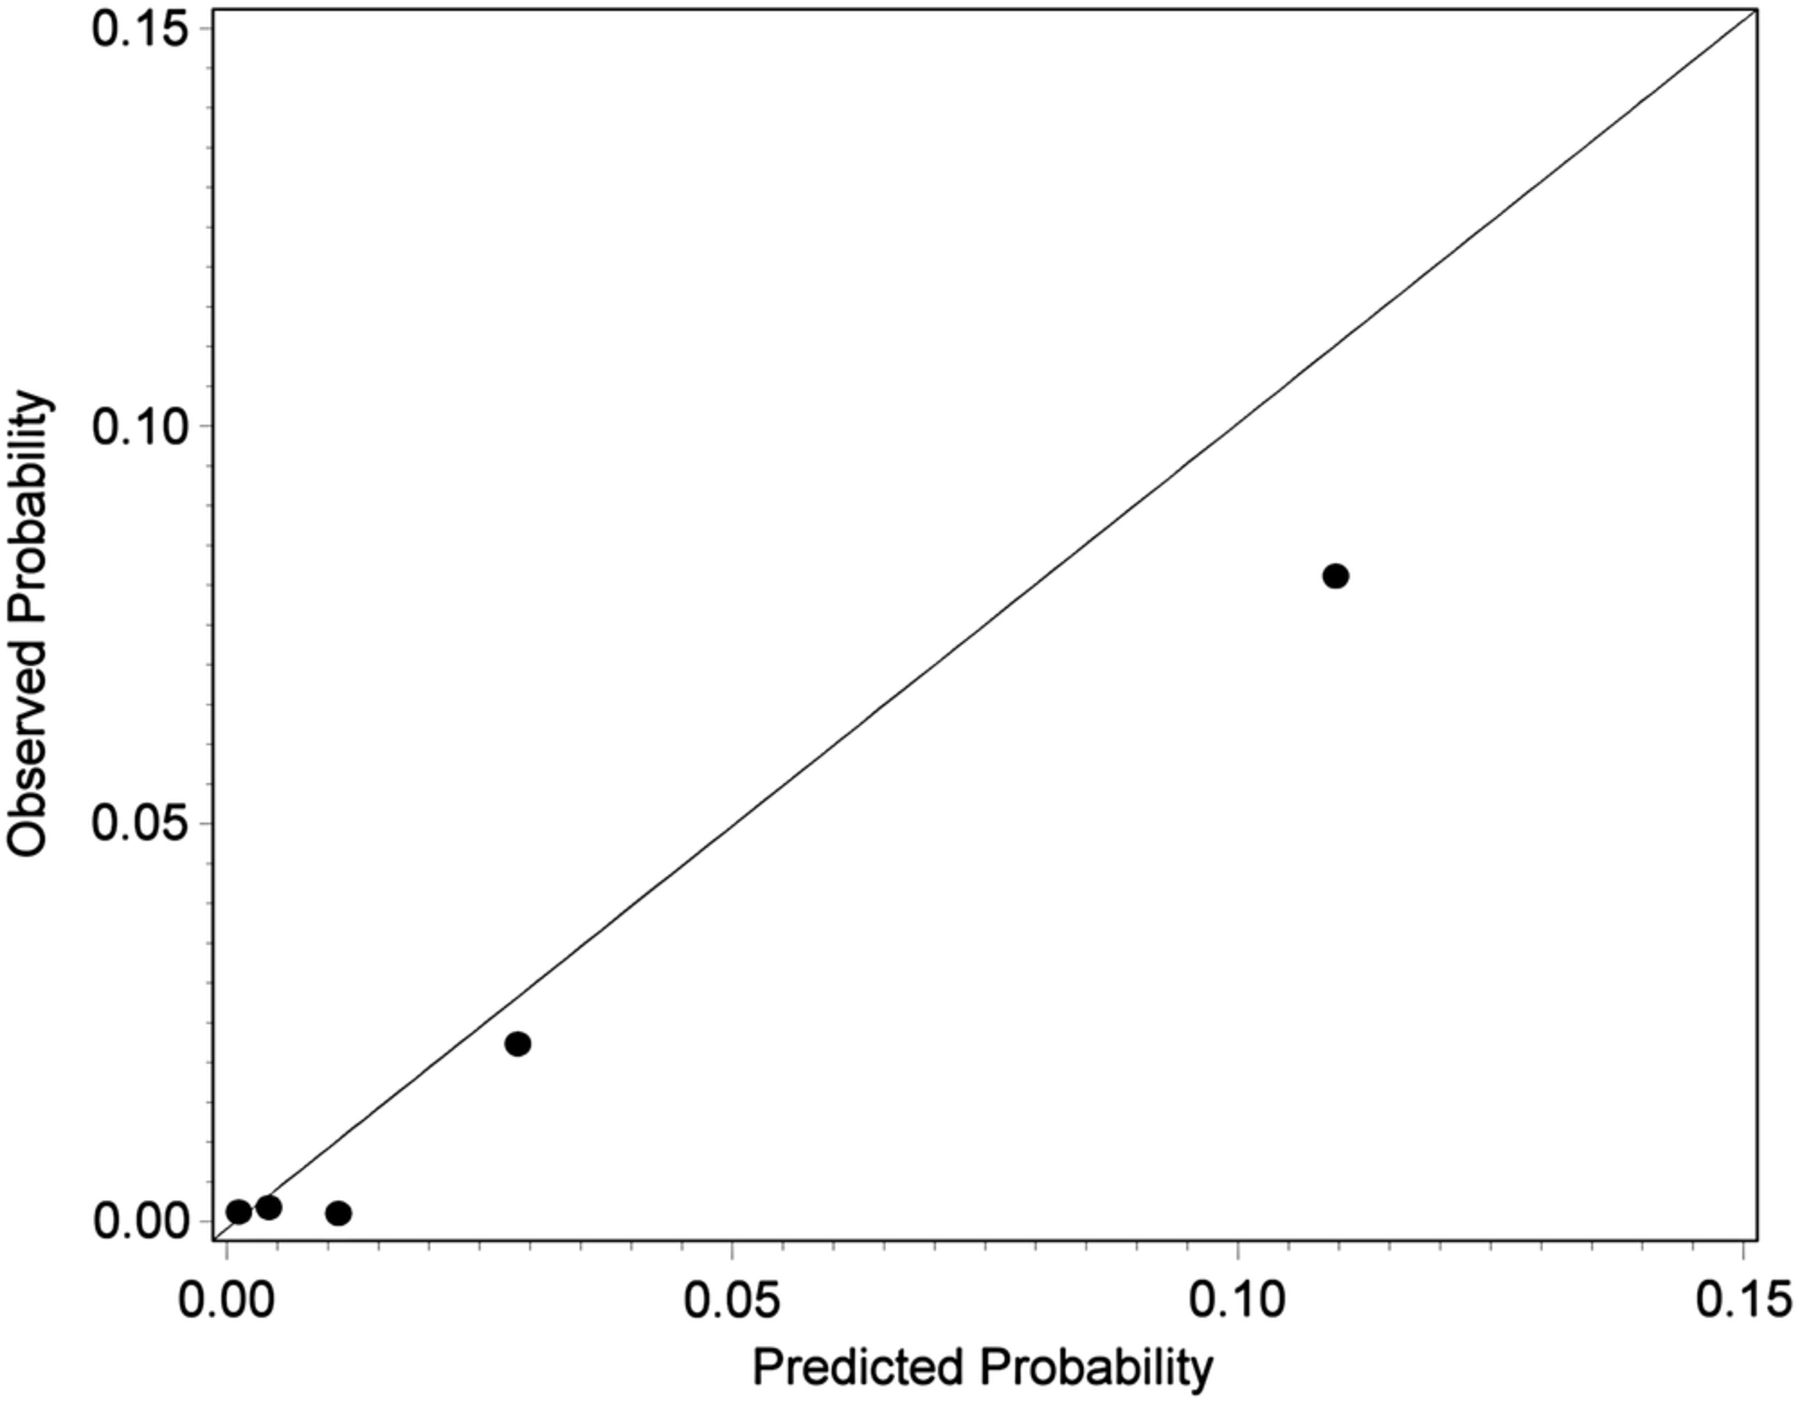
For prediction of incident diagnosed type 2 diabetes, the GDRS yielded an ROC-AUC of 0.87 (0.83 to 0.90). The calibration plot (figure 2) indicated that in the lowest risk group predicted risk perfectly agreed with observed risk (predicted risk/observed risk: 0.1%/0.1%). However, predicted risk was overestimated in the remaining groups (second group: 0.4%/0.2%; third group: 1.1%/0.1%; fourth group: 2.9%/2.2%; fifth group: 11.0%/8.1%). Sensitivity, specificity, PPV and NPV for selected cut-offs of predicted 5-year diabetes risk are shown in table 2. The cut-off with a maximum in the sum of sensitivity and specificity was at 3.1% of predicted risk (sensitivity: 0.95, specificity: 0.73, PPV: 0.07, NPV: 1.00).
Sensitivity, specificity, PPV and NPV of the GDRS according to selected cut-offs of predicted 5-year diabetes risk in the ‘GNHIES98—longitudinal sample’ (N=3625) and the ‘DEGS1—cross-sectional sample’ (N=6048)

Calibration plot by quintiles of predicted 5-year diabetes risk of the comprehensive German Diabetes Risk Score (GDRS) for prediction of incident diagnosed type 2 diabetes in the ‘German National Health Interview and Examination Survey 1998 (GNHIES98)—longitudinal sample’ (N=3625).
In sensitivity analyses, we observed similar results (ROC-AUC: 0.86 (0.82 to 0.89)) when restricting the sample to 35–65-year-olds. Considering those with incident diagnosed diabetes within the entire follow-up period of 11.9 years as cases resulted in a slightly decreased ROC-AUC (0.84 (0.82 to 0.86)). Additional consideration of persons with incident undiagnosed diabetes as cases led to a further slight decrease in discrimination (ROC-AUC: HbA1c-based: 0.81 (0.78 to 0.84); HbA1c-based and glucose-based: 0.81 (0.78 to 0.84)).
The simplified GDRS version showed a similar discrimination (ROC-AUC: 0.86 (0.82 to 0.89)) as compared with the comprehensive version and only marginal changes in the calibration plot (see online supplementary figure S1).
Supplementary figure
Detection of prevalent undiagnosed diabetes
In the ‘DEGS1—cross-sectional sample’, 128 cases of HbA1c-defined undiagnosed diabetes out of 6048 participants were identified. Participants with undiagnosed diabetes on average were older, had a higher waist circumference, a lower sport activity and were more likely to have a history of hypertension and parental history of diabetes compared with those without undiagnosed diabetes (table 3). Additionally, they were less likely to be former or current smokers of <20 cigarettes per day, but more likely to be former or current smokers of ≥20 cigarettes per day. Consequently, GDRS points (736.6 vs 485.9 points) and the corresponding predicted 5-year diabetes risk (11.3% vs 1.0%) were significantly higher among participants with undiagnosed diabetes compared with those without undiagnosed diabetes.
Characteristics of the ‘DEGS1—cross-sectional sample’ (N=6048) stratified by status of prevalent undiagnosed diabetes
For detection of prevalent undiagnosed diabetes, the GDRS showed an ROC-AUC of 0.84 (0.81 to 0.86). Sensitivity, specificity, PPV and NPV for selected cut-offs of predicted 5-year diabetes risk are shown in table 2.
In sensitivity analyses, when limiting the sample to 35–65-year-olds (ROC-AUC: 0.83 (0.79 to 0.88)) or defining undiagnosed diabetes by combining HbA1c with glucose criteria (ROC-AUC: 0.84 (0.82 to 0.86)), results for discrimination only marginally changed.
The simplified GDRS version showed a similar discrimination (ROC-AUC: 0.83 (0.80 to 0.86)) as compared with the comprehensive version.
For detection of prevalent pre-diabetes, the GDRS showed an ROC-AUC of 0.71 (0.69 to 0.74).
DISCUSSION
On the basis of a nationwide longitudinal sample of the German adult population, validation of the GDRS for 5-year risk prediction of diagnosed type 2 diabetes revealed excellent discrimination as well as perfect prediction for low diabetes risk and slight-to-moderate overestimation for intermediate to high risk. The simplified GDRS version yielded a similar predictive ability. Considering the entire follow-up period of about 12 years and including undiagnosed diabetes for defining incident cases diminished performance somewhat. Furthermore, in a nationwide cross-sectional sample representative of the German adult population, the GDRS showed excellent discrimination for detection of prevalent undiagnosed diabetes for both its comprehensive and simplified versions.
Prediction of incident diagnosed type 2 diabetes
Previous versions of the comprehensive GDRS have been validated for prediction of type 2 diabetes risk in several regional German studies, indicating good external performance overall.8 ,10 ,14 In this study, covering a wide age range (18–79 years), the discrimination of the most recently updated GDRS (ROC-AUC: 0.87 (0.83 to 0.90)) was similar to its performance in EPIC-Potsdam, in which the score was derived (age range 35–65 years; ROC-AUC: 0.86 (0.84 to 0.87)).11 Furthermore, discrimination was comparable to the performance of a slightly different previous GDRS version (including alcohol consumption but less-extensive information on wholegrain intake and smoking) in a regional study from southern Germany (age range 25–74 years; ROC-AUC: 0.84 (0.82 to 0.86)).10 The relatively high ROC-AUC of the GDRS in this study may be explained by a larger heterogeneity in our study population compared with the EPIC-Potsdam population, for example, due to a broader age range and the nationwide sampling.16 ,30 In line with expectations, restricting our study population to the EPIC-Potsdam age range slightly decreased the ROC-AUC. Additional analysis showed that considering the entire follow-up period for defining incident cases slightly decreased discrimination. This tendency was also seen in other studies when considering a longer follow-up time than in the original model.6 ,16 Inclusion of undiagnosed diabetes for defining incident cases further decreased discrimination. This is in accordance with the finding of another validation study within a regional German cohort study of older adults14 and may be explained by the fact that the GDRS was specifically developed to predict the 5-year diabetes risk of diagnosed, that is, a rather manifest, diabetes.8
For the lower risk groups, the calibration plot in EPIC-Potsdam was comparable to the one in our study.10 However, while diabetes risk was slightly underestimated in the highest risk group in EPIC-Potsdam, it was overestimated in this study. The latter observation is in accordance with findings from the above mentioned regional study from southern Germany.10 Also, in an external validation study of several diabetes risk scores, it was found that even after recalibration most diabetes risk scores overestimate actual diabetes risk.16 Similarly, recalibration6 did not substantially improve calibration of the GDRS in this study (data not shown). However, as a prediction tool, a diabetes risk score should correctly identify persons at increased diabetes risk to initiate further testing or preventive actions in the appropriate target group. Consequently, an overestimated risk among those who are already in the high-risk group is less important for decisions in clinical practice as opposed to an overestimated risk in those with a low diabetes risk, which could lead to unnecessary further testing.6 ,10 ,16 ,31 Therefore, the overestimated risk in the higher risk groups may not necessarily preclude a correct identification of those with a high diabetes risk.16
Until now, this is the first study to validate the simplified GDRS version. The results on discrimination and calibration were comparable to those of the comprehensive GDRS version in this study and by that being comparable to the findings in EPIC-Potsdam.11
Detection of prevalent undiagnosed diabetes
For detection of undiagnosed diabetes, only the original GDRS version has been validated in two regional German studies yielding an acceptable to excellent discrimination (ROC-AUC: 0.75 and 0.83) with undiagnosed diabetes being defined by 2-hour postchallenge glucose.8 Until now, this is the first study to assess the GDRS for detection of prevalent undiagnosed diabetes in the target population by using a representative sample of the German adult population. The finding of an excellent discrimination (ROC-AUC: 0.84 (0.81 to 0.86)) remained nearly unchanged when including glucose-based criteria additionally to the HbA1c criterion for the definition of undiagnosed diabetes or by relying on the simplified GDRS version.
With regard to pre-diabetes, a previous analysis in a subsample of EPIC-Potsdam also suggested its suitability for identification of persons with impaired fasting glucose (ROC-AUC: 0.79).15 However, results of our study (ROC-AUC: 0.71 (0.69 to 0.74)) only limitedly suggest its application for detection of HbA1c-defined pre-diabetes.
Applicability of the GDRS
In their practice guideline, the German Diabetes Association recommends the GDRS as a primary screening tool for diabetes.9 The findings of this study provide some evidence that is in support of the GDRS as a suitable primary screening tool for undiagnosed diabetes among the German adult population beside its original assignment as a prediction tool.
Several international guidelines recommend a stepwise approach to identify persons at high risk for or with yet undiagnosed type 2 diabetes among the general adult population, that is, the application of a validated risk score followed by a blood test in those with an increased score.32–35 As part of this approach, for example, the FINnish Diabetes RIsk SCore (FINDRISC)36 is suggested by some international guidelines33–35 and the Leicester Risk Assessment score is suggested by the National Institute for Health and Care Excellence for the multiethnic setting in England.32 ,37 Both scores are self-assessment tools and comparable to the GDRS in their main components.36 ,37
Since it is recommended to preferably implement a diabetes risk score as part of a screening approach that was developed and validated in the target population,2 ,38 we evaluated the GDRS among the German adult population showing a convincing performance for prediction of diabetes risk and detection of prevalent undiagnosed diabetes. Further, it has been proposed that a risk score should be based on non-invasive tests and should consist of a limited number of components to ensure its usability.1 ,16 The GDRS, indeed, exclusively relies on non-invasively measured risk factors. However, for the comprehensive online tool,12 information on a relatively large number of risk factors is required and complex background formulas for calculation of GDRS points and predicted risk are used. Therefore, a simplified paper version of the GDRS has been developed with risk factors summarized to 10 items and a simplified calculation procedure.11 ,13 A validation of this simplified version in this study led to similar results as for the comprehensive version. However, the extent to which the application of the GDRS might help to increase diabetes risk awareness among the general population and the effectiveness of preventive measures still needs to be evaluated in future studies.1 ,7 ,39
Limitations
Limitations of this study include that information on a sibling history of diabetes was not available. Therefore, according to the approach of a former validation study,10 prevalence of a positive sibling history of diabetes from EPIC-Potsdam was applied instead. Additionally, in the ‘GNHIES98—longitudinal sample’ and the ‘DEGS1—cross-sectional sample’, there was a considerable proportion of participants with missing information on parental history of diabetes (13% and 6%). Thus, we applied the prevalence of a positive parental history of diabetes among participants with available information to those with missing information, again following the approach of a previous validation study.10 This might have decreased the variance in the family history of diabetes variables and may have led to an underestimation in the score's performance.10
Further, there were differences in the assessment of some GDRS components between EPIC-Potsdam and our surveys. In EPIC-Potsdam, physical activity included sports, biking and gardening, whereas in our surveys only regular sport activity was assessed. Furthermore, in GNHIES98, only frequencies but not amounts of dietary intake were assessed and some food categories differed from those assessed in EPIC-Potsdam. However, we used detailed food consumption data from the Nutrition Survey module to assign appropriate values for the respective GDRS food groups as accurately as possible.
In the ‘GNHIES98—longitudinal sample’, the definition of incident diabetes largely relied on a self-reported diagnosis without verification through participants' medical records. In addition, cases of yet undiagnosed diabetes might have been present at baseline or follow-up and led to an overestimation or underestimation in ROC-AUC and observed risk.16 However, we addressed this issue by a sensitivity analysis as discussed above.
Finally, we previously showed that participants of GNHIES98 who re-participated in DEGS1 differed in some characteristics from those who were alive but did not re-participate or from those who were deceased.19 Therefore, despite the application of complex weighting factors to also account for the incomplete follow-up of GNHIES98 participants, a selection bias has to be considered for interpretation of results from longitudinal analyses.
Conclusion
Our findings, based on a nationwide cohort of German adults, suggest that the GDRS is a suitable tool for prediction of future type 2 diabetes risk and might hence be applied for public health monitoring of diabetes risk in Germany. Further, our results from a nationwide cross-sectional study also reflect a reasonable performance of the GDRS for detection of prevalent undiagnosed diabetes. Additional research is needed to evaluate the benefit of the GDRS in terms of diabetes risk awareness and effectiveness of prevention.
Acknowledgments
The authors would like to thank Daniel Grams for support with figure formatting, Angelika Schaffrath Rosario for statistical support, and all study participants of GNHIES98 and DEGS1.
References
Footnotes
Contributors CH conceptualized the study. RP analyzed the data and wrote the manuscript. KM and CH supported statistical analyses. KM, GBMM, MBS, ST, CS-N, and CH contributed to interpretation of data and critically revised the manuscript for important intellectual content. All authors read and approved the final version of the manuscript.
Funding Both GNHIES98 and DEGS1 were funded by the German Federal Ministry of Health. This study was supported by research grants from the German Federal Ministry of Health (FKZ: GE20130320) and from the German Center for Diabetes Research (DZD) funded by the German Federal Ministry of Education and Research (FKZ: HMGU2015Z1).
Competing interests None declared.
Patient consent Obtained.
Ethics approval Charité-Universitätsmedizin Berlin.
Provenance and peer review Not commissioned; externally peer reviewed.
Data sharing statement No additional data are available.