Article Text

Abstract
Introduction Incidence rates of diabetes have been increasing and mortality rates have been decreasing. Our aim is the quantification of the effects of these on the prevalence and prediction of the future burden of diabetes.
Research design and methods From population-based registers of Denmark, we derived diabetes incidence and mortality rates and mortality rates for persons without diabetes for the period 1996–2016. Rates were modeled by smooth parametric terms using Poisson regression. Estimated rates were used to assess the relative contribution of incidence and mortality to changes in prevalence over the study period as well as for prediction of future rates and prevalence 2017–2040.
Results The major contributors to prevalence was increasing incidence (22%) and epidemiological imbalance between incidence and mortality (27%). The decrease in mortality rates over the period 1996–2016 contributes only 9% of the prevalent cases at 2016. We estimated that 467 000 persons in Denmark would be living with diabetes in 2030. The age distribution of patients in the period 2017–2030 is predicted to change toward older ages. The total number of persons needing diabetes care will increase by 67% over the next 13 years, an average annual increase of 4.0%.
Conclusions Lowering mortality among patients with diabetes even further is not likely to influence the prevalence substantially. Since the size and the increase in incidence of diabetes are major drivers of the increasing prevalence, the prevention of new cases of diabetes is required.
- epidemiology
- incidence
- mortality
- registries
This is an open access article distributed in accordance with the Creative Commons Attribution Non Commercial (CC BY-NC 4.0) license, which permits others to distribute, remix, adapt, build upon this work non-commercially, and license their derivative works on different terms, provided the original work is properly cited, appropriate credit is given, any changes made indicated, and the use is non-commercial. See: http://creativecommons.org/licenses/by-nc/4.0/.
Statistics from Altmetric.com
Significance of this study
What is already known about this subject?
Incidence rates of diabetes have been increasing.
Mortality rates have been decreasing both in the diabetic and non-diabetic population.
The equation prevalence=incidence/mortality does not take age structure of the population into account.
What are the new findings?
Increasing diabetes incidence over the period 1996–2016 contributed 22% of the prevalent cases in 2016 and an epidemiological imbalance between incidence and mortality contributed 27%.
The decrease in mortality contributed only 9%.
An estimated 467 000 (7.7%) persons in Denmark will be living with diabetes in 2030.
The proportion of patients with diabetes over 70 years is predicted to increase from 43% to 46% for women and from 38% to 45% for men.
How might these results change the focus of research or clinical practice?
Given the major contribution of incidence to increasing prevalence, prevention of new diabetes cases remains a key effort.
The total number of people needing diabetes care will increase in the future.
Introduction
Diabetes is among the leading causes of death in Europe with diabetic macrovascular and microvascular complications resulting in increased disability and enormous healthcare costs.1 It is unlikely that these costs will decrease any time soon; the number of patients will increase over the next decades. However, it is of importance for planning purposes (in all sectors of the healthcare system) that the likely number of patients with diabetes in the future is known as precisely as possible, but for preventive purposes also to know which factors drive the increasing prevalence.
Many countries have faced a rapid increase in diabetes prevalence.2 Data from the US Center for Disease Control and Prevention show a near quadrupling of diagnosed diabetes from 5.5 million persons in 1980 to 21.1 million in 2010.3 The most recent Scottish Diabetes Survey (2016) estimates that 5.4% of the population had a diagnosis of diabetes in Scotland at the start of 2016, compared with 4.1% in 2007.4
The increase in prevalence is most likely caused by an increase in incidence due to changes in underlying risk factors, primarily obesity and aging of the population. Significant declines in mortality rates have been reported, both in type 1 and type 2 diabetes.5–10 Also, in the non-diabetic background populations, there has been a decrease in mortality, but not to the same extent as among persons with diabetes.
The relationship between prevalence, incidence and duration (=survival with diabetes, the inverse of mortality) is usually stated as prevalence=incidence×duration=incidence/mortality, so both increasing incidence and decreasing mortality contribute to increasing prevalence. The formula is only a rough approximation to reality as it concerns a steady-state situation and does not take the age structure of the population into account. As such, it should therefore be regarded as a qualitative statement about the relationship.
A number of papers have pointed this qualitative relationship out, but so far, the only study that has attempted a quantification is Evans et al, however not quantifying effects by age and using a very crude age adjustment with 20-year age classes.11–13
There have been numerous reports predicting the future burden of diabetes, some even as far as 2050 or further, all ending with substantial predicted increases in numbers, mostly in the range 40%–60% for the period 2015–2030.14–21
In this work, we used a newly established Danish Diabetes Register to provide the prevalent cases each year 1996–2017, as well as the incident cases and deaths for the period 1996–2016 to model incidence and mortality rates for the period in order to quantify the relative contribution of the incidence and mortality to prevalence at 2017 as well as the future incidence and mortality rates for the period 2017–2040, and ultimately the future number of patients with diabetes.22
Research design and methods
Data
We used data from the Danish diabetes register to compute prevalence and incidence of diabetes and mortality among persons with and without diabetes for the period 1996–2016.22 As we are concerned with the total number of persons with diabetes in Denmark, we did not distinguish between type 1 diabetes and type 2 diabetes.
Using prevalence, incidence and mortality for prediction
We estimated prevalence at 1996 as a smooth function of age using natural splines. Incidence and mortality rates were estimated as smooth functions of age and calendar time for the period 1996–2016 using age–period–cohort (APC) models with natural splines for the three effects.23
Starting with the estimated prevalences at 1 January 1996 in 1-month age intervals, we used the estimated incidence and mortality rates to compute the prevalence in steps of 1 month for successive dates in the period of interest. The technicalities of this is given in online supplementary material.
Supplemental material
Components of prevalence
The main idea is to begin with the prevalence of diabetes at 1 January 1996 and then use estimated incidence and mortality rates to predict future prevalence of diabetes—independent of the absolute numbers. Thus, we are using the term 'prevalence' to refer to the proportion of persons in the population affected by diabetes.
We derived the predicted incidence and mortality rates from the APC models; we evaluated rates at 1-month intervals over the age range 0–100 and period 1 January 1996 through 1 January 2017.
If we begin with the estimated prevalence as of 1 January 1996 in 1-month age intervals, then a set of age-specific incidence and mortality rates can be used to predict from the prevalence at a given age. The fraction of persons with and without diabetes that will die during the next month, and the fraction of persons without diabetes that will get diabetes during the next month is a function of the rates. So we know the fraction of the persons that after the month will be alive with and without diabetes, and hence also the prevalence of diabetes 1 month later in a 1-month-older age. The crucial point here is that we update the prevalences, not the number of persons; the mathematical formulae are given in online supplementary material.
The interval of 1 month was chosen to minimize the probability of getting diabetes and subsequently die within one interval, a probability that we formally consider as 0 in the calculations.
This machinery was run separately for men and women, under four different scenarios for the age range 0–100 and the period 1 January 1996 through 1 January 2017:
incidence and mortality rates as estimated—this scenario should yield the actually observed prevalence at 1 January 2017 (it did, see online supplementary material figure 3).
Incidence rates as estimated, but mortality rates assumed constant at the level of 1 January 1996.
Mortality rates as estimated, but incidence rates assumed constant at the level of 1 January 1996.
Incidence and mortality rates both assumed constant at the level of 1 January 1996.
The difference between scenario 4 at 1 January 2017 and the age-specific rates at 1 January 1996 is the increase in prevalence solely attributable to the imbalance between incidence and mortality as they were at 1 January 1996; what we call the epidemiological imbalance as of 1 January 1996. This is solely a function of the prevalences and incidence and mortality rates as of 1 January 1996 (and the length of the period, in this case 21 years—the longer the period the more prominent this will usually be).
The difference between the prevalences based on scenarios 1 and 2 as well as the differences between scenarios 3 and 4 can both be seen as the contribution from changing mortality rates; the difference between the scenarios are whether mortality rates are used as changing or constant. We used the average of these two differences as the contribution from the changing mortality to the (age-specific) prevalence at 1 January 2017.
Similarly, the difference between scenarios 1 and 3 and between scenarios 2 and 4 can be seen as the contribution from changing incidences. We used the average of these two as the contribution from the changing incidence rates to the (age-specific) prevalence at 1 January 2017.
The sum of these three defined contributions is precisely the difference between the predicted prevalences at 1 January 2017 and the prevalences at 1 January 1996, thus providing a partition of the change in age-specific prevalences as of 1 January 2017 into three components attributable to changing mortality, changing incidence rates, and imbalance between mortality and incidence rates as of 1 January 1996.
Future prevalence
The APC models were used to extrapolate incidence and mortality rates for the period 2017–2040 by extending the linear part of the natural spline for period and cohort.24 As a second scenario, the trends in extrapolated incidence rates were attenuated by halving the slope every 5 years. For sensitivity, we also made predictions based on annual incidence rate increases from the 2017 level of 0, 2, 4 and 6%.
For each of these scenarios, we predicted the future prevalences by starting with the estimated prevalences as of 1 January 2017 and predicting in 1-month steps until 2040 as described earlier. Multiplying the projected age-specific prevalences by the predicted population size 2017–2040 from Statistics Denmark, we obtained the predicted number of patients with diabetes for the period 2017–2040. A detailed account of this procedure can be found in online supplementary material.
Results
In the study period, during some 115 million person-years, there were 363 664 new cases of diabetes and about 1.15 million deaths, of which 161 762 were among patients with diabetes (online supplementary table ESM1). There was a marked decrease in the number of new diabetes cases after 2012 and an increase again in 2015 and 2016.22
Trends in incidence and mortality rates
From the fitted APC models, we extracted the average annual trend in rates; as seen from table 1, there was an average increase in incidence rates of diabetes of 2.8% per year. Mortality rates were decreasing; 2.7% per year for persons without diabetes, but 3.7% per year for persons with diabetes, and the relative mortality comparing with the general population was decreasing by 1.1% per year (table 1).
Average annual change (%) in diabetes incidence, mortality, and standardized mortality rates (SMR) in Denmark in the period 1996–2017.
Components of prevalence
The predicted prevalences as of 2017 from combining age-specific prevalences in 1996 and the fitted incidence and mortality rates from the APC models for the period 1996–2016 showed a very good agreement with the observed prevalences in 2017 (online supplementary figure ESM3). Thus, the prediction modeling of the incidence and mortality rates method is sufficiently accurate to yield credible results for the scenarios considered.
The components of the prevalences as derived from the models are shown in online supplementary figure ESM4, where it is seen that the fraction of the diabetes prevalence attributable to decreasing mortality is quite substantial in older ages. However, it is equally clear that the dominant components in the changing diabetes prevalence are the increasing incidence and the fact that the prevailing incidence and mortality rates in 1995 were not in equilibrium with the prevalences, meaning that more people were diagnosed with diabetes than patients with diabetes were dying; the so-called epidemiological imbalance.
Figure 1 shows the number of patients with diabetes in the Danish population attributable to each of the contributing components. The mortality decrease has a comparatively small impact on the number of cases because its effect is confined to older ages where the number of prevalent diabetes cases is limited. The fraction of diabetes cases attributable to declining mortality over the period 1996–2016 was 10%, whereas the fraction attributable to increasing incidence of diabetes was 20%, and 33% were attributable to the imbalance between incidence and mortality already present in 1996. The remaining 37% of prevalent cases in 2017 is the number corresponding to the age-specific and sex-specific prevalences as of 1996. There were only small differences between men and women (figure 1).

Age distribution of persons with diabetes in Denmark as of 1 January 2017 according to components of the changes in diabetes prevalence 1996–2016. Figures at the top is the number, respectively percentages attributable to the four factors. The colored areas are number of cases attributable to Mort: declining mortality (full color), Inc: increasing incidence (pale color) and Imbal: incidence/mortality imbalance 1996 (weak color). The weakest color in the middle (Org) corresponds to the number of cases that would have been present if age-specific prevalences were as of 1 January 1996. Men in blue, women in red.
The development of the components as a fraction of all prevalent diabetes cases in different ages is shown in figure 2, and not surprisingly, the mortality decrease has the largest impact on the prevalences in older ages. We found that the fraction attributable to mortality decline was around 5% in age 60, 10% in age 70 and almost 20% at age 80 for men, and slightly less in women (figure 2).

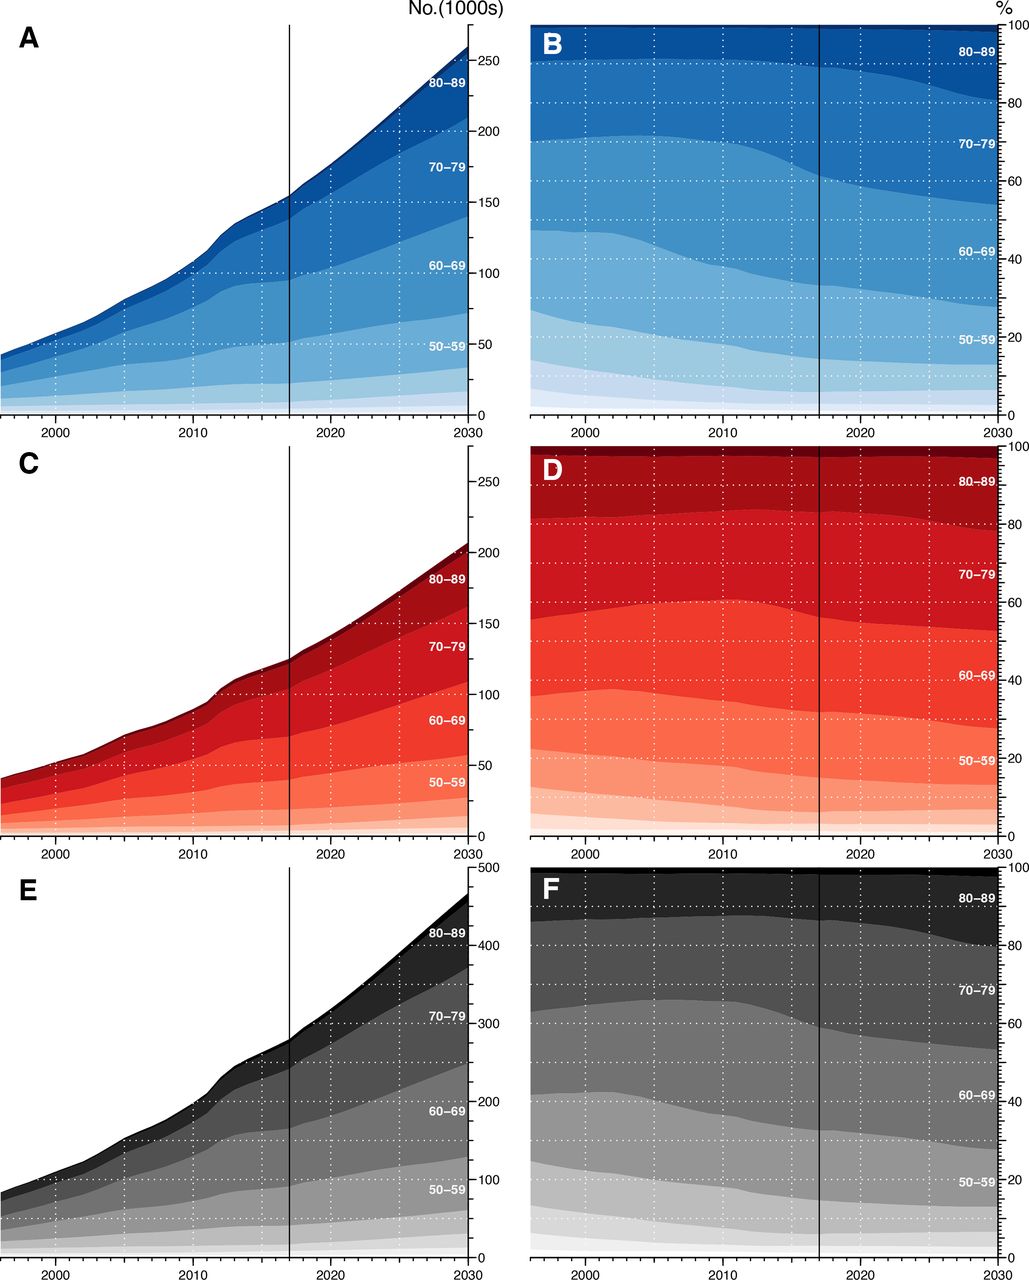
Observed and predicted number of patients with diabetes 1996–2030. Left panels are number of men (A), women (C) and total number of diabetic persons (E); right panels show age distributions in 10-year classes for men (B), women (C) and all (F). Blue is men, red is women and gray both sexes combined; different shades correspond to 10-year age classes. The black vertical line delineates the observed (data) from the prediction.
Future prevalence
At 1 January 2017, there were 280 130 prevalent cases of diabetes in the Danish population, corresponding to 4.8% of the population.22
The incidence rates showed an increase until around 2011, then a decrease from 2012 to 2014 and an increase again from 2015 (online supplementary figures ESM6‒8). It was therefore difficult to make any single soundly founded projections for the time beyond 1 January 2017, so we used six different scenarios as described in the methods section. The resulting predicted numbers are shown in table 2 for all six incidence rate prediction scenarios using a 5-year halving time for attenuation of the trend in mortality rates. From table 2, it is seen that using the attenuation of incidence rates gives a prediction between the scenarios with annual increase of 2% and 4%, for 2030 a total number of some 467 000 persons (260 000 men and 207 000 women) with diabetes, corresponding to a 67% increase in the number of patients with diabetes from 2017 to 2030.
Predicted number of prevalent patients with diabetes and prevalence 2017–2040, using six different prediction scenarios for incidence rates: naive prediction from a splines-based APC model, attenuation with halving of rate change per 5 years, fixing rates at the level of 1 January 2017 and an increase of incidence of 2%, 4% and 6% per year (mortality rate changes are also attenuated by a halving of rate change per 5 years in all scenarios)
The other prediction scenarios have deliberately been chosen to be on the low side (fixed rates, ie, 0% annual increase) or high side (6% annual increase), and they produce estimates quite far from the attenuation estimate of prevalent number of patients with diabetes by 2030 (392 000, respectively 526 000). The scenarios with 2% and 4% annual increase in incidence rates were chosen to be on either side of the average increase in rates over the entire period 1996–2016 (2.8%/year), and they produce estimates of 445 000 and 482 000, respectively; quite close to the results from the attenuation scenario.
A graphical representation of predicted numbers is given in figure 2.
We found minimal differences between the scenarios for the mortality rates; this can be seen from the graphical representation of the predictions in online supplementary figures ESM10‒12.
Discussion
We have shown that over the last decades in Denmark, the decline in mortality has had some impact on the increasing prevalence of diabetes, whereas the major drivers of the prevalence increase have been the increase in diabetes incidence as well as the imbalance between incidence and mortality already present in 1995.
The absolute number of cases attributable to the different components is of course heavily dependent on the particular age distribution in the Danish population.
The finding of a decline in diabetes-related mortality is encouraging, although the resulting increase in diabetes prevalence obviously challenges the healthcare system. A larger number of older people will survive with diabetes complications with increased costs of diabetes treatment, as well as costs related to screening for and treatment of complications. On the other hand, the observed increase in diabetes incidence as a major driver calls for intensified preventive strategies in persons without diabetes. Thus, the increasing diabetes prevalence has different public health consequences according to the contributing prevalence components, a finding that underscores the value of a detailed examination as ours.
Comparison with other studies
Few studies have addressed the relative contributions of mortality vs incidence to diabetes prevalence. A recent study from Israel observed a deceleration in the upward trend in diabetes prevalence despite declining mortality.25
Støvring et al merely analyzed relative annual changes in incidence, prevalence and mortality, and no formal quantification of the relative impact of mortality and incidence changes were made, so it is not possible to make a precise comparison.26 But the authors concluded that “Although our data do not allow a firm conclusion as to why prevalence is rising, we believe that the decrease in mortality should be taken into account. Otherwise, incorrect conclusions could be drawn about the relation between the western lifestyle and the rising number of diabetics.” This is indeed confirmed by this study as we estimate that as much as 10% of the current diabetes cases can be ascribed to the last 21 years’ decreasing mortality, less for ages under 70, somewhat more for older ages.
Evans et al used Tayside (Scotland) data to attempt a quantification of the relative contributions of incidence and mortality.13 They showed that 60% of the increase in diabetes prevalence over the period 1993–2004 was attributable to the initial imbalance between incidence and mortality; 25% to the increasing incidence and only 11% to decreasing mortality, which only in very broad terms is similar to our results; their study period was only half as long as ours.
In our most realistic scenario, we predicted the total number of patients with diabetes to be 467 000 in 2030, an increase of 67% over the level at the beginning of 2017, which is more than other studies have found elsewhere.17 19 This corresponds to a crude prevalence of 7.7%, up from 5.0% in 2017. Our sensitivity analysis suggests that this number would hardly be less than 450 000 nor above 500 000. Our predictions for 2040 are so variable between scenarios that we do not consider it relevant to use any of them; results for these years are merely included in table 2 to demonstrate their limited usefulness.
Sortsø et al used a similarly looking multistate model arriving at a prediction for 2040 of well over 1 million patents with diabetes in Denmark, possibly due to a very crude age classification (25-year intervals).27
Andersson et al used simple annual changes in incidence and mortality rates for prediction of the number of patients with diabetes in Sweden and arrived at some 50% increase in the number over the period 2013–2030 (from some 500 000 to 750 000, derived from the figure in the paper), and also with quite large differences between scenarios even though the authors only used 1% increase in incidence rates (in Denmark, the average increase in diabetes incidence rates were 3.1%/year).17 Holman et al used predictions of the prevalence of obesity to inform the prediction of diabetes; they found that for England, the prevalence of diabetes would increase from 8.5% to 9.5% over the period 2015–2030, but did not model change in diabetes incidence rates beyond the dependence on obesity.14
Because of the very large fluctuations in birth rates over calendar time and the uneven age distribution in the population, predictions of future numbers must rely on a prediction model for the rates of diabetes and death, which in turn is used to predict the fraction of persons in the population with diabetes/the prevalence. This is then converted to number of persons with diabetes using official age-specific forecasts of population size in the future. In our approach, we have relied on Statistics Denmark’s population forecast which is based on assumptions of mortality and fertility trends in the entire population as well as assumptions about future emigration and immigration patterns.
This way, we believe that we have produced fairly robust predictions, and in particular it is transparent what our assumptions are and the weaknesses of these. The central assumption we are making is that the most recent pace of change in incidence and mortality rates is not going to continue in the future; the rates will become more stable. This is implemented in our attenuation assumption. This was done in order not to overemphasize the effect of the changes in incidence rates only observed during the last few years of the study period.
The attenuation assumption is presumably most doubtful for mortality rates; they have been declining pretty constantly over the last 20 years with absolutely no sign of change, but on the other hand, the influence of different mortality scenarios on the predictions is minimal (online supplementary figures ESM5‒7).
Strengths and limitations
We developed a model for partitioning prevalence changes in three parts, which was based on application of well-known demographic concepts and classical epidemiological modeling of occurrence rates. While this machinery in principle is straightforward to use to assess the contributions to current prevalence as well for predicting the total future prevalence, it does rely on the availability of detailed register data of diabetes incidence and mortality.
The register-based approach in our study has some limitations since it is not possible to determine whether the observed increase in diabetes incidence reflects a true change in incidence or whether it is caused by intensified diagnostic activity, resulting in more low-risk people with diabetes being included in the Danish diabetes register. Similarly, an apparent change in incidence may also result from an increasing number of persons receiving diabetes-defining services, for example, diabetes-specific podiatry or diabetic eye examination.22 Accordingly, such inaccuracies might influence the predicted future diabetes estimates; however, this is something we have tried to consider by applying six different prediction scenarios.
Conclusion
We showed that the increasing prevalence of diabetes is influenced by the decline in mortality affecting primarily the oldest part of the population. However, the major drivers of the prevalence increase were the increase in diabetes incidence and in particular imbalance between incidence and mortality already present in 1996.
With a realistic scenario for future rates of diabetes incidence and mortality among persons with and without diabetes, we predicted the number of patients with diabetes in Denmark at 2030 to be 467 000, a 67% increase over 2017, corresponding to an overall prevalence of 7.7%. In 2017, the percentage of men among patients with diabetes were 54.6%; in 2030, it was predicted to be 56.1%, a very modest increase. The proportion of patients with diabetes over 70 years of age were predicted to increase from 43% to 46% for women and from 38% to 45% for men.
The development of incidence rates of diabetes in Denmark since 2010 has been very unstable, so any prediction endeavor will naturally entail a substantial component of arbitrary assumptions, and ours is no exception.
Acknowledgments
We are grateful to the Danish Clinical Registries (RKKP) for providing access to the DADD and diaBase for the construction of the diabetes register.
References
Footnotes
Contributors BC and MEJ conceived the structure of the underlying register and designed the study. PFR provided support for obtaining data access and contributed to data definition. BC detailed and developed the statistical methods needed, performed all data analysis and wrote a first draft of the manuscript. MEJ and PFR contributed substantially to the writing of the manuscript. All authors contributed to critical revision and take responsibility for the content. BC is the guarantor of this work and, as such, had full access to all the data in the study and takes responsibility for the integrity of the data and the accuracy of the data analysis.
Funding The authors have not declared a specific grant for this research from any funding agency in the public, commercial or not-for-profit sectors.
Competing interests BC and MEJ own shares in NovoNordisk. BC has received lecture and consultancy fees from NovoNordisk and LeoPharma. MEJ is PI on a trial sponsored by AstraZeneca, and received research grants from AMGEN AB, AstraZeneca, Sanofi Aventis and Boehringer Ingelheim. PFR has nothing to disclose.
Patient consent for publication Not required.
Ethics approval This study was approved by the Danish Data Protection Agency (registration no. 2015-41-4148). Ethical approval is not required for register-based studies in Denmark.
Provenance and peer review Not commissioned; externally peer reviewed.
Data availability statement Data may be obtained from a third party and are not publicly available. The data for this study are population-wide registers, placed at our disposal on the servers of Statistics Denmark. They are barred from release to the public on grounds of confidentiality. A full documentation of the register is given in the electronic supplementary material.