Article Text

Abstract
Introduction The objective of this study was to give an overview of prevalence, incidence and mortality of type 1 (T1D) and type 2 diabetes (T2D) in Denmark, and their temporal trends.
Research design and methods We constructed a diabetes register from existing population-based healthcare registers, including a classification of patients as T1D or T2D, with coverage from 1996 to 2016. Using complete population records for Denmark, we derived prevalence, incidence, mortality and standardized mortality ratio (SMR).
Results The overall prevalence of diabetes at 2016 was 0.5% for T1D and 4.4% for T2D, with annual increases since 1996 of 0.5% for T1D and 5.5% for T2D. Incidence rates of T1D decreased by 3.5% per year, with increase for persons under 25 years of age and a decrease for older persons. T2D incidence increased 2.5% per year until 2011, decreased until 2014 and increased after that, similar in all ages. The annual decrease in mortality was 0.3% for T1D and 2.9% for T2D. The mortality rate ratio between T1D and T2D was 1.9 for men and 1.6 for women. SMR decreased annually 2% for T1D and 0.5% for T2D.
Conclusions Incidence and prevalence of diabetes is increasing, but mortality among patients with diabetes in Denmark is decreasing faster than the mortality among persons without diabetes. T1D carries a 70% higher mortality than T2D.
- epidemiology
- incidence
- mortality
- registries
This is an open access article distributed in accordance with the Creative Commons Attribution Non Commercial (CC BY-NC 4.0) license, which permits others to distribute, remix, adapt, build upon this work non-commercially, and license their derivative works on different terms, provided the original work is properly cited, appropriate credit is given, any changes made indicated, and the use is non-commercial. See: http://creativecommons.org/licenses/by-nc/4.0/.
Statistics from Altmetric.com
Significance of this study
What is already known about this subject?
Incidence rates of type 2 diabetes (T2D) have been increasing over the last decades, T1D in childhood too, but less so than T2D.
There are indications that incidence rates of T2D have decreased recently or at least are showing a slower increase.
What are the new findings?
Incidence rates of T2D showed a decrease in 2011–2014, followed by an increase.
Incidence rates of T1D were slowly increasing in ages under 20 but decreasing in ages over 30.
The mortality of patients with T1D is some 70% higher than that of patients with T2D, but decreasing over time.
Mortality of both T1D and T2D relative to the population mortality showed a stable decrease.
How might these results change the focus of research or clinical practice?
The excess mortality of patients with T1D relative to patients with T2D may require a closer focus on prevention of complications, thereby contributing to lowering mortality in patients with T1D.
Introduction
Surveillance of disease occurrence and mortality among diseased persons is a prerequisite of quality control of the healthcare system as a whole, and for planning of future resourcing of healthcare and prevention.
Recently, there have been indications in the literature that incidence rates of diabetes have been declining in recent years.1–5 While surveillance of T1D incidence in childhood and adolescence is well established, few studies have been able to monitor T1D incidence in adulthood. Consequently, there have only been very few reports comparing the occurrence of T1D and T2D and how patients with the two diseases fare relative to each other with respect to mortality.6 7
In population surveillance, the most effective tools are population-wide disease registers, that is, recording of all new cases of disease as they occur. In Denmark, as in the other Nordic countries, there is a long tradition for population registration. Denmark has one of the longest standing comprehensive medicines registers going back to the beginning of 1995. This means that it is possible to construct an accurate diabetes register based on the medicines register and other healthcare registers. Moreover, recent administrative developments in Denmark have made it possible to make a good discrimination between T1D and T2D at the population level, enabling a more detailed reporting of trends in diabetes in Denmark separately for T1D and T2D.
The aim of this study was to describe the trends in prevalence, incidence and mortality of T1D and T2D over the period 1996–2016 as well as how these vary by age, and for mortality also by duration of diabetes.
Research design and methods
Register data
Denmark has population-wide registers covering virtually all aspects of life, including healthcare, and all registers are linkable by a unique person ID.8 The Danish national healthcare system is run by the state through five healthcare regions and covers all Danish citizens free of charge.
Diabetes data
We constructed a Danish diabetes register from existing Danish healthcare registers, using all available sources to obtain maximal sensitivity. In Denmark, all T1D is treated in hospital outpatient clinics. T2D care takes place in General Practice, except from approximately 20% of patients with T2D with severe complications who receive diabetes care in hospital outpatient clinics. While ICD-10 codes are not available for the large fraction of patients with T2D treated in General Practice, we captured diabetes-defining information from other sources as described below. Patients with diabetes were defined using the earliest of the following as inclusion date as proxy for date of diagnosis:
First diagnosis of hospital-treated diabetes (ICD-8: 249, 250; ICD-10: E10, E11; these exclude gestational diabetes) in the National Patient Register (NPR), available since 1977.9
First use of podiatry for patients with diabetes in the National Health Services Register available since 1990.10
First date of purchase of any anti-diabetic medication (ATC A10xxx) in the Medicines Products Register available since 1995.11
Earliest mentioned date of diagnosis in the Danish Adult Diabetes Database (DADD), available since 2005. DADD is a clinical quality database, with annual status of patients reported from outpatient clinics and General Practitioners and clinically validated information on diabetes in children and youth.12
Earliest date of eye examination recorded in the diaBase, a clinical quality database for eye screening of patients with diabetes available since 2009.13
Type of diabetes
Persons were classified as T1D in the diabetes register if any of the following criteria were met, and otherwise as T2D:
Purchase of insulin before age 30.
DADD: classified as T1D in >50% of the person’s DADD records classify the person as T1D, and similarly for T2D.
Not classified as either T1D or T2D in DADD, but >50% of the patient’s records from NPR classifies the person as T1D.
Finally, a person cannot be classified as T1D if there is no recorded date of insulin purchase. Persons not classifiable as T1D were classified as T2D.
Persons with an inclusion date in the register after 1 January 1996 were considered incident cases of diabetes, whereas those included before were only considered prevalent cases as of 1 January 1996 with uncertain date of diagnosis. Diabetes as cause of death without a diagnosis in any of the other registers was not definitional of diabetes.
Further details of the databases and the algorithm are given in the electronic supplementary material (ESM).
Supplemental material
Population data
Complete individual-level register information on the entire Danish population, including dates of birth, emigration, immigration and death, was available.
Tabulation of data
We tabulated prevalent cases, type of diabetes and total population as of 1 January 1996–2017, sex and 1-year age class.
Follow-up time and new cases of T1D, T2D and deaths were tabulated by diabetes status (number with diabetes, T1D, T2D), sex, age and date of diagnosis and date of birth in 1-year classes as Lexis triangles.14 For persons with diabetes diagnosed after 1996, we further tabulated by duration of disease, the first year in 3-month intervals, and beyond 1 year of duration in 1-year intervals.
A detailed account of data tabulation is given in the ESM.
Statistical methods
All statistical models were fitted separately for men and women and for no diabetes, T1D and T2D. For each tabulation unit, we devised the mean of current age, current date and duration of diabetes and date of birth, using these as quantitative explanatory variables.
Prevalence was modeled separately for each of the dates 1 January 1996–2017 in a binomial model with log-link, using restricted cubic splines for the effect of age. We also fitted models jointly for all dates in order to devise an overall annual relative change in prevalence.
Incidence and mortality rates were modeled as an age–period–cohort model using Poisson models with log person time as offset and restricted cubic spline effects of age and date of follow-up and date of birth, using 1 January 2015 as reference point for calendar time.14
Mortality rates of T1D and T2D were additionally modeled by duration of diabetes. Since the linear effects of current age, age at diagnosis and duration of diabetes cannot be separated because current age=age at diagnosis+duration, we reported the estimated mortality as a function of current age, using separate curves for persons diagnosed at ages 30, 45 and so on. The mortality curves are thus showing the joint effect of current age, age at diagnosis and duration of disease; see the detailed account of this in the ESM section on statistical methods.15
Since only persons included after 1 January 1996 have a reliable date of diagnosis, the mortality analyses using age at diagnosis and duration were restricted to persons included after this date. For comparability with other studies, age-specific mortality rates ignoring both age at diagnosis and duration were reported both for the restricted group of patients diagnosed after 1 January 1996 and for all patients, also including the prevalent cases as of 1 January 1996.
We computed mortality rate ratios between men and women for each type of diabetes, and T1D/T2D mortality rate ratios for men and women separately.
The standardized mortality ratio (SMR) was modeled the same way as the mortality but using the log of the expected number of deaths as offset, deriving the SMR as the mortality rate ratio between T1D, T2D and no diabetes.
A complete and detailed description of the models and procedures is given in the ESM section on Statistical methods.
Software and documentation
All registers mentioned were put at our disposal in de-identified, linkable form by the research service of Statistics Denmark. Approval for the project was granted by the Danish Data Protection board. For register processing, we used SAS V.12.4, including the %Lexis macro16; for statistical analyses and graphics, we used R V.3.6.0, using the Epi package, V.2.32.17 18
Documentation of the construction of the register and the analysis files of prevalence and follow-up can be found online (http://BendixCarstensen.com/DMreg/Reg2016.pdf), and a complete account of all statistical analyses based on these is also available (http://BendixCarstensen.com/DMreg/Ana2016.pdf).
Results
In the period 1996–2016, 448 445 persons were recorded in our register as patients with diabetes in Denmark (table ESM1), about 9% as T1D and the rest as T2D, and 83 441 (19%) were prevalent cases as of 1 January 1996. The median age at diagnosis for patients with T1D was around 30 years, slightly older for men than women, whereas it was around 63 for T2D, a bit older for women than for men (table ESM1).
Prevalence
The age-specific prevalences at 1996, 2003, 2010 and 2017 are shown in figure 1 separately for T1D and T2D; the detailed numbers by sex and calendar time are shown in tables ESM2 and 3, and illustrated in figure ESM1.
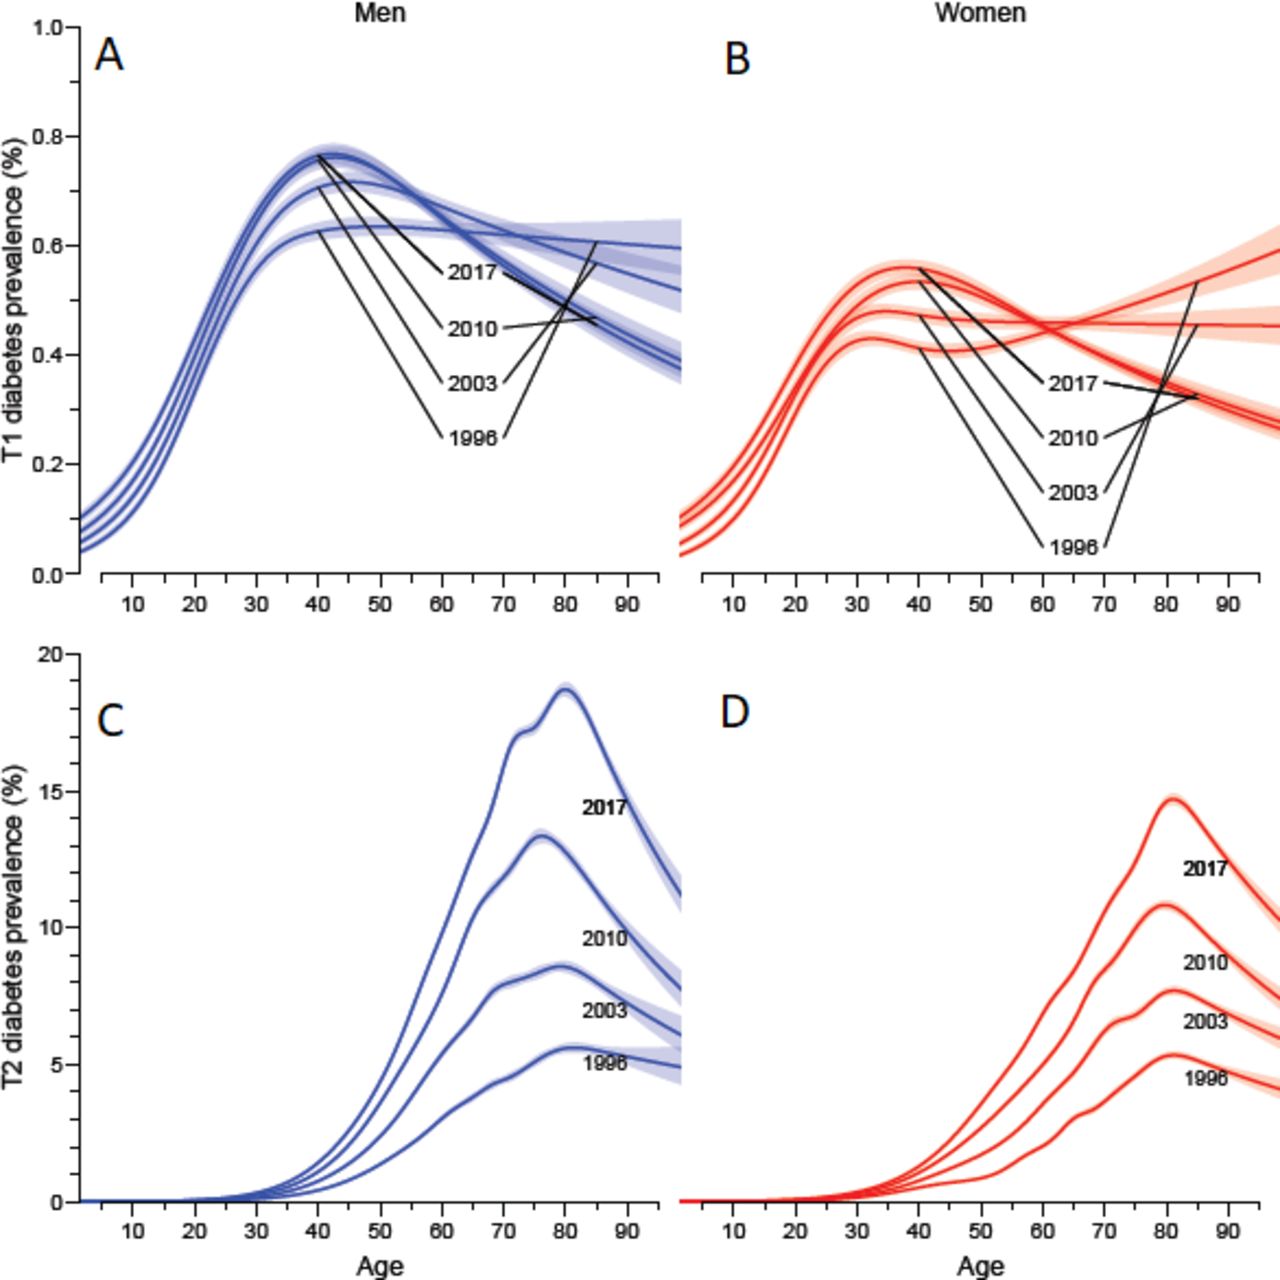
Age-specific prevalence of type 1 diabetes (A, B) and type 2 diabetes (C, D) in Denmark as of 1 January 1996, 2003,…, 2017. Note the different y-axes in the upper and lower panels. Blue curves are men, red curves women; shaded areas represent 95% CIs. (A) men, type 1 diabetes; (B) women, type 1 diabetes; (C) men, type 2 diabetes; (D) women, type 2 diabetes.
The crude prevalence of T1D (0–99 years of age) was quite stable at 0.5% for men and 0.4% for women over the study period, whereas the crude prevalence of T2D tripled over the study period, from 1.2% to some 4.5%, slightly more for men than women (table ESM3): an annual increase of 5.5% per year (table 1). The fraction of T1D among all patients with diabetes has consequently dropped from about 25% in 1 January 1996 to 10% at 1 January 2017 (table ESM2).
Average change (%/year) in prevalence, incidence, mortality and SMR of diabetes in Denmark over the period 1996–2016
For T1D the age-specific prevalence increased till about age 40 for men and about 30 for women (figure 1A,B). T2D showed a peak age-specific prevalence at 1 January 2017 age 80 at 19% for men and 16% for women (figure 1C,D).
Incidence
Over the study period 1996–2016, there was a total of 363 664 new cases of diabetes of which 19 712 (5.4%) were T1D (table ESM4). Persons over 100 and persons not resident at diagnosis were excluded.
For T1D, we found that incidence rates in younger ages were slightly increasing, whereas rates in older ages showed a decrease; the overall average a decrease of 3.5% per year (figure 2A,B, figure ESM2). For T2D, the patterns were almost identical in different ages, with an increase until 2011, a downturn until 2014 and an increase during the last 2 years of the study period (figure 2C,D).

Age-specific incidence rates in different ages as of 1 January 2015, derived from age–period–cohort models. Note the different y-axes in the upper and lower panels but that the relative extent of the axes is the same for type 1 diabetes and type 2 diabetes. Blue curves are men, red curves women; shaded areas represent 95% CIs. (A) men, type 1 diabetes; (B) women, type 1 diabetes; (C) men, type 2 diabetes; (D) women, type 2 diabetes.
The age–period–cohort models (figure ESM3) showed that men had higher incidence rates than women, and a somewhat different age pattern for T1D incidence rates. For men, there was an increase to about age 18, a plateau and a slight increase to age 40, whereas women showed an increase until about age 15 and a decrease after that.
The absolute sizes of the incidence rates of T1D and T2D are hard to compare because of the differences in ages at diagnosis, but broadly speaking T2D occur at 20–30 times the rates of T1D (figure ESM3).
Mortality and SMR
Mortality
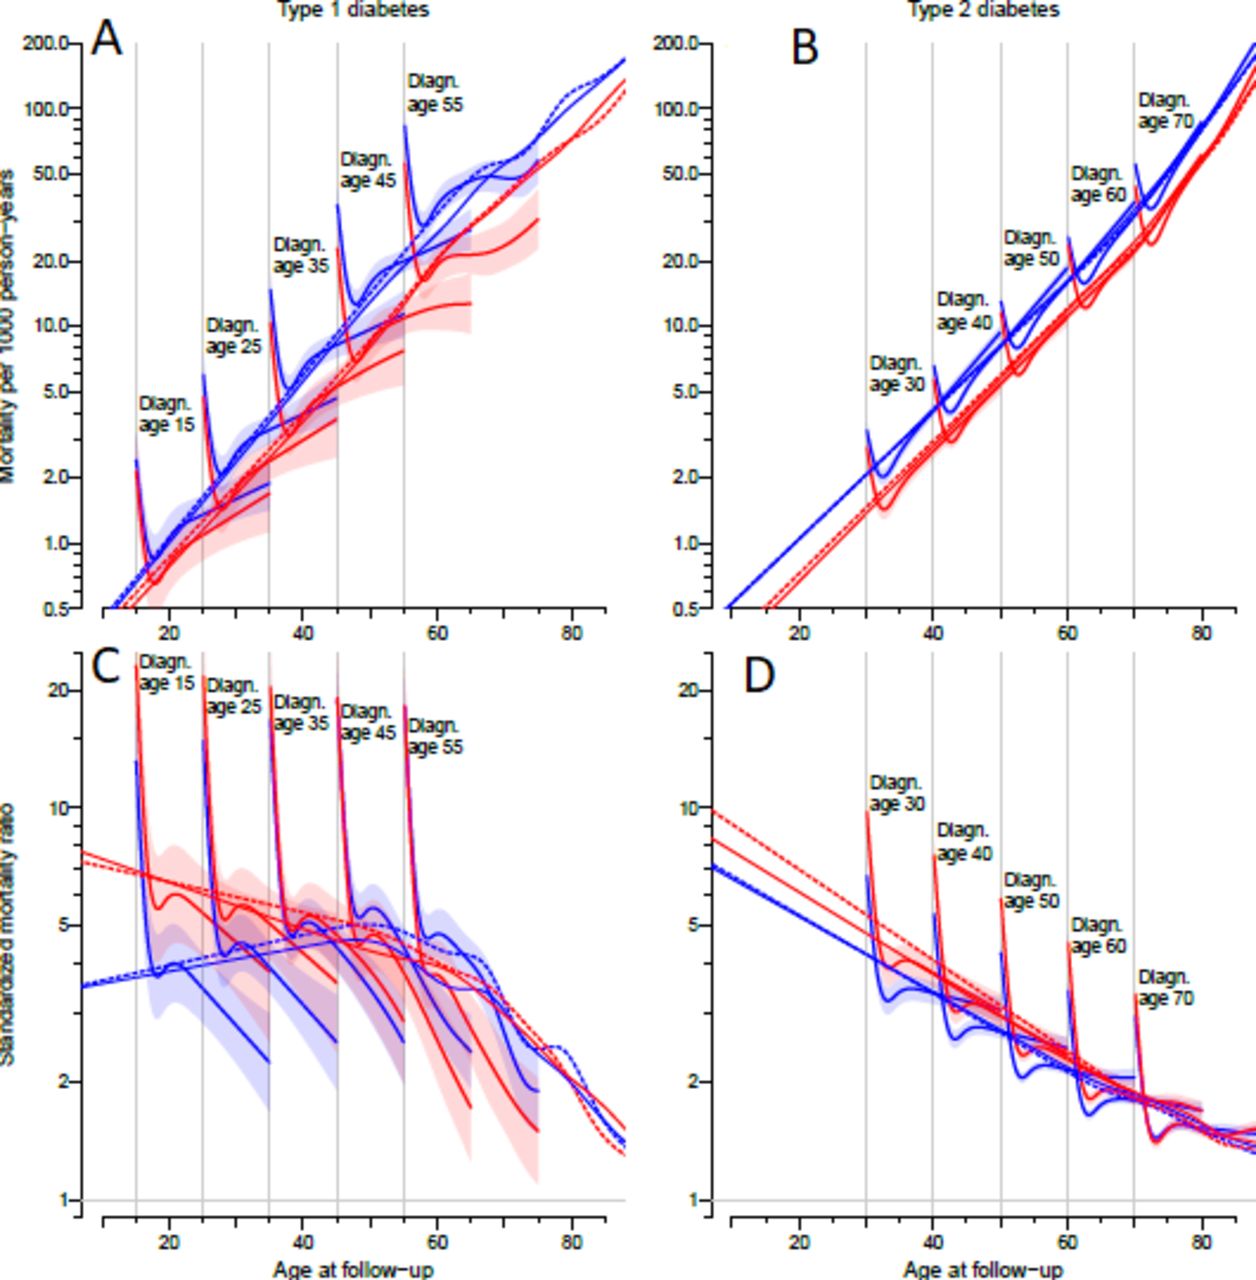
Figure 3 shows the mortality for patients with T1D and T2D by current age and duration of diabetes for select ages at diagnosis of diabetes. Each curve shows the joint effects of increasing age and increasing diabetes duration.

Age-specific mortality rates (A, B) and SMR (C, D) as of 1 January 2015 for type 1 diabetes (A, C) and type 2 diabetes (B, D). Each curve represents the mortality among patients diagnosed at ages 15, 25, 35, 45, 55 (type 1 diabetes) respectively 30, 40, 50, 60, 70 (type 2 diabetes), indicated by gray vertical lines. Each curve thus represents the joint effect of attained age and duration of diabetes for a given age at diagnosis and duration from 0 to 20 years. Thick dotted curves are from a model ignoring age at diagnosis and duration of diabetes; thin full lines additionally include prevalent cases as of 1 January 1996 in the modeling. Blue curves are men, red curves women. SMR, standardized mortality ratio.
Both for T1D and T2D, we saw an initial peak in mortality during the first 1–2 years after diagnosis, most pronounced for T1D (see figure 3A). For T1D, the mortality was smaller at a given age, the earlier a person was diagnosed (that is for longer diabetes durations), but this was not the case if follow-up was restricted to after 2005 (figures ESM4 and 5). For T2D men, there was a higher mortality for longer duration (earlier age at diagnosis) at any given age, whereas mortality in T2D women was independent of duration of diabetes beyond 5 years (see figure 3B); restricting follow-up to after 2005 resulted in a less pronounced effect of duration (figures ESM4 and 5).
We found that the mortality rate ratio between men and women were close to 1.5 both for T1D and T2D in all ages.
Finally, for T1D we saw an increase in mortality by calendar time until about 2005, but after this a consistent decrease (figure ESM4), the latter 4.9% per year, whereas the mortality in patients with T2D showed a consistent decrease over the entire study period of 2.9% per year (men: 3.3%/year, women: 2.5%/year, table 1).
Type 1 versus type 2 diabetes mortality ratio
We found a higher mortality among patients with T1D relative to T2D (figure ESM6); the first few years after diagnosis more than twofold, but at 10 years of duration the T1D/T2D mortality rate ratio was about 1.7, and decreasing by duration and hence by current age too. Overall, the T1D versus T2D mortality rate ratio was 1.86 (1.79;1.93) for men and 1.55 (1.48;1.63) for women.
Standardized mortality ratio
The SMR and the mortality in patients with diabetes relative to the mortality among persons without diabetes are shown in figure 3, evaluated at 1 January 2015.
For T1D, we found decreasing SMR by age/duration for a given age at diagnosis, and an overall SMR at 2015 of about 4 for men and 6 for women in younger ages, remaining at about 5 for both sexes until age 60 and declining to 2 for both sexes in age 80. We also found that the SMR on average was declining by some 2%/year (table 1) over the period after 2005.
For T2D, we found that beyond 5 years of duration, the slope in SMR by age/duration was somewhat smaller than the overall slope by age, with a smaller SMR the older the age at diagnosis. Thus, the decline in overall SMR by age for T2D is largely attributable to an effect of age at diagnosis and to a lesser extent an effect of current age. As for T1D, we also saw that the SMR for women is larger than for men, but we saw only a moderate decline of 0.6%/year (table 1).
Conclusions
Based on nationwide registers in Denmark, we described the prevalence, incidence and mortality of T1D and T2D. Our main findings are fivefold.
First, we found that the prevalence of T1D hardly changed over the last 20 years, while T2D increased from 1% to 4.5%, so that T2D now constitute 90% of all patients with diabetes. Second, the incidence of T1D increased slightly in the younger age groups,~2%/year, and declined in the older age groups, ~5%/year, over the study period. Third, the T2D incidence increased until 2011, declined until 2014, but seems to increase again after 2015. Fourth, the mortality of patients with T1D is more than 50% higher than that of patients with T2D. Finally, we found an excess mortality for T1D and T2D compared with the general population, highest for T1D.
The overall prevalence estimates by 1 January 2017 found in this study of 0.5% for T1D and 4.5% for T2D are in the range of findings from countries like Sweden, Norway and the USA.4 5 19
Most studies in T1D have reported the prevalence and incidence in children and youth, and only few have included older age groups as done in our study.20 ,21 22 The peak T1D incidence rates of 0.35 in men and 0.25 in women per 1000 PY up to late adolescence correspond to the rates found in countries like Sweden, Finland, Norway and UK with an incidence over 0.20 per 1000 PY.21–24
In our study, the incidence of T1D increased up to 20 years of age and after that declined for women, while it remained high for men until age 40 and then decreased. The excess incidence of T1D in men compared with women is consistent with findings from other studies in high-risk countries.25 26 Similar to our findings of differential calendar time trends in T1D incidence at different ages, a nationwide Swedish study also reported differential effects with increases in ages <15 years and decreases in the older age groups (25–34 years) from 1983 to 2007, which would imply a shift to younger age at diagnosis.24
In the older age groups, the T1D prevalence declined over the study period. This was unexpected and may be an artifact since improvements in healthcare should have kept the prevalence more stable. This could be due to changes in diagnostic criteria with a higher tendency to diagnose insulin-dependent individuals as T1D in the past with a shift to recognizing more of these as T2D in the later part of the study period. Since the T1D classification before 2005 primarily relies on the NPR records, miscoding of insulin using patients with T2D as patients with T1D may be partly responsible for this. This also results in an implausible increase in T1D mortality up to around 2005, so interpretation of T1D mortality trends prior to 2005 should be cautious.
For T2D incidence, we saw an increase up to 2011 followed by a downturn. The total number with T2D in Denmark was 252 516 by 1 January 2017, far from the 386 700 estimated by the International Diabetes Federation (IDF).27 IDF’s assumption was based on the former Danish Diabetes Register from 2012, and the huge overestimation by IDF underlines the importance of regularly updated criteria for disease monitoring. A decline in T2D incidence or plateauing has been reported in studies from Scotland,2 3 USA and Sweden, but in contrast to our study, the decline/plateauing happened earlier.1 4 28
A register-based study from Norway recently conducted by Ruiz et al found a decline in T2D incidence in the period 2009–2014 which after 2012 seemed to level off.5 Both in Norway and Denmark, the recommendation of HbA1c as diagnostic test for diabetes was introduced in 2012 and is therefore likely to contribute to changes in incidence rates around this time; however, while the incidence in Norway seemed to level off, we saw a decline. Whether the decline in T2D incidence observed after 2011 in ours and other studies is due to changes in diagnostic criteria, a true decline in incidence or because less undiagnosed cases is found, is unknown.
A decline in mortality among patients with diabetes have been reported in several countries. We also found a decline in absolute mortality among both T1D and T2D over the period but with differential trends for T1D and T2D depending on age at diagnosis and duration.2 3 29–31
We found that mortality rates of T1D are higher than those of T2D for patients of similar age, but with rate ratio dissimilar between men (rate ratio 1.84) and women (rate ratio 1.55). The higher mortality in T1D corresponds to what is seen in other studies.30 32 33
An Australian study found the all-cause mortality to decrease from 1997 to 2010 for both patients with T1D and T2D with a larger decrease than found in the general population.30 Similar trends have been observed in USA29 and Scotland, which is consistent with our finding of an SMR decline for T2D of 0.6% per year.2 3
Early age at diagnosis and hence longer duration of diabetes was associated with a smaller mortality among patients with T1D in our study but a larger mortality among patients with T2D, although the latter effect was small and mostly confined to men. This means that duration of T2D has limited effect beyond the first 2 years after diagnosis. In contrast with our results in T1D, a study by Rawshani et al conducted in Sweden reported a higher mortality with younger age at diagnosis of T1D, but it was not clear how this study included duration and current age, which may have affected the reported effect of age at diagnosis.34
The major strength of our study is that it covers the entire Danish population, the long coverage period of 21 years and our ability to distinguish T1D and T2D. Moreover, we have made full use of the register data by modeling the effects of age, calendar time and for mortality also the duration of diabetes, using the quantitative nature of the time variables age, duration and calendar time.
The weakness of our database is that inclusion date, which is used as proxy for date of diagnosis, is based solely on administrative records, and we may have defined prevalent cases among people migrating to Denmark as incident cases.
While the classification of patients as T1D or T2D based on the clinical reporting of cases to the DADD is a strength, the limited coverage of the DADD most likely underestimates the number of patients with T1D prior to 2005, and in particular among those who died before 2005, which possibly means that our mortality estimates for T1D prior to 2005 are downward biased. Analyses of mortality restricted to the period after 2005 indicated that our conclusions about duration effects may be biased downwards, and that mortality at a given age is increasing with increasing duration. Furthermore, T2D incidence among women under 40 may be underestimated due to the classification as possible patients with polycystic ovary syndrome if metformin only is used in the age range 18–40, and some insulin-treated T2D may be misclassified as T1D below the age of 30.
Overall, we have tried to improve sensitivity by inclusion of several data sources, particularly to capture patients with T2D treated in General Practice without a diabetes diagnosis in the National Patient Register. There is, however, still a risk of underestimating the T2D population not receiving antidiabetic treatment and not seeking regular eye examination or podiatry. The risk of including people without diabetes in the register is negligible while all included information is diabetes specific.
An administratively generated diabetes register as the one at hand reflects the organization of diabetes care in Denmark, primarily distinguishing between T1D and T2D, and other ICD-10 codes than DE10.x and DE11.x were excluded. This approach somehow ignores the growing clinical acknowledgment of several subtypes of diabetes, such as slowly evolving immune-mediated diabetes and ketosis-prone T2DM, but no data are available for further qualification of the categorization.
During a 21-year period, we observed increasing prevalence and incidence rates but with a decreasing incidence of T2D from 2012. From a public health and prevention perspective, it is imperative to confirm or deny the apparent increase in T2D incidence observed again after 2014. The incidence for T1D remained more stable over the period; however, reflecting differential patterns according to age at diagnosis, and the mechanisms underlying the increase in T1D incidence among children and adolescents remains unsolved. The decline in mortality was found both among T1D and T2D, but mostly for T1D in the most recent period, which may be due to improved treatment. Despite a reduction in mortality, patients with diabetes still experience an excess mortality relative to persons without diabetes, highest for patients with T1D. This can only partially be attributed to differences in disease duration, and quality measures of diabetes care in Denmark indicate a less aggressive approach to manage cardiovascular risk factors in T1D.35 The excess mortality underlines the need for continuous improvements in prevention and treatment of complications especially among patients with T1D.
Acknowledgments
We are grateful to the Danish Clinical Registries (RKKP) for providing access to the DADD and diaBase for the construction of the diabetes register. We appreciate the meticulous and speedy support of the Research Service of Statistics Denmark.
References
Footnotes
Contributors BC and MEJ conceived the structure of the underlying register and designed the study. PFR provided support for obtaining data access and contributed to data definition. BC detailed the statistical methods needed, performed all data analysis and wrote a first draft of the manuscript. MEJ and PFR contributed substantially to the writing of the manuscript. All authors contributed to critical revision and take responsibility for the content. BC is the guarantor of this work and, as such, had full access to all the data in the study and takes responsibility for the integrity of the data and the accuracy of the data analysis.
Funding The substudy regarding T1D was funded by Sanofi Aventis. The remainder of the study was funded through the core research budget of SDCC.
Disclaimer Sanofi Aventis had no influence on study design or analyses.
Competing interests BC and MEJ own shares in NovoNordisk. BC has received lecture and consultancy fees from NovoNordisk and LeoPharma. MEJ is PI on a trial sponsored by AstraZeneca, and received research grants from AMGEN AB, AstraZeneca, Sanofi Aventis and Boehringer Ingelheim. PFR has nothing to disclose.
Patient consent for publication Not required.
Ethics approval This study was approved by the Danish Data Protection Agency (registration no. 2015-41-4148). Ethical approval is not required for register-based studies in Denmark.
Provenance and peer review Not commissioned; externally peer reviewed.
Data availability statement Data may be obtained from a third party and are not publicly available. The data for this study are population-wide registers, placed at our disposal on the servers of Statistics Denmark. They are barred from release to the public on grounds of confidentiality. A full documentation of the register is given in the Electronic Supplementary Material.