Article Text

Abstract
Introduction The metabolic abnormalities underlying gestational diabetes mellitus (GDM) include increased insulin resistance and beta cell defects, but it is essential to clarify how insulin resistance and insulin secretion develop post partum in order to decide when and how to screen for type 2 diabetes. The purpose of the present study was to characterize and compare changes in insulin sensitivity, insulin secretion and hormonal status around parturition and 6 months post partum in women with gestational diabetes.
Research design and methods A longitudinal experimental study was performed at Aarhus University Hospital, Denmark. Eight women with GDM were examined at three identical visits: in late pregnancy (LP) between gestational age 34+0 and 36+6, early post partum (EPP) between 12 and 34 days post partum, and late post partum (LPP) 6 months post partum. An intravenous glucose tolerance test was performed, followed by a hyperinsulinemic euglycemic clamp. Blood samples were collected to assess metabolic, hormonal and inflammatory markers at each visit.
Results First and second phase insulin secretion and C-peptide concentrations were higher in late pregnancy than post partum (p<0.001). Insulin sensitivity index (ISI) was different at all three visits: ISILP=0.03±0.004, ISIEPP=0.09±0.008 and ISILPP=0.07±0.008) (p<0.001). Also, significant changes in lipids, leptin, glucagon, growth hormone and insulin-like growth factor-1 were seen when comparing the visits.
Conclusions Insulin sensitivity improves immediately after delivery in women with GDM but seems to deteriorate within the first 6 months post partum. Our findings underline the importance of having an increased awareness of the profound risk of developing type 2 diabetes after GDM.
Trial registration number NCT02770079.
- diabetes
- gestational
- insulin resistance
- diabetes mellitus
- type 2
- insulin secretion
This is an open access article distributed in accordance with the Creative Commons Attribution Non Commercial (CC BY-NC 4.0) license, which permits others to distribute, remix, adapt, build upon this work non-commercially, and license their derivative works on different terms, provided the original work is properly cited, appropriate credit is given, any changes made indicated, and the use is non-commercial. See: http://creativecommons.org/licenses/by-nc/4.0/.
Statistics from Altmetric.com
Significance of this study
What is already known about this subject?
Insulin sensitivity improves rapidly after parturition in women with gestational diabetes.
The risk of developing type 2 diabetes, in the years after a pregnancy with gestational diabetes, is substantial.
What are the new findings?
Insulin sensitivity improves immediately after delivery in women with GDM but seems to start deteriorating within the first 6 months post partum.
Insulin secretion was highest in late pregnancy compared to 2 weeks and 6 months post partum.
Leptin levels decreased shortly after delivery but was increased again 6 months post partum.
How might these results change the focus of research or clinical practice?
This underlines the importance of increased focus on the profound risk of developing type 2 diabetes after GDM and warrants initiatives shortly after delivery including dietary, lifestyle and pharmacological interventions aimed at preventing or delaying type 2 diabetes.
Introduction
Insulin sensitivity decreases by 50%–60% both in normal pregnancy and in pregnancies complicated by gestational diabetes mellitus (GDM).1 2 However, women who develop GDM have a decreased peripheral insulin sensitivity present already before conception3 and a beta cell dysfunction that cannot meet the increased insulin demands during pregnancy, resulting in hyperglycemia.1 The risk of developing type 2 diabetes, in the years after a pregnancy with GDM, is substantial. A meta-analysis showed a relative risk of 7.43 in women with GDM compared with those who had a normoglycemic pregnancy,4 and a Danish study has shown that 40% of women with GDM developed type 2 diabetes within 9.8 years after their index pregnancy.5 Most countries recommend that women with a history of GDM are screened for type 2 diabetes by an oral glucose tolerance test (OGTT) 4–12 weeks post partum and by measuring a hemoglobin A1c (HbA1c) every 1–3 years post partum.6 However, compliance in completing the OGTT post partum is poor and novel approaches in screening are in the process of being evaluated.7 8 Several studies have been performed aiming to describe glucose metabolism post partum,9–12 but the studies have either used surrogate measures for insulin sensitivity and insulin secretion9 or assessed insulin sensitivity using the gold standard method, hyperinsulinemic euglycemic clamp (HEC), either a few days after delivery or 1 year post partum.10–12
The scope of the current study was therefore to assess changes in insulin secretion and insulin sensitivity in women with GDM late in pregnancy, 2 weeks and 6 months after delivery, using the gold standard method: an intravenous glucose tolerance test (IVGTT) followed by a HEC. Also, in order to elucidate the maternal metabolic and hormonal factors determining changes in insulin sensitivity, correlations between insulin sensitivity and hormonal factors were performed. To assess inflammation as a potential cause of insulin resistance, we also analyzed inflammatory markers and correlated them with insulin sensitivity.
Methods and materials
Study participants
The study was carried out in Central Denmark Region at Aarhus University Hospital. Eight women with GDM were recruited from the outpatient clinic for pregnant women.
Inclusion criteria were women of European decent with GDM, gestational age (GA) between 32+6 and 36+6. Exclusion criteria were any chronic illness or medication that could affect insulin sensitivity.
Design
The study was a longitudinal observational study, in which participants were examined on three occasions. To obtain a measure of both insulin secretion (beta cell function) and insulin sensitivity during the same test, a 1-hour IVGTT followed by a 2-hour HEC, known as the ‘Botnia clamp’13 was performed. The clamp was performed in late pregnancy (LP) between GA 34+0 to 36+6, early post partum (EPP) approximately 2 weeks after delivery and late post partum (LPP) 6 months after delivery.
The three study days were identical as outlined in figure 1. After an overnight fast, the participants rested from 08:00 hours in a quiet, thermoneutral environment. The participants were fasting during the study day and those who were treated with insulin were told not to administer their morning insulin. Intravenous catheters were inserted in a heated dorsal hand vein for sampling of arterialized blood14 and in an antecubital vein on the contralateral arm for infusion of glucose, saline and insulin during the examination day. A baseline biochemical profile was obtained at t=−15 min, the IVGTT was performed from t=0–60 min and HEC was performed from t=60–180 min.

Outline of the study day.
For the IVGTT, a bolus of glucose from a 20% glucose solution in a dosage of 0.3 g/kg was given at t=0 min followed by blood sampling at t=0, 2, 4, 6, 8 and 10 min for estimation of first-phase insulin secretion (FPIS) and C-peptide concentrations. Blood was sampled at t=20, 40 and 60 min for assessment of second-phase insulin secretion (SPIS) and C-peptide concentrations. FPIS was quantified as the time t=0–10 min and SPIS as the time t=10–60 min incremental area under the curve insulin concentrations.13 The clamp was started at t=60 with an insulin infusion rate of 1.0 mU/kg/min (Insuman Rapid, Sanofi, France) until t=180 min. Plasma glucose was clamped at 5.0 mmol/L by adjusting the infusion rate of an intravenous infusion of 20% glucose (SAD, Denmark) according to plasma glucose measurements every 10 min (Beckmann Instruments, USA). Glucose was given with a carrier infusion of 0.9% NaCl and to prevent hypokalemia, 1 mmol/mL KCl was added to the glucose infusion. Steady-state serum insulin concentrations were measured at t=160, 170 and 180 min during the clamp. Insulin sensitivity was calculated as the mean glucose infusion rates (mg/kg/min) during the last 30 min of the clamp, the M-value.15 Insulin sensitivity index (ISI) was calculated as the M-value divided by the steady-state serum insulin concentrations.13
Assays
Creatinine, estimated glomerular filtration rate, electrolytes, cholesterol, triglycerides, hemoglobin and HbA1c were analyzed immediately after blood sampling by a certified medical laboratory technician. The remaining analyses were performed in batch after completion of all study days: insulin (DAKO, Denmark), C-peptide (ALPCO, USA) and glucagon (Mercodia, Sweden) were analyzed by ELISA. Non-esterified fatty acids (NEFA) were analyzed with a commercial kit (Wako Chemicals, Germany). High-sensitive C reactive protein (HS-CRP, BAM 17072 and MAB 17071, R&D Systems Europe, UK) was analyzed using an in-house ELISA assay. Adiponectin was analyzed using a commercial time-resolved immunofluorometric assays (TR-IFMAs; Autodelfia, PerkinElmer, Finland). Plasma mannose-binding lectin (MBL) was determined by a TR-IFMA as previously described.16 Growth hormone (GH) and insulin-like growth factor-1 (IGF-1) were analyzed using a commercial assay based on chemiluminescence technology as previously described (IDS-iSYS platform; Immunodiagnostic Systems, UK).17 IGF-binding protein 1 (IGF-BP1) was measured using an in-house TR-IFMA as previously described.18 The IGF-BP1 assay had intra-assay and inter-assay coefficient of variation (CVs) of 5% and 8.1%, respectively.
Leptin was determined by a validated in-house TR-IFMA based on commercial reagents (R&D Systems, UK).19 Detection limit was 0.4 µg/L, and intra-assay CV and inter-assay CV was <5% and <10%, respectively, as previously described.19 Fibroblast Growth Factor-21 (FGF-21) was quantified by commercially available monoclonal antibodies (R&D Systems, DY2539) modified into a TR-IFMA assay as previously described.20 Limit of detection was 1 ng/L and intra-assay and inter-assay CVs were <6% and <10%, respectively.
Plasma cytokines; IL-6 and tumor necrosis factor-alpha (TNF-α) were measured by magnetic Luminex assays (Pro Human cytokine screening 48-plex (BioRad, USA). Samples were measured in duplicates and analyzed using the BioPlex Manager V.6.0 software (Bio-Rad). Detection limit was 0.34, 0.69 and 1.13 pg/mL, respectively. Notably, IL-10 concentrations were below detection limit in the majority of the samples and thus not reported. The plasma and serum were then transferred to 1.8 mL tubes and stored at −80°C until analysis.
Statistical analyses
Results are expressed as mean±SE if parametric or median (range) if non-parametric. Repeated-measurement analysis of variance was used to compare the paired data between the visits. Both the repeated measurements for every visit, the repeated measurements for each woman and the missing values were taken into account by using nested random effects in a mixed model. If non-parametric, measurements were analyzed on log scale, and results were back-transformed to obtain relative comparisons. When significant, Bonferroni’s post hoc test was applied to adjust for multiple comparisons in order to determine how the visits differed from each other. Model validation was performed by visual inspection of residuals, fitted values and random effect estimates, which did not give cause to reject the model. To measure associations between two continuous variables, we used a Pearson product-moment correlation coefficient.
Power calculations were based on the primary end point, insulin sensitivity, expressed as the M-value during the clamp. We wanted to be able to detect a difference ≥14% and based on our previous HEC studies, we set the SD of the M-value at 10%. With a power of 80% and an α-value of 5%, eight subjects had to be included. Statistical significance was defined as p<0.05. All calculations were carried out using STATA V.13.
Results
Eight women with GDM were included in the study. Table 1 presents anthropometric data from the first visit. The mean age was 33.5 years±1.25, prepregnancy body mass index (BMI) 24.7±0.7 and fetal birth weight 3377 g±206. Four of the women were nullipara, three were primipara and one was multiparous (P2). None of the women had polycystic ovarian syndrome (PCOS), but three of the women were treated with small doses of insulin (mean daily dose=10.9±3.9 IU). The median GA at the visit in late pregnancy (LP) was 35 weeks+6 days (34+0; 36+6). The EPP and the LPP visit were carried out 16 (12; 34) and 192 (170; 263) days post partum, respectively. All women were breastfeeding EPP, but LPP one had stopped.
Anthropometrics of the participants
Βeta cell function
Figure 2 shows first and second phase insulin secretion and C-peptide and plasma glucose concentrations at every visit. First and second phase insulin secretion were found to be highest in LP, compared with both EPP and LPP (p<0.001). Thus, first phase insulin secretion decreased with 73% from LP to EPP but was only decreased by 57% at LPP. The decrease in second phase insulin secretion was 74% (LP vs EPP) and 50% (LP vs LPP), respectively. First and second phase concentrations in C-peptide were also highest at LP compared with EPP and LPP (p<0.001) with a decrease in first phase C-peptide of 55% from LP to EPP and a decrease of 33% from LP to LPP. The decrease in second phase C-peptide was 56% (LP vs EPP) and 44% (LP vs LPP), respectively. Although the concentrations of insulin and C-peptide were lower LP than LPP, the postpartum visits did not differ statistically. First and second phase plasma glucose were the same at all three visits.
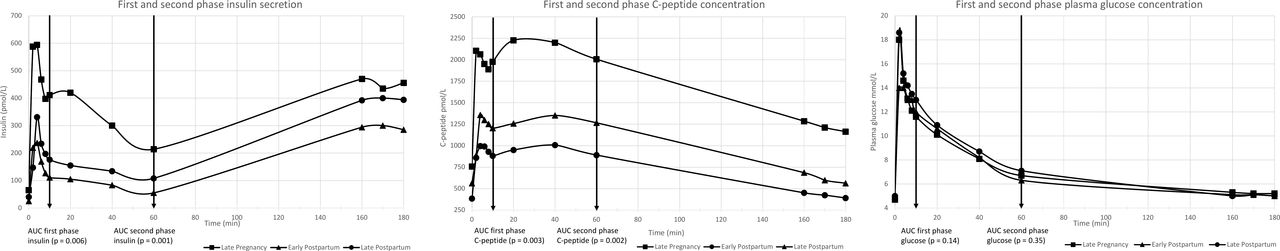
First and second phase secretion of insulin and C-peptide and plasma glucose concentrations.
Insulin sensitivity
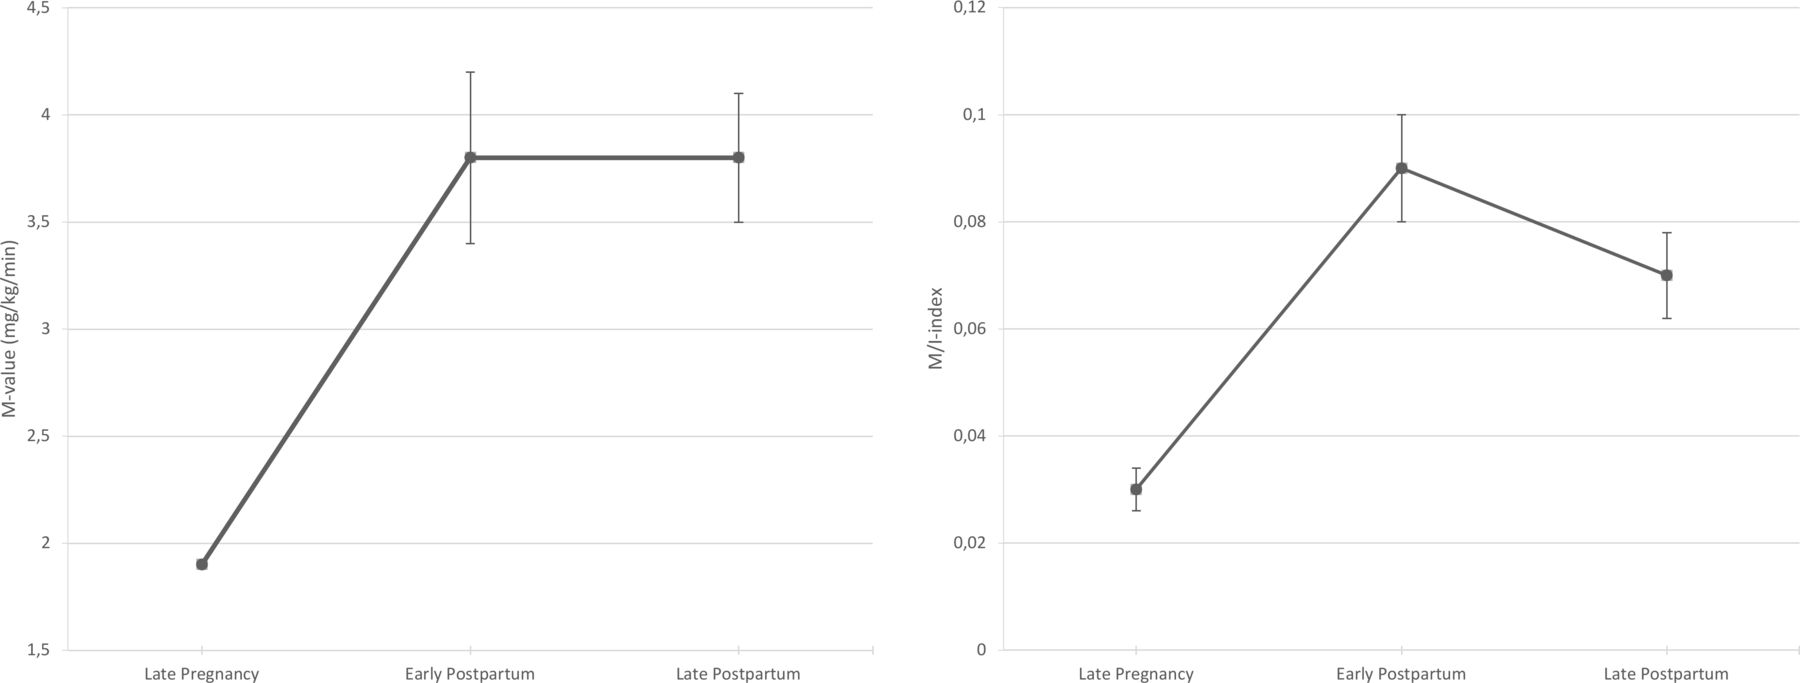
Insulin sensitivity, expressed by the mean M-value, was lowest LP (MLP) (1.9±0.1) compared with insulin sensitivity post partum (MEPP=3.8±0.4 and MLPP=3.8±0.3 (p<0.001). Insulin sensitivity EPP and LPP did not differ from each other (p=1.0) When adjusting for the steady-state serum insulin concentrations during the clamp, insulin sensitivity expressed as the ISI differed at all three visits: ISILP=0.03±0.004, ISIEPP=0.09±0.008 and ISILPP=0.07±0.008) (table 2 and figure 3), with the lowest insulin sensitivity in late pregnancy, the highest insulin sensitivity early post partum and a subsequent decrease in insulin sensitivity late post partum.
Insulin sensitivity at each visit: M-value and insulin sensitivity index (ISI).
Metabolic, hormonal and inflammatory parameters
Metabolic, hormonal and inflammatory markers
Table 2 shows all metabolic, hormonal and inflammatory markers of all the participants at each visit. Cholesterol and high-density lipoprotein (HDL) were lowest LPP (p<0.03), whereas low-density lipoprotein (LDL) and triglyceride were highest EPP and LP, respectively (p=0.001). Glucagon decreased through all three visits (p<0.0001). IGF-1 and IGF-BP1 were highest LP compared with the two other visits and decreased post partum. Pituitary GH was lowest LP but only reached the level of statistical difference when compared with LPP (p<0.001).
Leptin and MBL concentrations were highest LP, but the differences only reached the level of statistical difference between LP and EPP (leptin: p=0.002, MBL: p=0.04). We observed no difference in HbA1c, plasma glucose, creatinine, NEFA, thyroid-stimulating hormone, adiponectin, FGF-21, HS-CRP, IL-6 or TNF-α, comparing the three visits.
At LP and LPP, we found a negative correlation between insulin sensitivity expressed by the M-value and leptin concentration, LP: r=−0.72, p=0.043 and LPP: r=−0.77, p=0.04. The same association was not found at EPP. In addition, there was a positive correlation between the M-value and IGF-1 at EPP: r=0.88, p=0.02. For glucagon we found a negative correlation with the M-value at LPP: r=−0.78, p=0.04. We found no associations between insulin sensitivity and adiponectin, IGF-BP1, HS-CRP, GH, FGF-21, MBL, IL-6, TNF-α, cholesterol, HDL, LDL, triglyceride or NEFA at any visits (table 3).
Associations between M-value and selected hormones, lipids and IL-6
Discussion
Insulin secretion
During pregnancy, there is an increase in beta cell mass through proliferation and hypertrophy of the beta cells21 and the adaptations seem to occur in the beta cells prior to the onset of insulin resistance. The inability to produce sufficient insulin can be due to the lipotoxicity and glucotoxicity that are prominent in type 2 diabetes and GDM and a possible cause of the beta cell dysfunction.22 In our study, we found that both first and second phase insulin and C-peptide concentrations were higher in late pregnancy compared with 2 weeks and 6 months post partum. The insulin responses post partum were comparable, but the C-peptide levels were higher 6 months post partum, which is in accordance with the decrease in insulin sensitivity that we find 6 months post partum. Catalano et al23 examined insulin secretion by an IVGTT in seven women with GDM and in eight pregnant women with normal glucose tolerance (NGT) before conception, at 12–14 weeks and at 34–36 week’s gestation and showed that there was a significant 60% increase in first-phase insulin response to intravenous glucose infusion and a 130% increase in second phase insulin response with advancing gestation in obese women with NGT, whereas in lean women with NGT, there was a 200%–250% increase in insulin response to the same glucose stimulus. Women with GDM had significantly greater second phase response compared with the control group but there was no difference in the first phase insulin response.23 There are, to our knowledge, no previous studies that have performed IVGTTs in women with GDM 6 months post partum.
In a study by Waters et al,9 insulin secretion was estimated by an OGTT in late pregnancy, 1–5 days after delivery and 6–12 weeks post partum. They reported improvement in insulin production within the first few days post partum. The improvement in insulin production compared with late pregnancy persisted after 6–12 weeks. In our study, insulin secretion, although not significantly, was increased LPP compared with EPP. This could indicate a beginning compensation for the slowly increasing insulin resistance.
Insulin sensitivity
This study reports measurements of beta cell function by an IVGTT combined with a HEC at three important time points: late in pregnancy between GA 34+0 to 36+6 (LP), approximately 2 weeks post partum (EPP) and 6 months post partum (LPP). Insulin sensitivity improved twofold to threefold immediately after delivery, but already after 6 months postpartum insulin sensitivity decreased compared with 2 weeks after delivery. As insulin levels and C-peptide levels were different on the three study days, we corrected for insulin levels and used ISI as the most correct and valid measure of insulin sensitivity.
Kirwan et al10 and Friedman et al11 studied the changes in insulin sensitivity post partum by performing a HEC in women with NGT10 and in women with GDM11 in late pregnancy (week 30–36) and 1 year post partum. Insulin sensitivity improved 74% from late pregnancy to 1 year post partum in the women with NGT but there was no significant improvement in insulin sensitivity in the women with GDM 1 year post partum. In a study by Ryan et al,12 insulin sensitivity was assessed by a HEC in late pregnancy and again 3 days post partum in women with GDM and NGT, respectively, and found that insulin resistance was ameliorated shortly after delivery. The postpartum values did not differ significantly from the values obtained from a non-diabetic, non-pregnant group, but only four women were included in the postpartum studies (two women with GDM and two women with NGT).12 In the study by Waters et al,9 the authors reported that delivery was associated with an improvement in insulin sensitivity within the first few days, but after 6–12 weeks, a slight deterioration was found. This supports the findings in our study and indicates that the resurgence of insulin resistance might start before the 6 months we used in our study.
The level of insulin resistance in our study is striking. Late in pregnancy the M-value was 1.9 mg/kg/min, compared with 2.4 mg/kg/min in the seven women with GDM, examined in the study by Catalano et al at the same insulin infusion.23 Moreover, the M-value was 3.8 mg/kg/min post partum in our study, compared with the prepregnancy M-value of 5.4 mg/kg/min in the study by Catalano et al.
Hjerrild et al24 examined insulin sensitivity in healthy, non-pregnant women at the same age (33±5 years) and BMI (24.5 kg/m²) and at the same insulin dose (1.0 mU/kg/min) as in our study and found, that their M-value was 8.9 mg/kg/min, underlining that the women in our study are very insulin resistant, although they do not present with diabetes post partum. This illustrates that women who develop GDM, compared with women with NGT, have an impaired glucose metabolism both before, during and after pregnancy, why they are more prone to develop type 2 diabetes in the years following pregnancy.
Hormonal and inflammatory markers
In the present study, we found that leptin levels decreased shortly after delivery but increased again 6 months post partum. Highman et al25 evaluated the longitudinal changes in maternal serum leptin concentrations before pregnancy, in early pregnancy (12–14 weeks) and in late pregnancy (34–36 weeks) in 10 women and reported that leptin levels increased with 66% from prepregnancy (25.4±19.9) to late pregnancy (38.4±27.3) and found a positive correlation between leptin and body fat. In our study, we found leptin levels late in pregnancy comparable to those in the study by Highman et al (32.9±7.3) and that leptin levels almost halved post partum (17.3±2.2) and were significantly negatively correlated with insulin sensitivity, supporting that leptin play a role in insulin resistance in pregnancy. It is well known that leptin is produced by adipocytes why the correlation between fat mass and leptin is strongly positive.26 Unfortunately, we were not able to obtain fat mass estimates from the participants and therefore this association remains unexplored in our study.
Our finding that leptin is negatively correlated with insulin sensitivity is in line with the findings of Kirwan et al,27 who performed a study including 5 women with GDM and 10 women with NGT where HEC was carried out before pregnancy, early in pregnancy (GA 12–14 weeks) and in late pregnancy (GA 34–36 weeks). Insulin sensitivity was here strongly negatively associated with leptin levels late in pregnancy.
McIntyre et al28 also describe a negative correlation between leptin and insulin sensitivity based on IS-OGTT and IS-HOMA in late pregnancy in pregnant women with NGT. Altogether, McIntyre et al28 conclude that the variance in maternal insulin sensitivity in pregnancy is associated with leptin and the GH axis as IGF-BP1 was positively correlated with insulin sensitivity. This is in accordance with our study, as we found a positive correlation between IGF-1 and insulin sensitivity shortly after delivery. IGF-I has structural homology with insulin and a study done by Friedrich et al29 found a U-shaped association between IGF-1 and insulin resistance as both low and high levels of IGF-1 were related to insulin resistance. The mechanism of this complex relationship remains to be fully understood.
In parallel with other studies, we found that MBL levels were very high in late pregnancy with a substantial decrease shortly after delivery. According to van de Geijn et al,30 MBL increases already in the first trimester of pregnancy up to 140% of the baseline level with a sharp decrease after delivery. The authors hypothesize that the rise in MBL contributes to a normal placentation and pregnancy, and that it might reflect a shift from adaptive to innate immunity in pregnancy, ameliorating certain autoimmune diseases. We examined the associations with MBL and insulin sensitivity, as previous studies have found that serum MBL levels are positively related to insulin sensitivity in women with PCOS.31 We did however, not find a correlation between insulin sensitivity and MBL in our study, which could be due to lack of power. Interestingly, glucagon decreased significantly through all three visits and we found a negative correlation between glucagon and the M-value at visit 3. Beis et al32 found that plasma glucagon levels were higher (p<0.05) in women with GDM compared with normal pregnant women at baseline and after an OGTT. Another recent study also found an impaired glucagon suppression in patients with GDM when performing a 75 g OGTT during mid-gestation.33 Thus, the absence of suppressibility of glucagon in women with GDM might be involved in the pathogenesis of glucose intolerance in women with GDM,32 but its role still remains to be fully elucidated.33
Regarding inflammatory markers, Kirwan et al27 also measured TNF-α in the before mentioned study and found that insulin sensitivity was negatively associated with TNF-α and was found to be the best predictor of insulin sensitivity in pregnant women. In the current study, we did however not find any increase in TNF-α and no correlations between TNF-α and insulin sensitivity. We did not find changes in the levels of TNF-α, IL-6 or HS-CRP when comparing the three visits either. This is in contrast to Christian and Porter,34 who measured IL-6, TNF-α and CRP in pregnant, non-diabetic women with a BMI >18.5 kg/m² in the first, second and third trimester and post partum and found that IL-6 and TNF-α increased during pregnancy with a further increase post partum. CRP, on the other hand, decreased during the period, whereas we were unable to detect a difference in HS-CRP.
Strengths and limitations
The obvious strength of our study is the methods used to assess insulin secretion and insulin sensitivity. The HEC is widely acknowledged as the gold standard for evaluating insulin sensitivity. It is both reproducible and sensitive and by using an IVGTT to assess insulin secretion, the potential impact of the incretin hormones on insulin secretion is eliminated. In addition, our study contributes with new knowledge on how insulin sensitivity and insulin secretion alter 6 months post partum in women with GDM, as previous studies have evaluated these parameters a few days or a year after delivery.
The small sample size in our study could be considered a weakness. Nevertheless, studies similar to ours examining women with GDM with labor-intensive methods as IVGTT and HEC have also only included a small number of participants (Ryan n=2 (GDM), Kirwan n=5 (GDM), Schmitz n=6 (type 1 diabetes)).12 27 35 As the methods used have a high degree of precision and reproducibility only few participants are needed to capture differences, as predicted by our power calculation. The power calculations are solely based on the primary end point, insulin sensitivity and not the biochemical and hormonal parameters. However, previous studies evaluating hormonal correlations during pregnancy, also report small numbers of participants,25 as recruitment of pregnant participants to laborious experiments can be challenging.
Conclusion
In this study, we show that insulin sensitivity in women with GDM already starts to deteriorate within 6 months post partum. This underlines the importance of increased focus on the profound risk of developing type 2 diabetes after GDM and warrants initiatives shortly after delivery including dietary, lifestyle and pharmacological interventions aimed at preventing or delaying type 2 diabetes.
Acknowledgments
The authors would like to thank laboratory technicians Annette Mengel, Hanne Petersen and Lisa Buus for invaluable assistance with biochemical analyses and assistance during the study day. The authors would also like to thank the women and their families who participated in the study.
References
Footnotes
Contributors PO, UK and NM conceived the study, GOS, JF and PO recruited the participants, GOS, UK, JF and PO designed and planned the experiments, GOS and UK coordinated the work and carried out the experiments. GOS, UK and SK collected data. GOS and UK analyzed the data and wrote the manuscript. NM, JF and PO contributed to the discussion. All authors provided critical feedback on the design, experiments, analyses and manuscript.
Funding The study was supported by donations from ‘Johan Boserup og Lise Boserups Legat’ and The Augustinus Foundation. GOS and UK are supported by the Danish Diabetes Academy, funded by the Novo Nordisk Foundation. PO received financial support from the Novo Nordisk Foundation.
Disclaimer statement The funding sources had no role in the study design, inclusion process, data analysis or statistical considerations or in the writing of this report.
Competing interests None declared.
Patient consent for publication Not required.
Ethics approval The study was approved by the Regional Ethical Committee and was conducted in accordance with the Helsinki Declaration. The purpose of the study was explained to all the participants before written consent was obtained.
Provenance and peer review Not commissioned; externally peer reviewed.
Data availability statement Data are available on reasonable request, pending approval from the relevant ethical committees. The authors confirm that, for approved reasons, some access restrictions apply to the datasets generated during and/or analyzed during the current study underlying the findings.