Article Text

Abstract
Background Diabetes mellitus (DM) is common in the general population and it poses a heavy burden to society in the form of long-term disability, healthcare use and costs. The pancreas is a key player in glucose homeostasis, but the occurrence of newly diagnosed DM after acute pancreatitis (AP), the most frequent disease of the pancreas, has never been assessed systematically. The aim of this study was to conduct a systematic literature review to determine the prevalence and time course of DM and related conditions after the first attack of AP as well as the impact of covariates.
Methods Relevant literature cited in three electronic databases (Scopus, EMBASE and MEDLINE) was reviewed independently by two authors. The main outcome measures studied were newly diagnosed prediabetes, DM, or DM treated with insulin. Pooled prevalence and 95% CIs were calculated for all outcomes.
Results A total of 24 prospective clinical studies, involving 1102 patients with first episode of AP, met all the eligibility criteria. Prediabetes and/or DM was observed in 37% (95% CI 30% to 45%) individuals after AP. The pooled prevalence of prediabetes, DM and treatment with insulin after AP was 16% (95% CI 9% to 24%), 23% (95% CI 16% to 31%), and 15% (95% CI 9% to 21%), respectively. Newly diagnosed DM developed in 15% of individuals within 12 months after first episode of AP and the risk increased significantly at 5 years (relative risk 2.7 (95% CI 1.9 to 3.8)). A similar trend was observed with regard to treatment with insulin. The severity of AP, its aetiology, individuals’ age and gender had minimal effect on the studied outcomes.
Conclusions Patients with AP often develop prediabetes and/or DM after discharge from hospital, and have a greater than twofold increased risk of DM over 5 years. Further studies are warranted to determine the optimal strategy for its detection and whether the risk of developing DM after AP can be reduced.
- PANCREATITIS
Statistics from Altmetric.com
Significance of this study
What is already known on this subject?
-
Diabetes mellitus is a growing health problem worldwide.
-
The pancreas plays an important role in regulation of blood glucose.
-
Risk of diabetes mellitus and related conditions after first attack of acute pancreatitis has never been systematically evaluated.
What are the new findings?
-
Prediabetes and diabetes are common after acute pancreatitis, and occur in nearly 40% of patients after hospital discharge.
-
Prevalence of newly diagnosed diabetes is much higher after acute pancreatitis (23%) than the prevalence of diabetes in the general population (4–9%).
-
Risk of diabetes increases by at least 2 times after 5 years as compared with 12 months.
-
Severity of acute pancreatitis appears to have minimal effect on risk of diabetes and related conditions.
How might it impact on clinical practice in the foreseeable future?
-
Patients recovered from an attack of acute pancreatitis may need follow-up and screening for glucose intolerance.
-
Further clinical studies are warranted to investigate whether optimisation of inhospital management of acute pancreatitis can reduce the risk of developing diabetes after discharge.
Background
Diabetes mellitus (DM) is one of the most common non-communicable diseases worldwide. In 2010, more than 25 million people were diagnosed with DM in the USA alone.1 It is the seventh leading cause of death in the USA and the overall risk for death among people with diabetes is about double that of people without diabetes.1 Individuals with DM have an increased risk of developing coronary heart disease,2 stroke,3 end-stage renal failure,4 lower extremity ischemia5 as well as visual impairment and blindness.6 From the health and economic perspective, individuals with DM require at least 2–3 times the healthcare resources compared with individuals without it, and diabetes care accounts for up to 15% of national healthcare budgets.7––9 The socioeconomic burden of prediabetes runs parallel to that of DM. The US estimates for 2010 show that prediabetes affected 79 million people.1 It represents a key stage in the natural history of DM as these people are at a much higher future risk than the general population for developing diabetes.10 ,11 Approximately 40% of subjects with prediabetes progress to diabetes over 5–10 years. Because of this, and the association with other known cardiovascular risk factors, including hypertension, dyslipidaemia and obesity, prevention and timely diagnosis of prediabetes and DM have important implications.12 ,13 WHO has published a report on possible benefits of screening for individuals with impaired glucose homeostasis.14 This includes closer monitoring and selective screening in known high-risk individuals allowing early identification of patients with impaired glucose tolerance,15 and hence enabling implementation of strategies to prevent or delay onset of DM.16
Acute pancreatitis (AP) is the most common pancreatic disease, and hyperglycaemia is the common early feature17 ,18 that has been used in prognostic models.19–22 This hyperglycaemia is generally considered as a transient phenomenon that completely resolves in almost all patients. This may explain why glucose homeostasis is not routinely monitored after discharge from hospital. The data on the prevalence of newly diagnosed prediabetes and DM after AP are conflicting. Some reports suggest that glucose homeostasis recovers completely,23 while others demonstrate that it is persistent in a considerable proportion of patients.24–28 A recent study has also shown that patients with ‘transient’ hyperglycaemia in acute illness are at increased risk of developing DM.29 Further, the time course of prediabetes and DM after an episode of AP remains unclear, as does the influence of AP aetiology and severity.
The aim of this study is to systematically review the prevalence, time course, and covariates of prediabetes and DM after the first attack of AP.
Methods
Search strategy and study selection
The search strategy was developed to identify all prospective clinical studies that reported the change in glucose homeostasis after discharge from hospital following the first episode of AP. An electronic literature search of three databases (MEDLINE, Scopus, and EMBASE) was conducted until 31 May 2013. The earliest available abstracts reviewed were from 1946 for MEDLINE, 1966 for Scopus and 1980 for EMBASE.
The search strategy used was as follows:
MEDLINE and EMBASE: ‘acute pancreatitis’ AND (‘endocrine insufficiency’ OR ‘ endocrine function’ OR ‘pancreatitis function’ OR ‘diabetes mellitus’ OR ‘pre diabetic state’ OR ‘type 2 diabetes mellitus’ OR ‘type 1 diabetes mellitus’ OR ‘adult onset diabetes mellitus’ OR ‘maturity onset diabetes’ OR ‘non-insulin dependent diabetes’ OR ‘insulin dependent diabetes’ OR ‘glucose intolerance’ OR ‘glucose homeostasis’).
Scopus: ‘acute pancreatitis’ AND (‘endocrine insufficiency’ OR ‘ endocrine function’ OR ‘pancreatitis function’ OR ‘ diabetes mellitus’ OR ‘pre diabetic state’ OR ‘type 2 diabetes mellitus’ OR ‘type 1 diabetes mellitus’ OR ‘adult onset diabetes mellitus’ OR ‘maturity onset diabetes’ OR ‘non-insulin dependent diabetes’ OR ‘insulin dependent diabetes’ OR ‘glucose intolerance’ OR ‘glucose homeostasis’) AND (LIMIT-TO(EXACTKEYWORD, ‘Human’))
Bibliographies of all included studies were also reviewed for other relevant articles. The search was limited to publications in English.
Only prospective clinical studies of adult patients (aged >18 years) with a first attack of AP and with a follow-up period of at least 1 month after hospital discharge were included. The main outcome measures studied were prediabetes, DM and DM treated with insulin.
Studies were excluded if they did not state that patients had no previous history of DM or prediabetes, or they did not provide data specifically on patients with no previous history of DM or prediabetes. Studies were also excluded for the following reasons: duplicate publication, retrospective study design, case report, did not use the standard definition of pancreatitis (the presence of two of the following three features: abdominal pain characteristic of AP, serum amylase and/or lipase three times the upper limit of normal and/or characteristic findings of AP on computed tomography scan), study population limited to patients who underwent pancreatic surgery such as necrosectomy or pancreatic resection, study population limited to patients with chronic, autoimmune, or hereditary pancreatitis, gestational diabetes.
Records extracted by the initial search were screened, and potentially relevant papers were retrieved and examined in more detail. Eligibility assessment was performed independently by two authors (SLMD and PPS) and any disagreement over study inclusion or exclusion was resolved by discussion with the senior author (MSP).
Data extraction
Data were independently extracted by two authors (SLMD and PPS) using a standardised data collection form. For each eligible study the following data were extracted: (1) year conducted, (2) country/countries, (3) number of participating centres, (4) study design (eg, cohort, case-control study), (5) source of control (if applicable), (6) method of data collection, (7) criteria used to diagnose AP and classify its severity, (8) number of individuals with complete data, (9) age, (10) proportion of male individuals, (11) Body Mass Index (BMI) of these individuals, (12) aetiology of AP (ie, biliary, alcohol, other), (13) duration of follow-up period, (14) glucose homeostasis test employed, (15) criteria used to define prediabetes and DM, (16) occurrence of prediabetes, DM and DM treated with insulin, (17) number of patients with pancreatic necrosis, and (18) the presence and influence on glucose homeostasis of further attacks of AP during follow-up period. If any of these parameters were not available from the published study, the corresponding authors were contacted to provide further information.
Quality assessment
The Newcastle-Ottawa Scale (NOS),30 a widely accepted tool to assess the quality of observational studies, was used. It allocates a maximum of nine points based on three aspects of study design: patient selection, comparability of study groups, and exposure and outcome of study participants. Studies were considered to be of high quality if scored 5 or greater points, and of low quality if points scored were 4 and below.31
Definitions
Prediabetes was defined by specific fasting blood glucose (FBG) and/or 2 h oral glucose tolerance test (OGTT) criteria as reported by the study authors (FBG ≥5.6 mmol/L (100 mg/dL) and <7.0 mmol/L (126 mg/dL), or ≥ 6.1 mmol/L (110 mg/dL) and <7.0 mmol/L (126 mg/dL) and 2 h OGTT ≥7.8 mmol/L (140 mg/dL) and <11.1 (200 mg/dL)). DM was defined as reported by the authors of primary studies (FBG ≥7.8 mmol/L (140 mg/dL) or 2 h OGTT ≥11.1 mmol/L (200 mg/dL) or FBG ≥7.0 mmol/L (126 mg/dL)) and/or treatment with insulin, oral hypoglycaemia agents or specific dietary management. Treatment with insulin was defined as DM requiring permanent insulin therapy at follow-up (provided the mean follow-up time was equal to or greater than 3 months). Prevalence of prediabetes, DM and DM treated with insulin after AP was defined as the proportion of patients with each outcome listed after AP which was previously undiagnosed. Ideally we would have liked to report the cumulative incidence of prediabetes, DM and DM treated with insulin after AP, but given that regular universal screening for diabetes is uncommon and variable, we could not exclude pre-existing DM among those without history of diagnosed DM or prediabetes. We therefore chose to present data as prevalence of newly diagnosed DM over time since first attack of AP.
The ‘time course’ is defined at the prevalence of each outcome listed within certain time periods. This arbitrary includes ‘up to 12 months’, ‘12–36 month’, ‘36–60 months’ and ‘more than 60 months’.
The definition of DM has changed over the years, and this is reflected in the different definitions used in the studies included in this review. The first widely accepted classification of DM was published by National Diabetes Data Group (fasting ≥7.8 h or 2 h ≥11.1 mmol/L) in 1979, WHO (fasting ≥8.0 h or 2 h ≥11.0 mmol/L) in 198032 and, in modified form, in 198533 (fasting ≥7.8 h or 2 h ≥11.1), and the next major revision occurred in 1997 by American Diabetes Association (ADA), in 199934 by WHO, and again in 2003 by ADA. The major change in the 1999 classification was the lowering of the diagnostic threshold of the fasting plasma glucose concentration. According to the 1999 WHO classification, DM was defined as a FBG of ≥7.0 mmol L−1 (126 mg dL−1) or 2 h OGTT 2 h ≥11.1 mmol/L (200 mg/dL).
Studies were considered prospective if follow-up assessment was done prospectively. A binary classification was used to determine the severity of AP since the recent international multidisciplinary classification of AP severity, published by the Pancreatitis Across Nations Clinical Research and Education Alliance (PANCREA), was not used in the primary studies.35 ,36 This means that the study population was labelled as ‘severe’ if the studies reported on haemorrhagic AP, necrotising AP, or severe AP based on the Atlanta criteria. The remaining study populations were labelled as ‘mild’.
Data synthesis and statistical analysis
All the eligible studies were combined to give a pooled prevalence for each of the outcomes studied. If the papers reported groups of individuals with different mean follow-up times, the group with the longest follow-up was analysed for pooled prevalence. Data were pooled using a random-effects model37 to give the most conservative estimate. Stats Direct V.2.7.9 (StatsDirect, 2008) was used to generate forest plots of pooled prevalence with 95% CIs. Statistical heterogeneity between the studies was assessed using the I2 metric with cut-offs of 25, 50 and 75% to define low, moderate and high heterogeneity, respectively.38 Publication bias was assessed by applying the Horbold–Egger's test to funnel plots.39 Subgroup analysis was conducted according to mean follow-up time in the study, and they were grouped as follows: up to 12 months, between 12 and 36 months, between 36 and 60 months, more than 60 months. Sensitivity analyses constrained to studies that employed the 1999 WHO definition of DM,34 and to studies with severe AP, were conducted. Metaregression was used to investigate whether sex, age, duration of follow-up and aetiology of AP (proportion of biliary or alcohol AP) had a significant influence on the summary estimates. The R 2.15.2 framework with package metafor40 was used for metaregression analysis. Reporting of this study adhered to the Preferred Reporting Items for Systematic Reviews and Meta-Analyses (PRISMA) statement41 and the Meta-analysis of Observational Studies in Epidemiology (MOOSE) guidelines.42
Results
Study characteristics
The search criteria yielded 4823 citations of which 96 potentially relevant articles were retrieved and assessed for eligibility. There were 24 articles that fulfilled the eligibility criteria.23–27 43–61 A PRISMA flow diagram is presented in figure 1. The characteristics of included studies are presented in table 1. A total of 1102 patients with AP were evaluated in the included studies (table 2). There were three case-control studies that compared the study population to healthy volunteers.45 ,47 ,61 All but three studies57 ,59 ,61 were conducted in North America and Europe. Three studies were conducted in two hospitals,45 ,46 ,48 one study was conducted in three hospitals,55 and the rest were single-centre studies.
Characteristics of included studies
Baseline characteristics of individuals in included studies
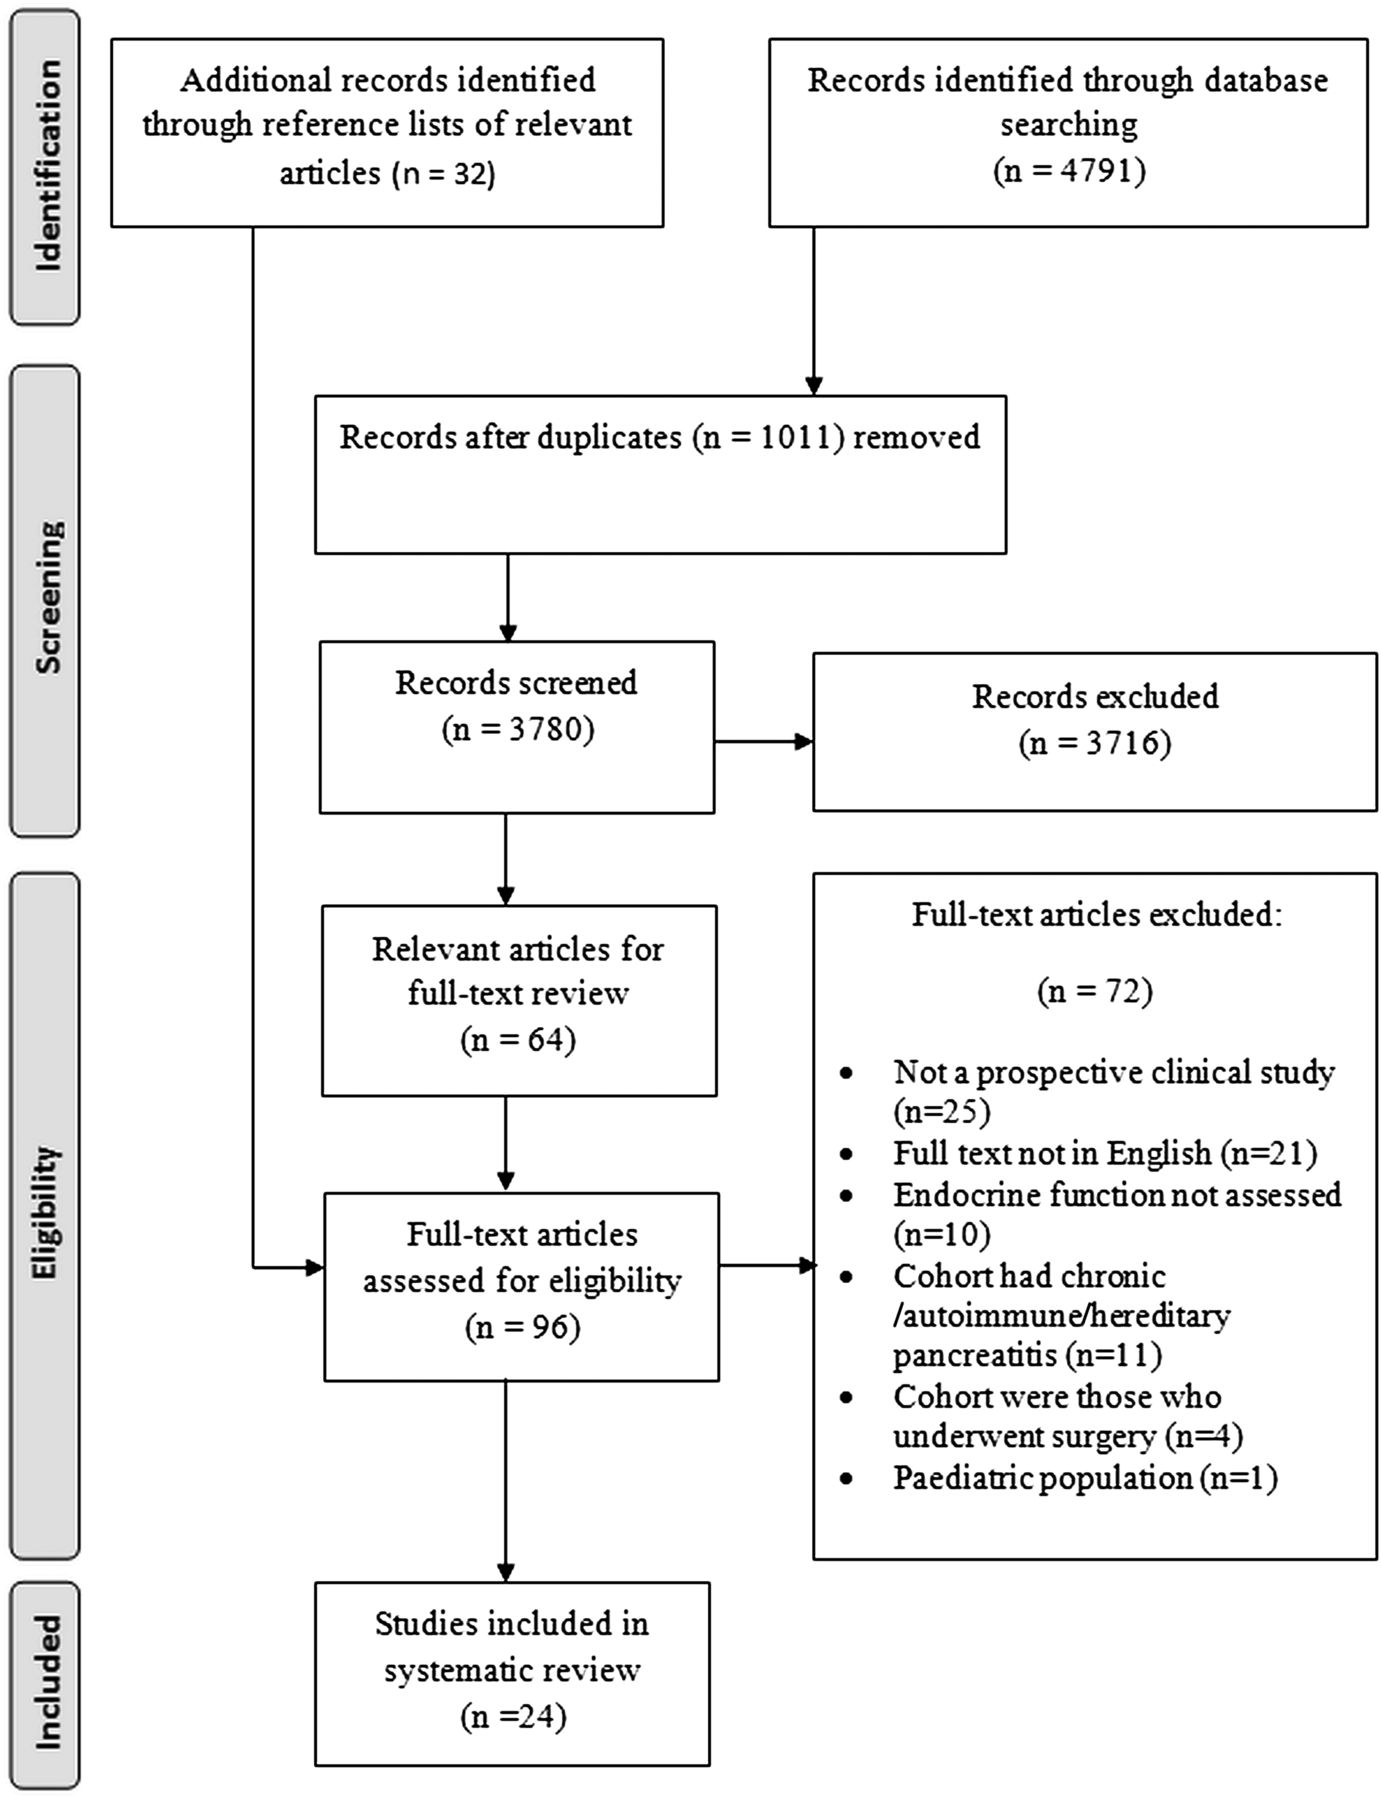
Flow-chart of study selection process.
Quality of studies
Methodological quality of the included studies is reported in table 3. The study quality was high in 18 (75%) studies. Most studies lacked points for comparability on the basis of design or analysis having not controlled for possible confounders (eg, severity and aetiology of AP). Other studies lacked points for selection due to a high dropout rate and inadequacy of follow-up.
Methodological quality of studies stratified by study design
Publication bias
Publication bias was examined and there was no evidence of funnel plot asymmetry for prediabetes and/or DM, prediabetes, DM and treatment with insulin with p values of 0.34, 0.75, 0.85 and 0.60, respectively.
Prediabetes and/or diabetes
A total of 15 studies were identified that reported on prediabetes and/or DM after AP.23 ,24 ,26 ,27 ,44–46 ,48 ,50 ,52 ,54 ,56 ,58 ,59 ,61 These studies included 628 patients. The pooled prevalence of hyperglycaemia was 37% (95% CI 30% to 45%), with moderate statistical heterogeneity between studies (I2=70%). Figure 2 demonstrates the time course of prediabetes and/or DM in the included studies.

Pooled prevalence of prediabetes and/or diabetes mellitus with time after the first attack of acute pancreatitis.
Prediabetes
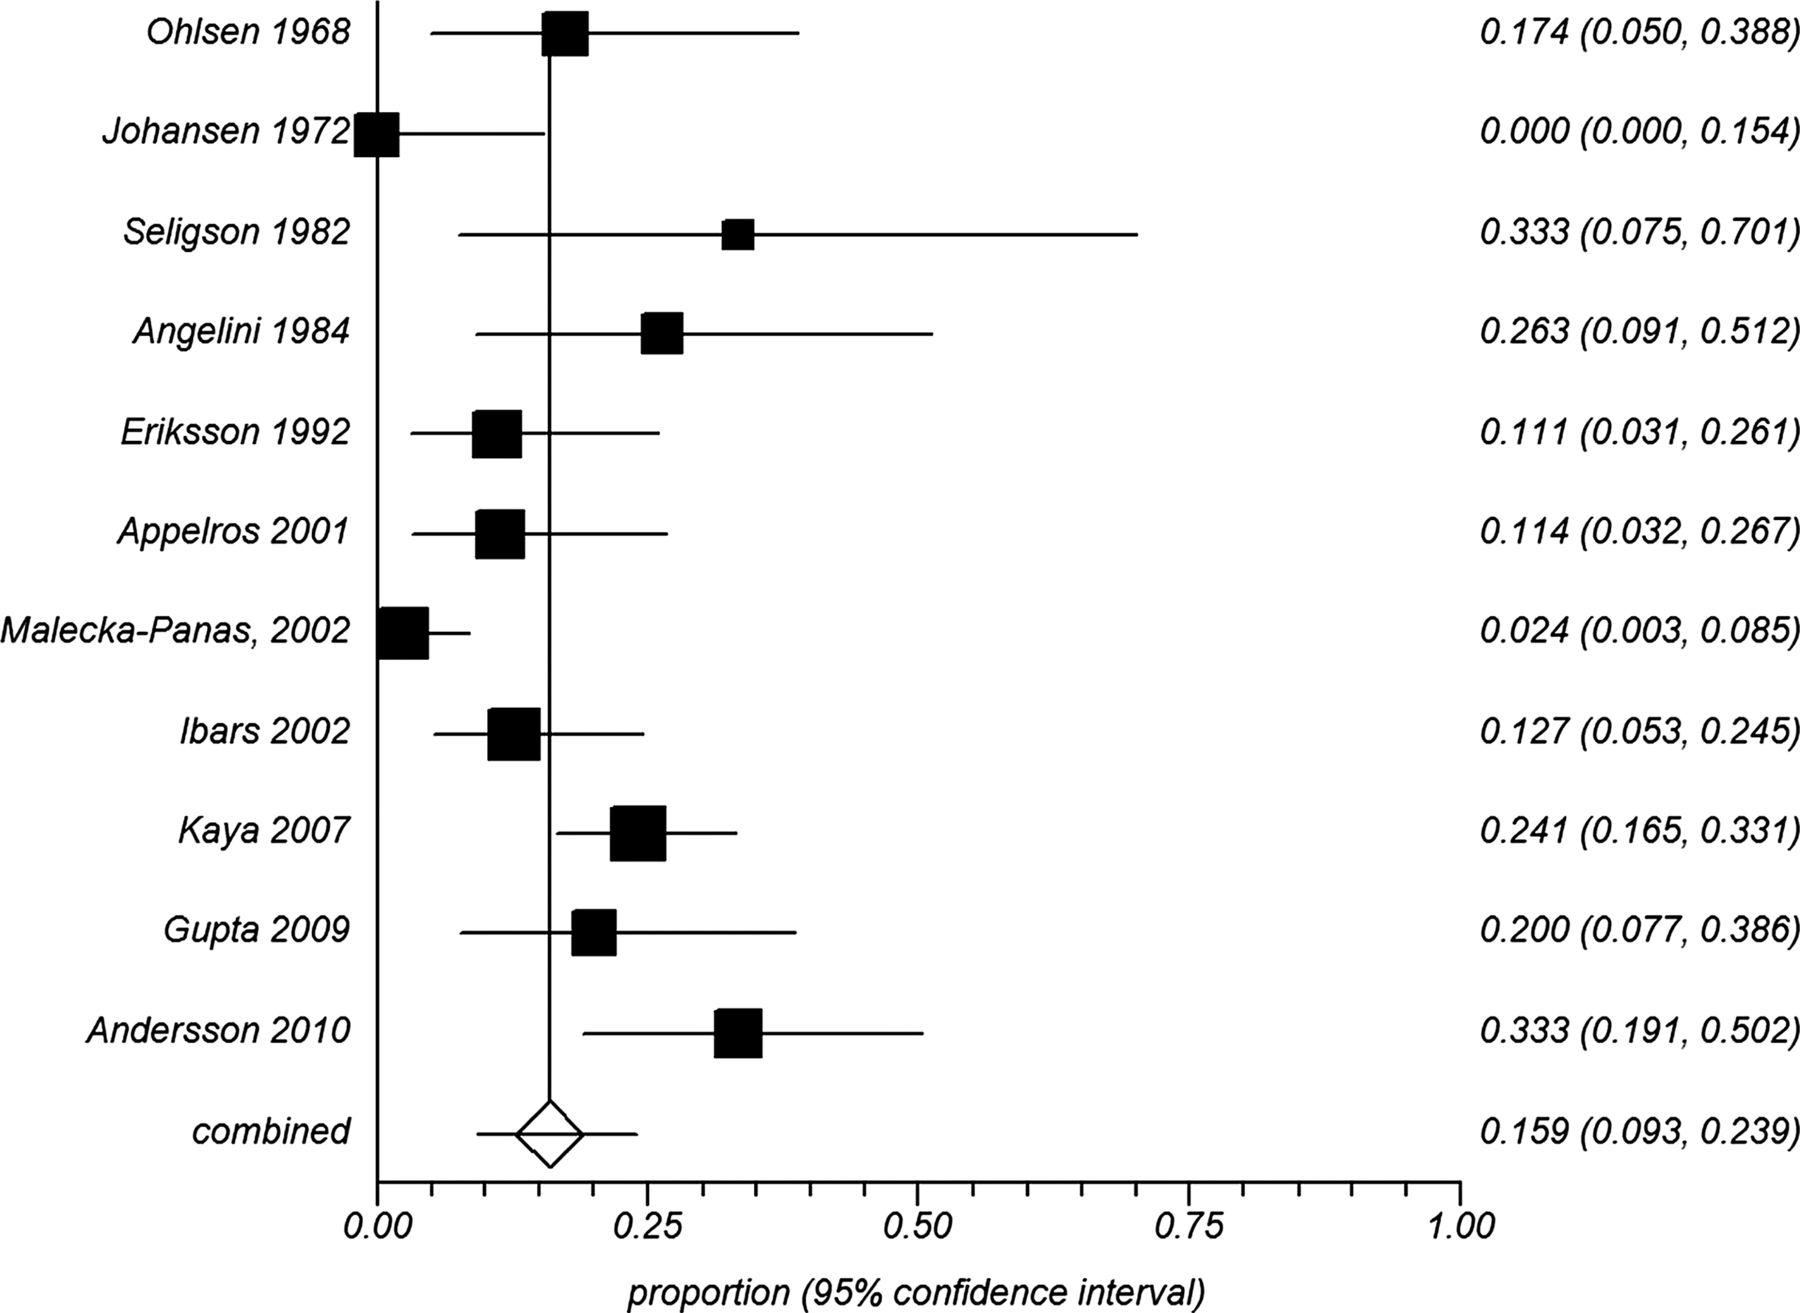
A total of 11 studies23 ,24 ,27 ,44–46 ,48 ,50 ,52 ,56 ,59 reported on newly diagnosed prediabetes after AP. This comprised a total of 462 patients with a pooled prevalence of 16% (95% CI 9% to 24%), in the presence of high statistical heterogeneity between studies (I2=78%) (figure 3). The reasons for high statistical heterogeneity have been explored in a number of prespecified sensitivity and subgroup analyses based on various clinical and methodological scenarios. Sensitivity analysis constrained to patients with severe AP included four studies44 ,48 ,50 ,59 involving 93 patients. The pooled prevalence of prediabetes was 20% (95% CI 13% to 29%), and heterogeneity between the studies decreased considerably (I2=9%). Sensitivity analysis constrained to studies that used the 1999 WHO definitions34 included three studies24 ,27 ,44 that comprised a total of 140 patients. This showed a pooled prevalence of 18% (95% CI 2% to 47%), and heterogeneity between the studies did not decrease (I2=92%). Subgroup analysis according to duration of follow-up is shown in table 4. Prevalence of prediabetes after AP stayed within the range 8–19% and the relative risk of developing prediabetes at any time point compared with up to 12 months initially decreases and then remains constant with time (table 4).
Subgroup analysis according to duration of follow-up

Pooled prevalence of prediabetes after the first attack of acute pancreatitis.
Diabetes mellitus
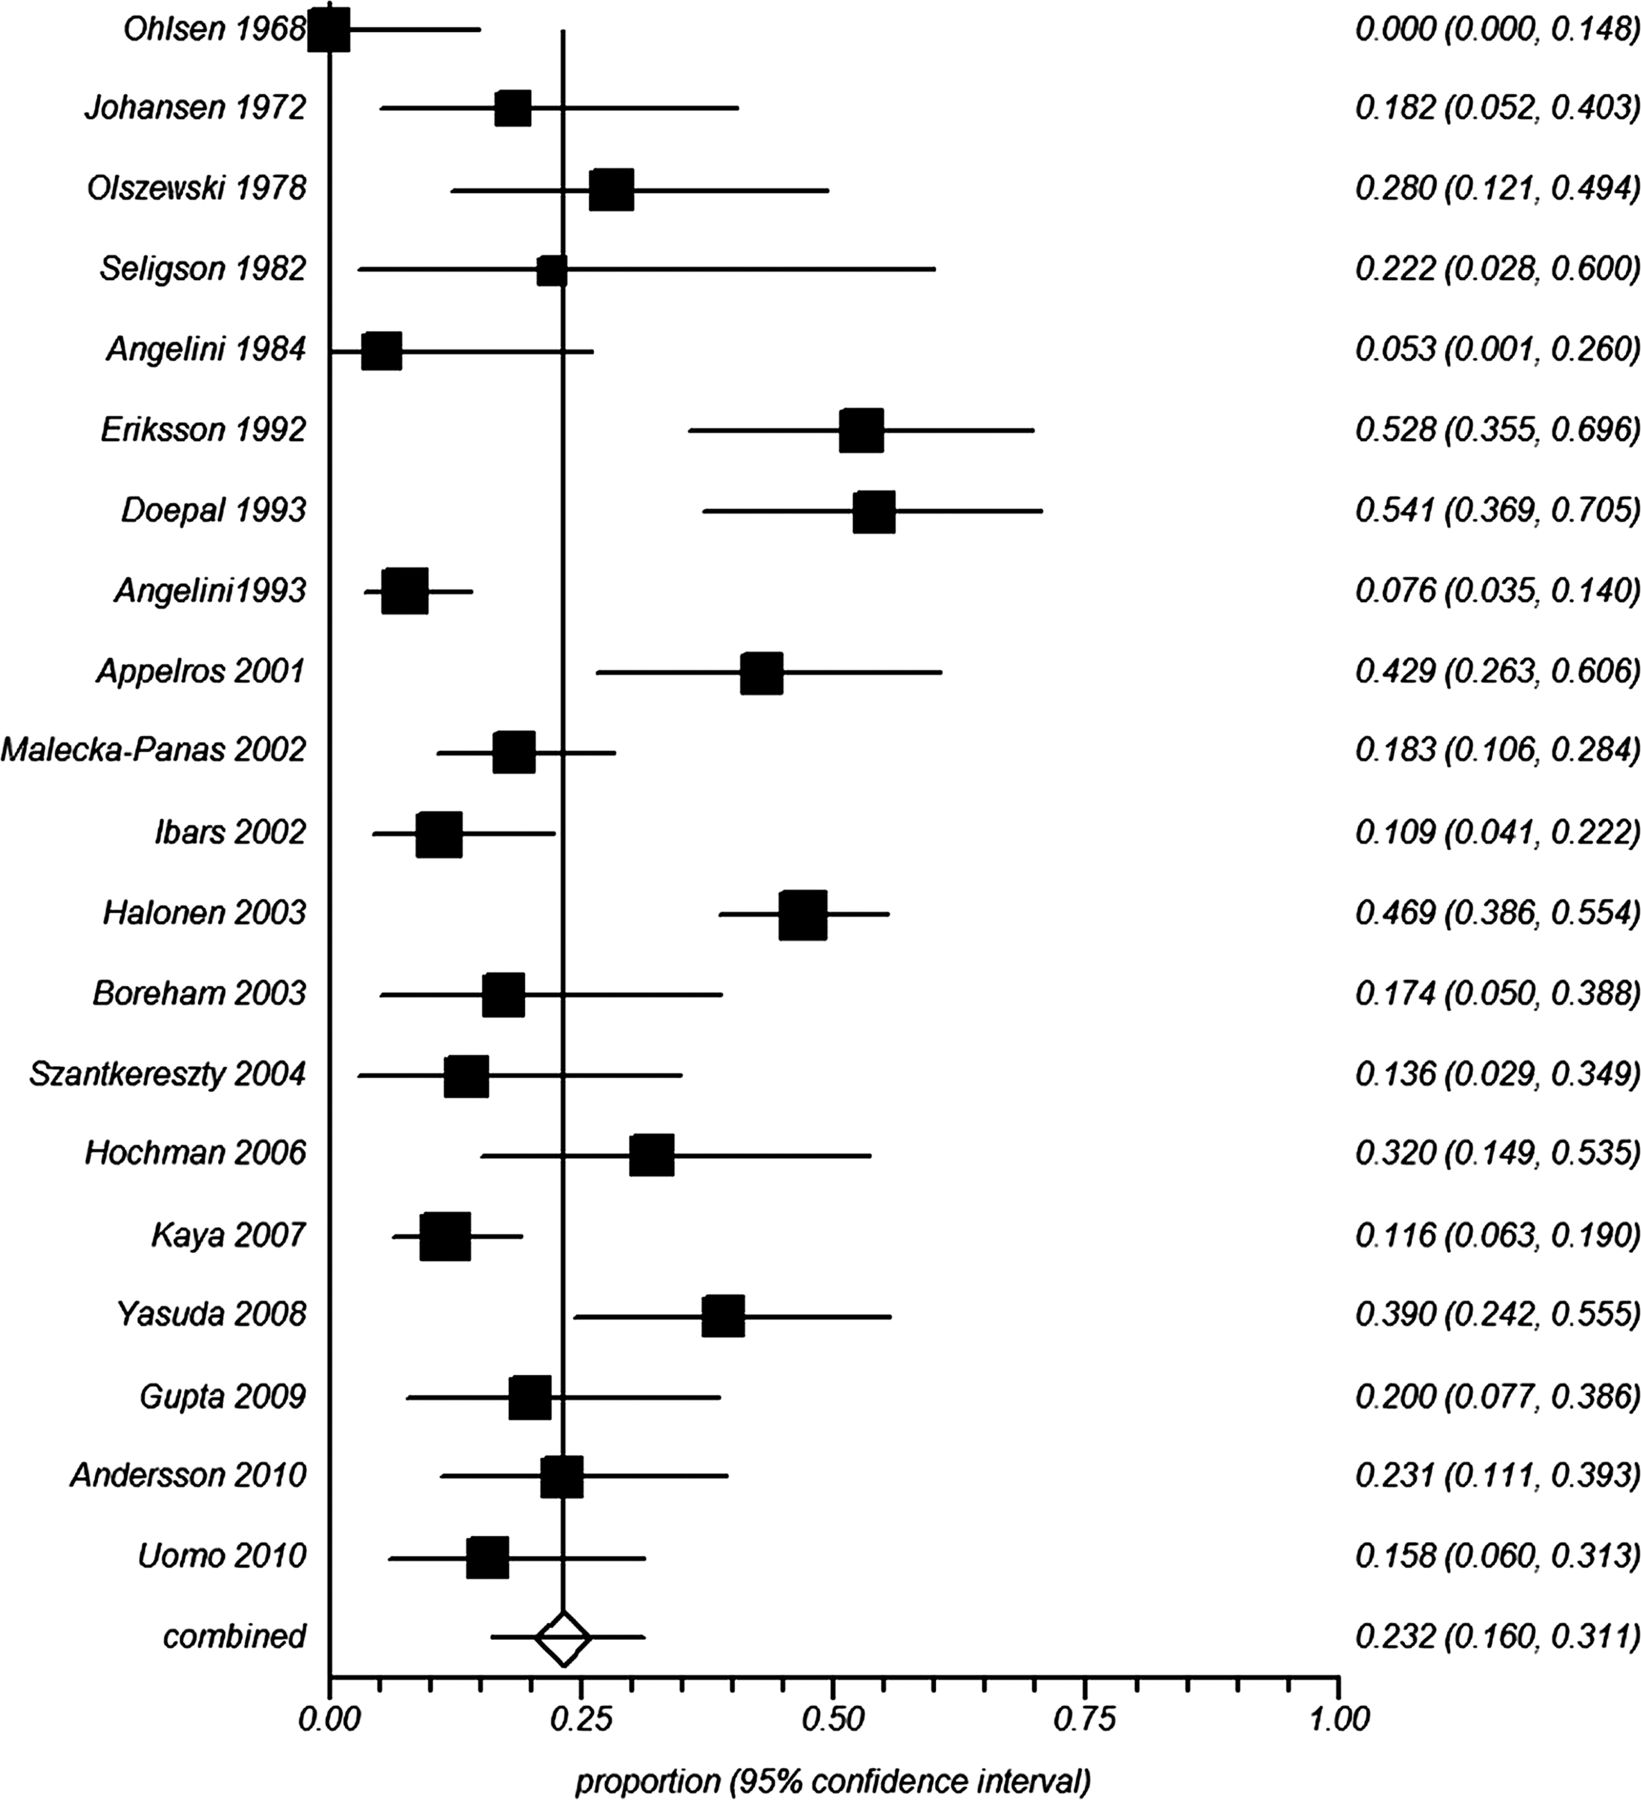
A total of 20 studies23–25 ,27 ,42–45 ,53 ,55–57 ,59 ,60 reported on newly diagnosed DM. This comprised a total of 936 patients with a pooled prevalence of diabetes of 23% (95% CI 16% to 31%), in the presence of high statistical heterogeneity between studies (I2=87%) (figure 4). The reasons for high statistical heterogeneity have been explored in a number of prespecified sensitivity and subgroup analyses based on various clinical and methodological scenarios. Sensitivity analysis constrained to patients with severe AP included 10 studies44 ,48–51 ,53 ,55 ,57 ,59 ,60 involving 428 patients. The pooled prevalence of DM in patients with severe AP was 30% (95% CI 20% to 41%), and heterogeneity between the studies remained high (I2=78%). Sensitivity analysis constrained to studies that used the 1999 WHO definitions34 included five studies24 ,25 ,27 ,44 ,57 that comprised a total of 188 patients. This showed a pooled prevalence of 21% (95% CI 12% to 31%), and heterogeneity between the studies decreased slightly (I2=62%). Subgroup analysis according to duration of follow-up is shown in table 4. Prevalence of DM after AP remained within the range 15–24% up to 60 months and then increased to 40% in the subgroup with follow-up of more than 60 months. There was a statistically significant 2.7-fold increased risk of newly diagnosed DM at 60 months or more in comparison with that at 12 months and below (table 4).

Pooled prevalence of diabetes mellitus after the first attack of acute pancreatitis.
Insulin-treated DM
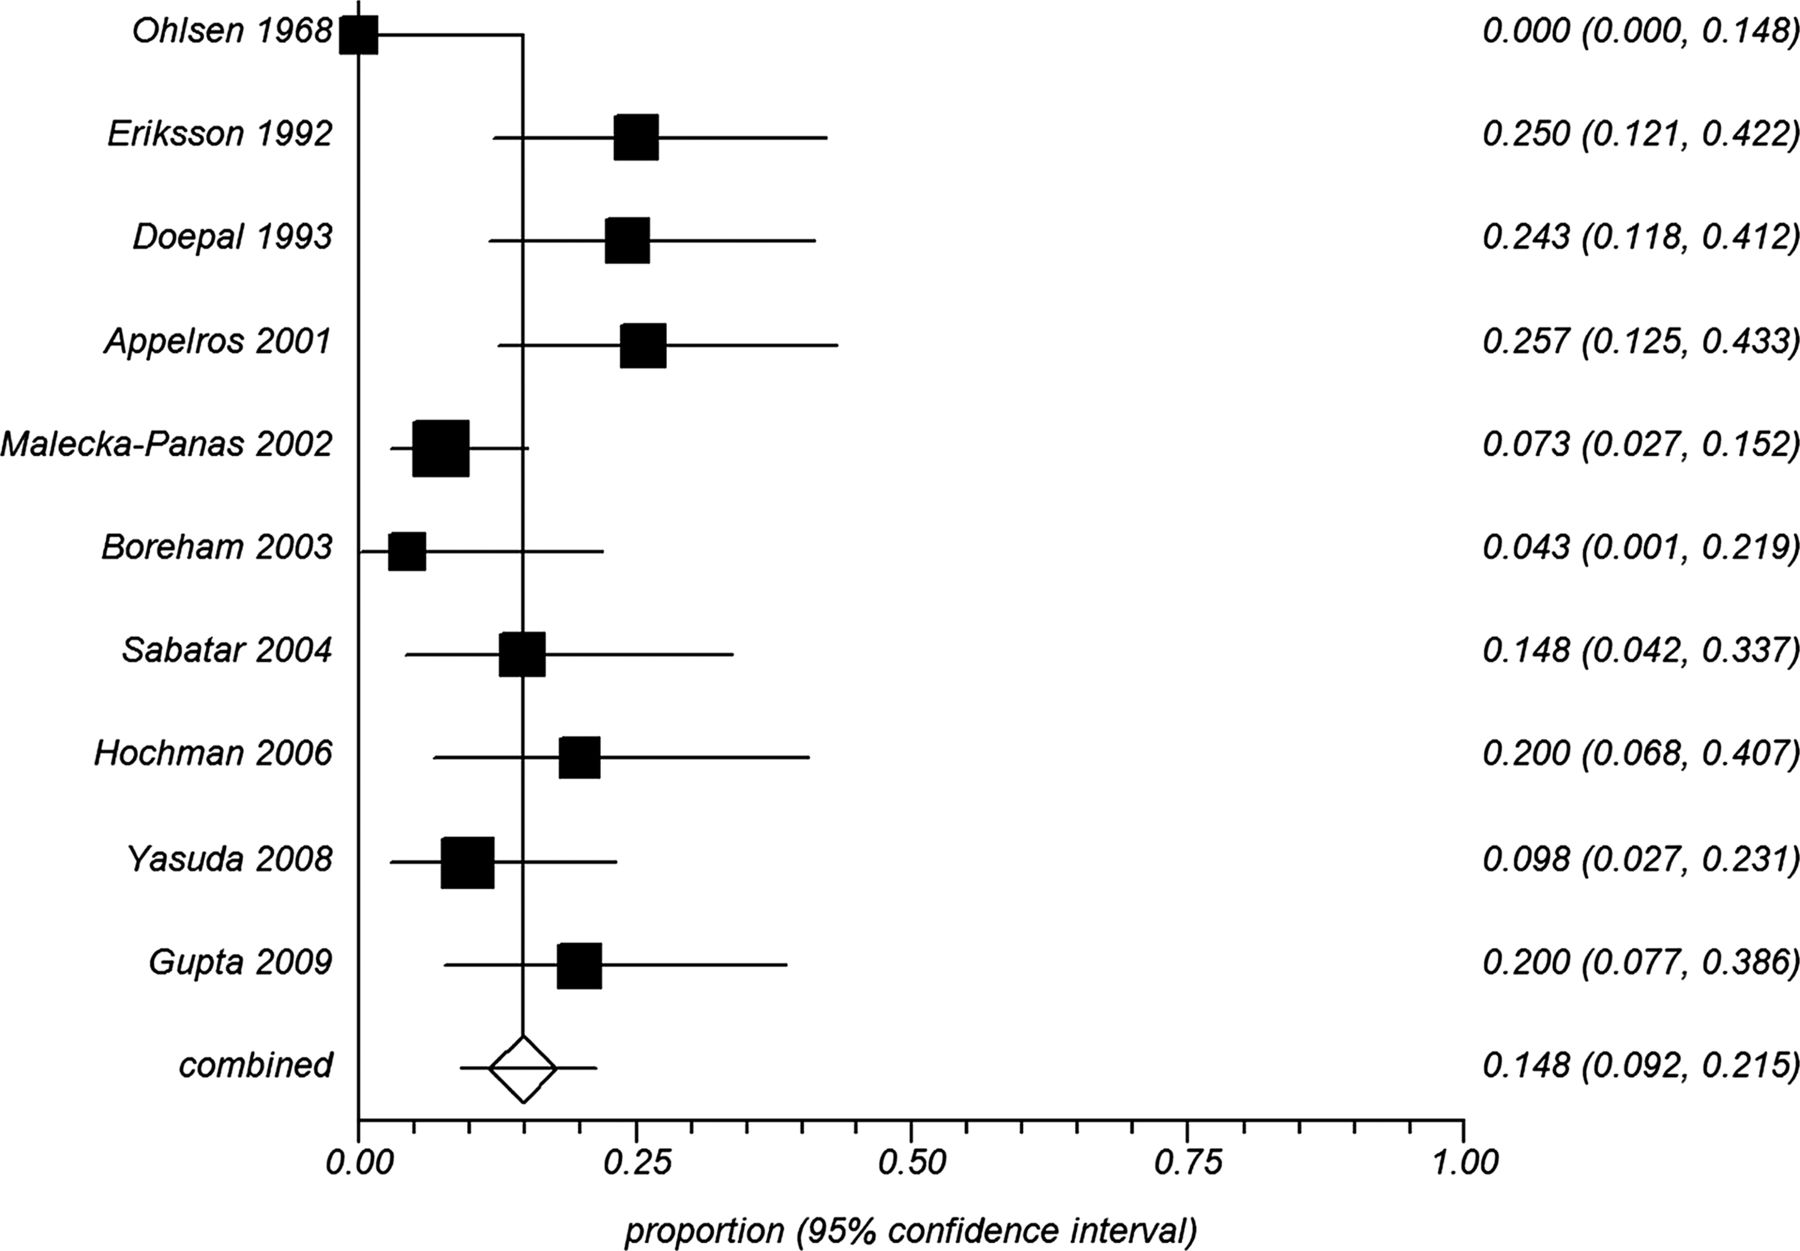
There were a total of 10 studies24 ,25 ,45 ,49 ,50 ,52 ,54–56 ,59 that reported on treatment with insulin after the first attack of AP. This comprised a total of 359 patients with a pooled prevalence of insulin-treated DM of 15% (95% CI 9% to 21%) (figure 5). There was moderate statistical heterogeneity between studies (I2=64%). The reasons for this statistical heterogeneity have been explored in a number of prespecified sensitivity and subgroup analyses based on various clinical and methodological scenarios. Sensitivity analysis constrained to patients with severe AP included seven studies.24 ,25 ,50 ,54 ,55 ,57 ,59 This showed a pooled prevalence of 14% (95% CI 9% to 21%), and heterogeneity between the studies decreased moderately (I2=45%). Sensitivity analysis constrained to studies that used the 1999 WHO definitions34 included four studies24 ,25 ,54 ,57 comprising 173 patients with a pooled prevalence of 9% (95% CI 6% to 14%), and heterogeneity between the studies eliminated (I2=0%). Subgroup analysis, according to duration of follow-up, is shown in table 4. Prevalence of the treatment with insulin increased from 11% within 12 months to 25% after 60 months. There was more than twofold increased risk of this outcome at 60 months or more in comparison with that at 12 months and below (table 4).

Pooled prevalence of diabetes mellitus treated with insulin after the first attack of acute pancreatitis.
Meta-regression analysis
Meta-regression was conducted using the following moderators: proportion of male patients, mean age of subjects, duration of follow-up, proportion of patients with biliary aetiology and proportion of patients with alcohol aetiology. The analysis showed that the prevalences of prediabetes and/or DM, prediabetes, DM and treatment with insulin were not significantly influenced by the covariates tested (table 5).
Results of meta-regression analysis
Discussion
This is the first study to systematically review all available evidence on burden of newly diagnosed hyperglycaemia in general, and DM in particular, among patients after the first episode of AP. Prediabetes and/or DM was observed in nearly 40% patients after AP and DM occurred in nearly 25% of patients after AP, 70% of whom required permanent insulin therapy. Further, the severity of AP appeared to have little effect on either prediabetes or DM after AP. Patients after severe AP had only a marginally higher prevalence of both prediabetes (20%) and DM (30%). The meta-regression analysis also showed that the risk of prediabetes or DM after AP is independent of the aetiology, as well as age and gender. This systematic review has also demonstrated that both prediabetes and DM are highly prevalent very early after AP. The prevalence of prediabetes and DM within 12 months of first episode of AP was 19% and 15%, respectively. Unfortunately, there is only one study44 that followed patients with prediabetes who had AP to determine whether they developed DM, but the diabetes literature suggests that patients with prediabetes are more likely to develop DM.10 ,11
AP is an acknowledged cause of DM, and this has recently been classified as type 3c diabetes.62 ,63 While the loss of pancreatic β cells due to necrosis (with or without surgery) is considered to be the main cause of DM after AP, more than 70% of patients had none or less than 30% necrosis, and 78% of patients were managed conservatively. Furthermore, there appeared to be no effect of disease severity on the risk of developing DM. This suggests that DM may develop after AP due to mechanisms other than necrosis. Glutamic acid decarboxylase and insulinoma antigen 2 (IA2) antibodies have been found in patients with latent autoimmune DM64 and type 1 DM.65 It is possible that AP triggers a response in genetically susceptible individuals already at risk of developing DM.66 Further, it was recently suggested that certain metabolic factors, such as obesity and hypertriglyceridaemia, place individuals at higher risk for developing AP, termed ‘metabolic AP’,67 and these factors might also place individuals at greater risk of developing DM after AP.68–70 Since there was no data available on metabolic parameters before first attack of AP, the question of pre-existing autoantibodies, structural or functional changes predisposing individuals to developing hyperglycaemia and DM after AP remain to be answered by future studies. It is also worth mentioning that pre-existing DM itself is considered as a risk factor for AP,71 ,72 which underscores the complex basis for the metabolic changes associated with AP.
When analysing the disease trend with time, it appears that prevalence of prediabetes and diabetes in general and DM in particular increased markedly with time. It is recognised that prevalence of DM increases exponentially after 45 years of age73 ,74 and the effect of aging on β cell function and increased adiposity-related insulin resistance may be a partial explanation for this trend, however, the metaregression analysis showed that age was not a significant covariate among those who had AP. Another possible mechanism is that some individuals may have had further attacks of AP before being followed-up after 5 years. This has been reported in some studies24 ,42 ,48 ,50 ,51 ,52 ,53 ,57–59 but not accounted for in most of the included papers. This means that the effect of repeated attacks of AP on the risk of prediabetes and DM may contribute to the increased prevalence with duration of follow-up. The risk of DM has been reported to be as high as 80% in patients with chronic pancreatitis (CP)75–77 and it cannot be ruled out that some of the patients with follow-up greater than 5 years (median follow-up in this group was 74.4 months) had, in fact, developed CP, and hence, had a higher prevalence of DM. Given insufficient data, we were unable to account for this. However, taking into account that the risk of developing CP after first attack of AP is low (6–15%) and that it has been shown to occur in predominantly alcoholic pancreatitis, and mainly with progression occurring after 10 years,78–80 it is unlikely that many individuals in our pooled cohort progressed to CP.
The strengths of this systematic review are the comprehensive strategy that allowed the pooling of over a thousand individuals with a first attack of AP, the assessment of blood glucose control after hospital discharge from prospective studies, many of high quality, and exclusion of those who had pancreatic surgery. Further, studies of patients with pre-existing DM were also excluded from this study, allowing the reporting of newly diagnosed prediabetes and DM after AP. The analytical approach was robust with the use of the random-effects model to pool the data (in order to provide the most conservative estimates), and this resulted in narrow CIs for pooled proportions of all outcomes. A series of prespecified sensitivity and subgroup analyses (in order to investigate possible clinical and methodological grounds for statistical heterogeneity), and metaregression (in order to study the effect of several potential confounders) were also performed.
The study has several limitations and they need to be acknowledged. First, there was statistical heterogeneity in relation to some of the endpoints. However, after an in-depth investigation of clinical and methodological features of individual studies, the inferences remain unchanged. There was no statistical heterogeneity in terms of proportion of patients with prediabetes and/or DM when analysing only cohorts with severe AP and, similarly, none in the subgroup analysis of follow-up greater than 5 years. Sensitivity analysis constrained to studies that employed the 1999 WHO definition of DM34 also yielded no statistical heterogeneity between the included studies (data not shown). Despite the difference in definitions for prediabetes and DM used by the authors, the results did not change when the most current and stringent diagnostic criteria for DM were used. The statistical heterogeneity observed in other analyses may have occurred because of geographical differences in populations under study, and the combination of different study designs. Another possible explanation for the statistical heterogeneity was the range of methods of endocrine assessment but this likely resulted in more conservative estimates. Future studies will need to use standardised methods of FBG testing and OGTT81 to facilitate comparison of data between studies.
Second, although primary studies used some form of glucose tolerance test to diagnose prediabetes and DM, glucose tolerance per se is not the only indicator of pancreatic endocrine function. There are other methods of pancreatic endocrine function, including measurements of insulin resistance, insulin secretion, insulin sensitivity, glucagon secretion and sensitivity that were not investigated in the primary studies. This can partly be explained by the difficulty in testing and interpreting these aspects of pancreatic endocrine function as, for example, blood insulin, proinsulin and C-peptide levels alone do not represent the true endocrine reserve of the pancreas due to effects of extra pancreatic (hepatic) variables.82 ,83 As the adverse effects of DM are mainly attributed to the effects of hyperglycaemia,2–6 it appears justifiable to focus on measurements of blood glucose as a proxy for pancreatic endocrine function.
Third, not all papers commented on or accounted for obesity and/or family history of DM in the populations tested. It is known that obesity in itself is an important risk factor for hyperglycaemia and insulin resistance.84–88 A study by Mentula et al89 also demonstrated that obesity may contribute to early hyperglycaemia in patients with AP. Hence, it is possible that the different proportions of obese patients in the included populations might lead to differences in overall proportions of hyperglycaemia after onset of AP. Unfortunately, only four out of 24 (17%) included studies presented data on BMI and, thus, we were not able to account for this factor (table 2). Similarly, only three out of 24 (12.5%) of the included studies considered family history of DM as a confounder and, thus, we could not account for this as a potential confounder.
Fourth, only four out of 24 primary studies reported on the prevalence of DM and related conditions in patients with mild and severe AP separately. Hence, we were unable to perform a subgroup analysis based on severity of AP. However, it is worth noting that several included studies23 ,26 ,56 ,58 ,60 found no statistically significant association between prevalence of diabetes and AP severity. At the same time, quite a few studies enrolled patients with severe AP only. We were hence able to do a sensitivity analysis constrained to studies that reported on severe AP only. It is also acknowledged that it was beyond the scope of the primary studies to investigate the risk of DM and related conditions in patients that didn't survive the acute attack of AP, and our study could not account for non-survivors that might have developed DM and related conditions. This, however, suggests that the summary estimates in our study are likely to be conservative.
Fifth, not all primary studies commented on the number of AP attacks. Only nine studies described multiple attacks of AP, with two studies concluding that the number of attacks of AP had no effect on blood glucose control, and seven studies not mentioning any effect. Hence, the effect of repeated attacks on risk of developing prediabetes and DM is unclear and it also remains unknown whether repeated attacks of AP can contribute to a loss of pancreatic β cells acting as a possible mechanism for the development of DM and related conditions.
Sixth, the prevalence ratio of DM in patients after an attack of AP in comparison with healthy individuals was 2.4 (95% CI 0.5 to 12.1). However, it was based on one study45 only. Without matched controls from the majority of primary studies, enhanced glucose testing bias could not be disproved as the reason for the high prevalence of DM in the pooled cohort. As an estimate, based on the 2012 data from the International Diabetes Federation,90 the prevalence of DM in the general population of the 14 countries that were included in our study varied from 4% to 9%. This is markedly lower than the pooled 23% prevalence of DM after AP that was observed in our study in which patients with pre-existing DM were not included, thereby magnifying the actual difference in prevalence of DM among those with and without previous AP. It might be argued that first, the statistics mentioned above was for age range 20–79. However, the median age for our entire studied population was 51.5 years which is well within the range (20–79), and only four of the 24 studies had a maximum age of subjects older than 79. Second, the rise in the prevalence of DM in the general population over recent years might have influenced the pooled estimate. This does not appear to be the case because the regression analysis, based on initial year of study, revealed that the prevalence of DM is not related to the year (data not shown). It would therefore appear that, even with the conservative assumptions, the prevalence of DM in patients after the first attack of AP is markedly higher than in the general population.
Last, by omitting non-English studies, language bias cannot be ruled out. However, excluding studies published in languages other than English has generally little effect on the summary estimates and, if any, English papers tend to have more conservative estimates and also tend to have higher methodological quality.91 It is also worth mentioning that 22 out of 24 (92%) primary studies have come from countries where English is not the official language, and the distribution of counties has been similar in the included and excluded studies. Hence, there is no reason to suggest a significant geographical bias in our meta-analysis.
In conclusion, this comprehensive systematic review indicates that patients with AP have a nearly 40% prevalence of newly-diagnosed prediabetes or DM after discharge from hospital, and the risk of DM doubles over 5 years. Therefore, a formal follow-up of patients after AP may be more important than has been appreciated. Further studies are warranted to determine the optimal strategy for hyperglycaemia detection, screening, and whether the risk of developing DM after AP can be reduced.
Acknowledgments
The authors are indebted to Professor David M Nathan (Massachusetts General Hospital Diabetes Center and Clinical Research Center, Harvard Medical School, Boston, USA) for critical review of the earlier version of the manuscript. The authors would also like to thank Dr Bodil Andersson (Sweden), Dr Stefan Appelross (Sweden), Dr Rajesh Gupta (India), Professor Ewa Malecka-Panas (Poland) and Dr Juhani Sand (Finland) for providing additional information on their studies, and Ms Irene SL Zeng (University of Auckland, Auckland, New Zealand) for her help with some statistical analysis.
References
Footnotes
-
Contributors SLMD had full access to all the data in the study, and takes responsibility for the integrity of the data and the accuracy of the data analysis. Guarantor: MSP. Study concept and design: MSP. Acquisition of data: SLMD and PPS. Analysis and interpretation of data: SLMD, PPS and RM. Drafting of the manuscript: SLMD. Critical revision of the manuscript for important intellectual content: PPS, RM, ARJP JAW and MSP. Statistical analysis: SLMD. Study supervision: MSP.
-
Competing interests None.
-
Provenance and peer review Not commissioned; externally peer reviewed.