Article Text

Abstract
Objective To determine whether neighbourhood walkability is associated with clinical measures of obesity, hypertension, diabetes and dyslipidaemia in an urban adult population.
Design Observational cross-sectional study.
Setting Urban primary care patients.
Participants 78 023 Toronto residents, aged 18 years and over, who were formally rostered or had at least 2 visits between 2012 and 2014 with a primary care physician participating in the University of Toronto Practice Based Research Network (UTOPIAN), within the Canadian Primary Care Sentinel Surveillance Network (CPCSSN).
Main outcome measures Differences in average body mass index (BMI), systolic and diastolic blood pressure, fasting blood glucose, haemoglobin A1c (HbA1C), total cholesterol, high-density lipoprotein (HDL), low-density lipoprotein and triglyceride between residents in the highest versus the lowest quartile of neighbourhood walkability, as estimated using multivariable linear regression models and stratified by age. Outcomes were objectively measured and were retrieved from primary care electronic medical records. Models adjusted for age, sex, smoking, medications, medical comorbidities and indices of neighbourhood safety and marginalisation.
Results Compared with those in the lowest walkability quartile, individuals in the highest quartile had lower mean BMI (−2.64 kg/m2, 95% CI −2.98 to −2.30; p<0.001), systolic blood pressure (−1.35 mm Hg, 95% CI −2.01 to −0.70; p<0.001), diastolic blood pressure (−0.60 mm Hg, 95% CI 1.06 to −0.14; p=0.010) and HbA1c (−0.063%, 95% CI −0.11 to −0.021; p=0.003) and higher mean HDL (0.052 mmol/L, 95% CI 0.029 to 0.075; p<0.001). In age-stratified analyses, differences in the mean BMI were consistently observed for adults aged 18 to under 40 (−4.44 kg/m2, 95% CI −5.09 to −3.79; p<0.001), adults aged 40–65 (−2.74 kg/m2, 95% CI −3.24 to −2.23; p<0.001) and adults aged over 65 (−0.87 kg/m2, 95% CI −1.48 to −0.26; p=0.005).
Conclusions There was a clinically meaningful association between living in the most walkable neighbourhoods and having lower BMI in adults of all ages.
- built environment
- active transportation
- obesity
- neighbourhood walkability
- utilitarian walking
- metabolic risk
This is an Open Access article distributed in accordance with the Creative Commons Attribution Non Commercial (CC BY-NC 4.0) license, which permits others to distribute, remix, adapt, build upon this work non-commercially, and license their derivative works on different terms, provided the original work is properly cited and the use is non-commercial. See: http://creativecommons.org/licenses/by-nc/4.0/
Statistics from Altmetric.com
- built environment
- active transportation
- obesity
- neighbourhood walkability
- utilitarian walking
- metabolic risk
Strengths and limitations of this study
This neighbourhood walkability study is unique in examining a set of objectively measured metabolic risk factors, all of which are known to change with physical activity.
We used electronic medical record data, which allowed us to control for patient-level covariates and express results in a clinically meaningful way.
It was not possible to control for diet or the food environment with our study data.
The cross-sectional study design could not rule out a residential selection effect in which individuals with healthier lifestyles may choose to reside in more walkable neighbourhoods.
Introduction
Increasing physical activity can significantly impact disability-adjusted life years in developed countries. This is because many of the top risk factors associated with excess morbidity and mortality—high body mass index (BMI), high blood pressure, high glycaemic levels and high cholesterol—are all impacted by exercise.1 Clinical practice guidelines consistently recommend physical activity, as part of a healthy lifestyle2–4 and as non-pharmacological therapy for overweight and obesity,5–8 hypertension,9–11 diabetes12–14 and dyslipidaemia.15–17
At the population level, public health professionals have advocated for the use of built environment designs that support or promote active transportation such as utilitarian walking or cycling.18 ,19 Utilitarian walking describes non-recreational walking that is used as a mode of transportation, commonly in the course of conducting errands, or travelling to and from school or work.20 ,21 By recognising neighbourhood design as a way to influence health behaviours and ‘build in’ physical activity into daily living, this population health approach advances health promotion to sectors beyond healthcare, towards the creation of public policies and environments that support health.22
Multiple scales have been developed and validated to measure aspects of a neighbourhood's built environment that promote pedestrian walking.23 ,24 Characteristics such as residential density, intersection density and public transport density have been shown to influence walkability and physical activity.25 Current evidence suggests that greater neighbourhood walkability is associated with increased physical activity, through walking for transport or utilitarian walking.26–31 Studies using survey or administrative data have found associations between areas of higher walkability and population-level health outcomes such as lower prevalence and incidence of obesity and diabetes,30 ,32–34 and lower incidence of hypertension.35 However, there is limited information on objectively measured metabolic risk factors which are known to change with physical activity.
This study examined the association between relative residential neighbourhood walkability and objectively measured metabolic risk factors in an urban adult population.
Methods
This study used an observational cross-sectional design and linked routinely collected electronic medical record (EMR) data with neighbourhood-level characteristics.
Study population
The study population included patients, aged 18 and above, seen by a primary care physician participating in the University of Toronto Practice Based Research Network (UTOPIAN). UTOPIAN is 1 of 11 Primary Care Practice Based Research Networks that are part of the Canadian Primary Care Sentinel Surveillance Network (CPCSSN). CPCSSN is a multidisease surveillance system where primary care physicians contribute deidentified EMR data to a national database.36 In Canada, universal access to primary care services is publicly funded, and in the province of Ontario, where Toronto is situated, 94% of residents have a primary care provider.37 Patients who were enrolled with, or who had at least two visits with a CPCSSN-UTOPIAN primary care physician between 1 January 2012 and 31 December 2014 and who had a valid City of Toronto residential postal code were included in this study. Data were extracted as of 31 December 2014 using procedures previously described.36
Measure of neighbourhood walkability
The walkability of each individual's residential neighbourhood was measured using Walk Score, a validated index that calculates the walkability of an address based on distance to amenities and aspects of pedestrian friendliness, including population density, block length and intersection density.38 Increasing Walk Score has been linked to increased utilitarian walking and decreased obesity prevalence in Ontario, Canada.29 In this walkability index, locations are scored from 0 to 100, where 100 is the most walkable.38 Toronto has 140 neighbourhoods, each of which is an administrative area that covers several city blocks, and has a minimum population of 7000–10 000.39 Neighbourhood-level Walk Scores for all Toronto neighbourhoods are publicly available online40 and represent a population-weighted aggregation of a grid of Walk Score points for the entire area of a neighbourhood, as delineated by administrative boundaries.38 The Walk Scores current as of 2014 were retrieved.40 Based on their residential postal code, participants were assigned to a Toronto neighbourhood using Toronto neighbourhood and postal code area shapefiles41–43 with ESRI ArcGIS ArcMap V.10.1.
Health outcome measures
The health outcome measures in this study were BMI, systolic and diastolic blood pressure (sBP, dBP), fasting blood glucose (FBG), haemoglobin A1c (HbA1c), total cholesterol (TC), high-density lipoprotein (HDL), low-density lipoprotein (LDL) and triglyceride (TG). These measures were selected because they represent widely accepted indicators of obesity, hypertension, glycaemic control and dyslipidaemia, for which target ranges are well established in clinical practice guidelines.5–17 If multiple values were present between 2012 and 2014, the most recent record was used for data analysis. Given that the study sample was derived from a primary care patient population, the collection of these health measures represented the full spectrum of clinical testing: screening of healthy and at-risk individuals, diagnosis of individuals and monitoring of individuals with chronic conditions for disease control and therapy optimisation.
Covariates
Individual and neighbourhood-level covariates were measured. Individual health and sociodemographic characteristics obtained from CPCSSN-UTOPIAN data included key variables that can influence the clinical outcome measures of interest: patient age, sex, current smoking status, presence of a diagnosis of hypertension or diabetes and presence of a prescription for a weight-loss medication, an antihypertensive medication, an antidiabetic medication or a lipid-lowering medication. Diagnoses of hypertension and diabetes were based on validated CPCSSN case definitions and case-finding algorithms.44
Neighbourhood rates of violent crime reported to the Toronto Police Service (ie, assault, sexual assault, robbery and murder) were used as an indicator of neighbourhood safety,45 given the possibility that neighbourhood crime and perception of safety may influence utilitarian walking.21 Owing to the link between marginalisation and health, the Ontario Marginalization Index scores of Toronto neighbourhoods were also included as covariates.46 ,47 This index uses census data and assigns scores across four specific dimensions that contribute to the process of marginalisation. Material deprivation scores incorporated measures of unemployment, low income, low education and low-quality housing. Ethnic concentration scores accounted for recent immigration and self-identification as a visible minority. Residential instability scores were derived from multiple indicators, including the proportion of the population who had moved in the previous 5 years, and the proportion of dwellings that were not owned. Dependency scores included indicators measuring the proportion of the population aged 65 and older and the proportion of the population not participating in the labour force.46 ,47
Statistical analyses
Descriptive statistics were calculated for demographic variables, health outcome measures and all covariates. Toronto neighbourhood walkability was visualised with a choropleth map. Means and 95% CIs of all health measures were calculated for the highest and lowest neighbourhood walkability quartiles and significance testing was performed on the unadjusted means using t-tests assuming equal variances. Multivariable linear regression models were also used to compare the mean health measures in the highest versus the lowest walkability quartile. All models were adjusted for covariates of age, sex, smoking status, neighbourhood rates of violent crime and neighbourhood indices of material deprivation, ethnic concentration, residential instability and dependency from the Ontario Marginalization Index. Models predicting BMI were also adjusted for the presence of a weight-loss medication. Models predicting blood pressure were adjusted for BMI, the presence of a hypertension diagnosis and prescription of antihypertensive medication. Models predicting HbA1c and FBG were adjusted for BMI, the presence of a diabetes diagnosis and prescription of antidiabetic medication. Models predicting cholesterol (TC, HDL, LDL, TG) were adjusted for BMI and the presence of a prescription for lipid-lowering medication. There were insufficient observations within each neighbourhood to use multilevel models. However, to ensure that the use of non-hierarchical linear regression was appropriate, intraclass correlation coefficients (ICCs) were calculated. Low ICCs for each health outcome (ICC=0.050 for BMI, ICC<0.01 for all other outcomes) revealed that very little of the total variance was accounted for by clustering within neighbourhoods, and that a non-hierarchical approach was reasonable.
Differences in health measures across walkability quartiles were examined for all ages, and in stratified analyses across three age subgroups of 18 to under 40 years, 40–65 years and over 65 years. Broadly, these age categories represent segments of the population where primary versus secondary prevention strategies may be relevant in distinct ways. A younger adult population is more amenable to primary prevention of chronic disease. The primary and secondary prevention are relevant for middle-aged adults, and notably, they undergo lipid and diabetes screening as recommended by clinical practice guidelines.15 ,48 Finally, older adults may differ from younger adults due to increased medical comorbidities that affect the health markers of interest, and due to potentially decreased mobility that may affect levels of walking and physical activity.
All data were analysed using Stata IC/V.12.1 and mapping was carried out using ESRI ArcGIS ArcMap V.10.1.
Results
A total of 78 023 UTOPIAN patients met the inclusion criteria. The generation of the study sample is displayed in figure 1.
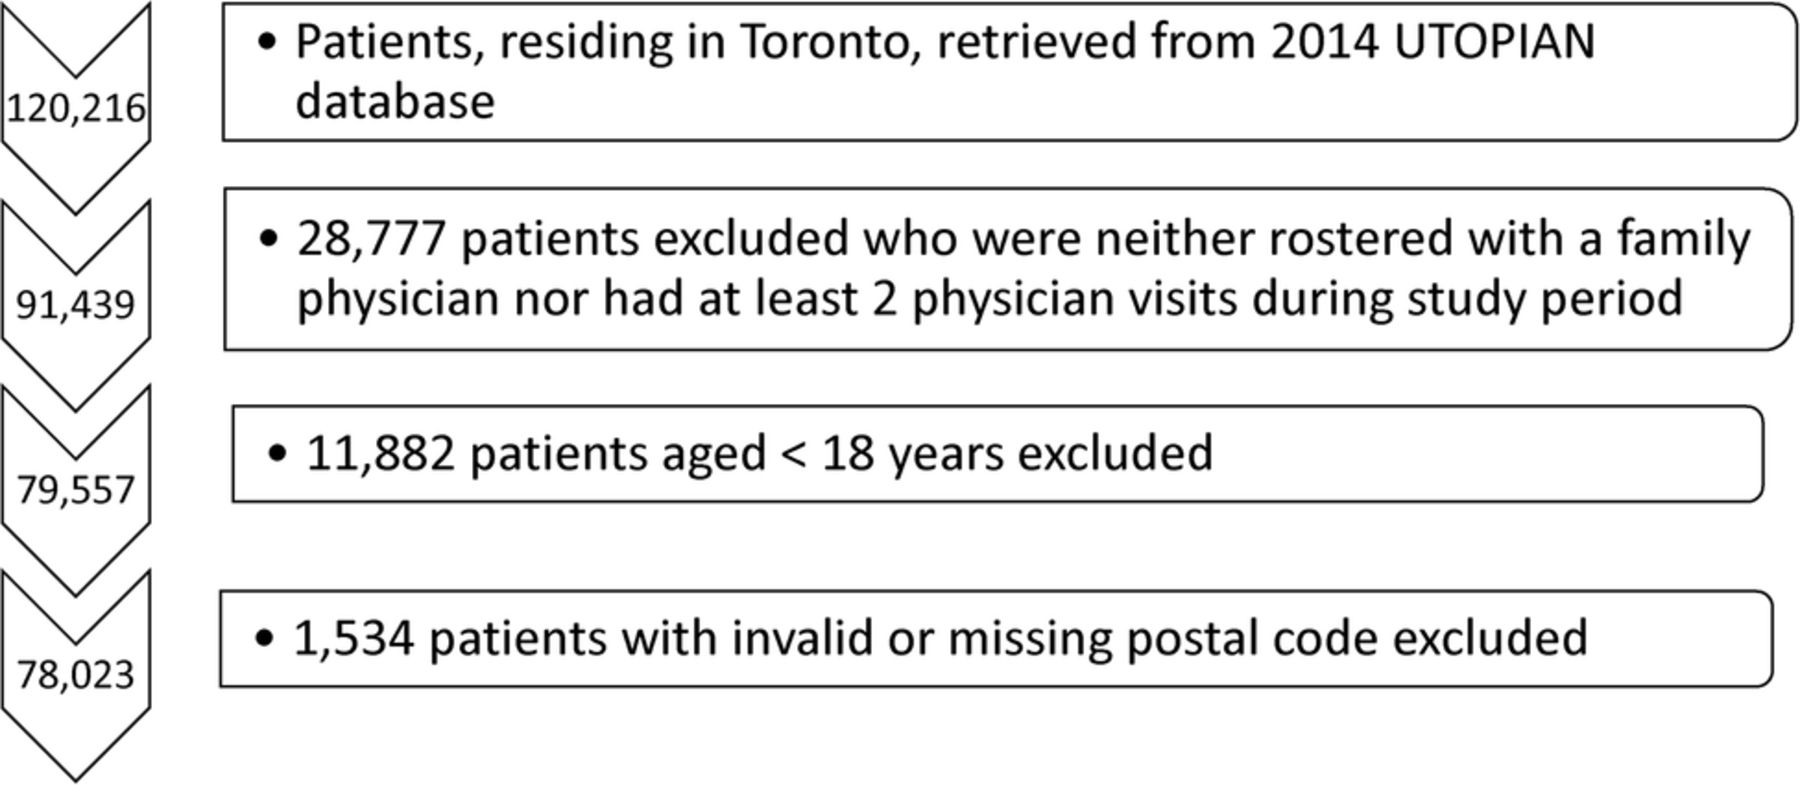
Sequence of steps in generation of study sample.
Characteristics of the study sample are displayed in table 1. Residents of the lowest and highest quartiles of neighbourhood walkability were similar with respect to age, proportion of women and proportion of smokers. Neighbourhoods in the highest walkability quartile had higher violent crime rates, somewhat lower deprivation scores, but similar ethnic concentration compared with neighbourhoods in the lowest quartile. A map of Toronto's 140 neighbourhoods and their Walk Scores is displayed in figure 2. The most walkable neighbourhoods were concentrated in Toronto's downtown core. Neighbourhood Walk Scores ranged from 42 to 99.
Descriptive characteristics of study participants

Map of Toronto neighbourhood walkability as measured by neighbourhood Walk Scores. Walk Scores for Toronto neighbourhoods (n=140) were retrieved from the City of Toronto Open Data Catalogue.40
Unadjusted means and 95% CIs for all health measures in the lowest and highest quartiles of neighbourhood walkability are displayed in table 2. All differences in unadjusted means were significant at the p<0.001 level.
Unadjusted means and 95% CIs for health measures in the lowest and highest quartiles of neighbourhood walkability
Table 3 displays the adjusted linear regression coefficients comparing differences in the mean health measures between the highest and lowest quartiles of neighbourhood walkability. Data for all quartiles are reported in online supplementary table S1. After adjusting for covariates, there were statistically significant differences in average measures of BMI, sBP, dBP, HbA1c and HDL between participants in the highest versus the lowest walkability quartile.
Supplementary table
Adjusted linear regression coefficients comparing differences in the mean health measures between the highest and lowest quartiles of neighbourhood walkability
The mean BMI was 2.64 kg/m2 lower (95% CI −2.98 to −2.30, p<0.001) among individuals in the highest versus the lowest neighbourhood walkability quartile. In the stratified analyses, this difference was greatest in those aged 18 to under 40, where the mean BMI was −4.44 kg/m2 lower (95% CI −5.09 to 3.79, p<0.001), and smallest in those over age 65, where the mean BMI was 0.87 kg/m2 lower (95% CI −1.48 to −0.26, p=0.005).
When comparing average blood pressure measurements of individuals in the highest versus the lowest walkability quartile, the mean sBP was 1.35 mm Hg lower (95% CI −2.01 to −0.70, p<0.001) and the mean dBP was 0.60 mm Hg lower (95% CI −1.06 to −0.14, p=0.010). When stratifying by age categories, significant differences in the mean sBP and dBP were observed only in those aged 40–65.
With respect to blood glucose control, the mean HbA1c was 0.063% lower (95% CI −0.11 to−0.021, p=0.003) in those within the highest neighbourhood walkability quartile compared with those in the lowest quartile. After age stratification, a statistically significant difference was only present in those aged 18 to under 40. No evidence of differences in the mean FBG was observed between the highest and the lowest quartiles of neighbourhood walkability.
In terms of cholesterol parameters, the mean HDL was 0.052 mmol/L higher (95% CI 0.029 to 0.075, p<0.001) in those in the highest versus the lowest neighbourhood walkability quartile. Across the age subgroups, a significant difference in the mean HDL was present only in the two older age categories. The difference observed in the mean TC was of borderline statistical significance, and in the stratified analyses, was only significant in those aged 40–65. No strong evidence of differences in other cholesterol parameters was apparent.
Discussion
Key findings: neighbourhood walkability and metabolic risk factors
We observed an association between higher neighbourhood walkability and objectively measured metabolic risk factors. The magnitude of differences observed for BMI across all age groups and for blood pressure in middle-aged adults was clinically significant and relevant for population health.
Strengths and limitations
The main strength of this study is that it used EMR data to examine a set of clinical measures known to change with physical activity, all of which were objectively measured through physical examination or laboratory testing. The study controlled for individual clinical attributes as well as neighbourhood-level covariates that could have confounded the relationship between neighbourhood walkability and the metabolic risk factors of interest.28 ,32 ,50 ,51
Overall, the study population included a large and diverse sample of adults of all ages, with and without chronic disease. However, the application of the study findings to other adult populations in a developed, urban setting should also consider that these were primary care patients. In particular, the study population did not include children or adolescents, had more older adults and had a greater proportion of women than the general population of Toronto.52 With respect to major comorbidities, the prevalence of hypertension and diabetes in the study sample (20.8% and 9.0%, respectively) were comparable to the prevalence of these diseases in the general population of Toronto (22.7% and 10.4%, respectively).53 ,54 The study sample had a higher prevalence of overweight or obesity of 57.2% compared with the published Toronto prevalence of 45.8%.53 This may be related to the fact that the latter value is from self-reported population survey data, which is prone to under-reporting of BMI.55 National estimates that use directly measured BMI yield an overweight or obesity prevalence of 62%.56 Given that CPCSSN is the first multidisease, EMR-based surveillance system in Canada, further work would be of interest to characterise the sociodemographic and health attributes of participating patient populations, especially in relation to the general population.
The main limitation of this study is its cross-sectional nature, which precludes the establishment of temporality in the association between neighbourhood walkability and health outcomes. Importantly, it is not possible to rule out a residential selection effect, in which healthier individuals who choose to engage in more health-promoting behaviours, such as physical activity, may also choose to live in more walkable areas to facilitate their preferred lifestyle. In other studies that either controlled for neighbourhood self-selection or were longitudinal in design, significant associations were still observed between neighbourhood walkability and levels of overweight or obesity.57 ,58 This study did not control for leisure physical activity, which may also influence the measured clinical outcomes, but—unlike utilitarian walking—is not thought to be a key mediator of the putative health benefits of walkable built environments.20 ,21 ,29 ,59 Based on a recent study in Ontario, Canada, which found that differences in leisure physical activity were not significant between individuals from areas of varying walkability,29 any significant confounding by leisure physical activity would have biased results towards the null and led to underestimation of effects in the present study. Dietary information could not be captured in a valid manner using EMR data in this study. It is possible that dietary habits, particularly as linked to the food environment, may differ between neighbourhoods of high versus low walkability,60 ,61 but the extent to which this may have affected estimates in this study is unclear. Similarly, this study did not control for major disabilities or mobility limitations which may have precluded engagement in utilitarian walking in affected participants. This may have contributed to the attenuation of differences in the mean BMI observed in older adults. Future work that controls for mobility limitations would be of interest to better explore the effects of neighbourhood walkability in older populations, particularly given that an association between walkability and physical activity has been previously reported in adults aged 65 and older.62
Findings in relation to other studies
The BMI findings are consistent with several recent studies which demonstrated lower prevalence of obesity in high-walkability neighbourhoods compared with low-walkability neighbourhoods.29 ,30 ,33 ,34 Importantly, this study quantified the magnitude of the mean difference in BMI that was observed (2.64 kg/m2), and found that this clinically meaningful difference varied across three age categories. In a previous longitudinal study of 701 participants, residential relocation involving a 10-point increase in street address Walk Score was associated with an average within-individual BMI reduction of 0.06 kg/m2.57 The magnitude of this effect was smaller than the 2.64 kg/m2 difference in the mean BMI that was observed in this study, between the highest and lowest neighbourhood walkability quartiles (a difference of about 20–60 points in aggregate neighbourhood Walk Score). Importantly, the scale at which walkability was measured in the present study was at the larger neighbourhood level, rather than at the level of each resident's individual address. This has interesting implications for determining the spatial scale at which a built environment might exert positive health effects mediated by walkability and utilitarian physical activity.
With respect to blood pressure, one previous study that measured walkability and fast-food outlet density reported an association with blood pressure decreases in older adults,60 while another study found no association between walkability and self-reported hypertension.34 The effect size of aerobic exercise on blood pressure reduction has been reported as −3.84 mm Hg for sBP and −2.58 mm Hg for dBP.63 Thus, it is plausible that the small differences in the mean sBP and dBP in the current study may be attributable to differences in levels of utilitarian walking. In the age-stratified analyses, only adults aged 40–65 demonstrated a significant difference in the mean sBP and dBP. In Canada, the age-specific prevalence of hypertension follows an S-shaped curve, with a prevalence of 5.7% in adults aged 35–39, which rises steadily from 9.3% in adults aged 40–44 to 53.6% in adults aged 65–69.64 The lack of association in younger adults may be related to insufficient power in this study to detect blood pressure differences where hypertension prevalence is low. Alternatively, an association between walkable neighbourhoods and blood pressure may not exist or be relevant in younger adults, for which the incidence and risk of hypertension is already quite low (<1% incidence in Canadians under 40 years of age).64 In older adults, potential explanations for a lack of an association include decreased mobility and ability to engage in utilitarian walking, or the possibility that physical activity effects on blood pressure become relatively insignificant in the context of multiple medications and comorbidities in this age group.
Although previous studies have found an association between neighbourhood walkability and both the prevalence and incidence of diabetes,30 ,32 ,33 associations between neighbourhood walkability and HbA1c have not been reported. In a systematic review and meta-analysis of 23 RCTs, structured aerobic exercise durations of 150 min or less per week were found to be associated with HbA1c reductions of 0.36%.65 The observed difference in the mean HbA1c in this study was considerably smaller. This suggests that the level of physical activity potentially promoted by a more walkable neighbourhood may not be strongly associated with clinically significant changes to HbA1c. Another possibility is that the observed relationship between neighbourhood walkability and the mean HbA1c may have been confounded by variations in individual diet as well as in the larger food environment. Furthermore, given that neighbourhood walkability is associated with BMI and obesity prevalence, both of which influence the risk of diabetes, this may explain the finding of higher incidence and prevalence of diabetes in higher walkability neighbourhoods, rather than simply an independent effect of walkability on diabetes.
An association between neighbourhood walkability and objective cholesterol parameters has not been previously reported in the peer-reviewed literature. One previous study reported a lack of an association between walkability and self-reported hypercholesterolaemia.34 In a Cochrane review of exercise effects on overweight or obesity, an HDL improvement of 0.06 mmol/L was found among those who engaged in moderate aerobic exercise compared with controls with no treatment.66 This suggests that, in the current study, the observed difference in the mean HDL between the highest and lowest neighbourhood walkability quartiles is of a magnitude that could be plausibly attributed to a physical activity effect. The lack of consistent differences in other cholesterol parameters between the highest and lowest walkability quartiles is not incompatible with the literature. Indeed, a review of 51 studies, including 28 RCTs, of the effect of aerobic exercise training on blood lipids found that an increase in HDL was the most frequently observed outcome, and reductions in TC, LDL and TG were less commonly seen.67 Again, the current study did not control for dietary factors, which are known to influence cholesterol parameters,68 and the observed associations should be interpreted with this in mind.
Implications of findings for population health
From a clinical perspective, recognising the relative walkability of a patient's residential neighbourhood may aid health providers in making context-appropriate physical activity recommendations for health maintenance and chronic disease management. More importantly, the implications for walkable environments as a public health intervention are significant if the health associations for walkability presented in this and other studies represent a truly causal relationship. In other words, a highly walkable neighbourhood could represent a population-wide intervention capable of conferring multiple benefits related to obesity prevention, blood pressure control and potentially even blood glucose and lipid control. At the population level, even small changes in average BMI or blood pressure have the potential to ‘shift the curve’ with respect to the population distribution of disease risk. By lowering the average level of risk factors, such a population strategy targets the determinants of disease incidence and may have the capacity to prevent a considerable fraction of obesity, hypertension, diabetes and cardiovascular disease that is attributed to physical inactivity.69 ,70
One final issue of relevance for policymakers is that of equity. This study demonstrated that across 140 neighbourhoods within a single city, variations in health existed based on walkability characteristics of the built environment. Addressing the determinants of health and health equity at the population level should therefore include built environment considerations, such as access to public transportation and safe pedestrian infrastructure.
Conclusions
There is a clinically meaningful association between living in a neighbourhood in the highest walkability quartile and having lower BMI and modestly lower blood pressure. This study demonstrates that EMR data can be a source of objective clinical measures for population health research. Further longitudinal studies on walkable environments are needed to provide a realistic estimate of the magnitude and distribution of their health effects on the population, and to clarify the spatial scale at which neighbourhood walkability realises these effects. Further research is also needed to examine the broader health and non-health impacts of walkable neighbourhoods, particularly if they are implemented as a built environment intervention at the population level.
References
Footnotes
Contributors CKJL conceptualised the study. CKJL and DL designed the analyses in consultation with MG and BA. CKJL cleaned and analysed the data, and drafted the manuscript. All authors contributed to revising the paper.
Funding This research received no specific grant from any funding agency in the public, commercial or not-for-profit sectors.
Competing interests None declared.
Ethics approval This study was reviewed and approved by the Canadian Primary Care Sentinel Surveillance Network (CPCSSN) Research, Privacy and Ethics Officer and by the London School of Hygiene and Tropical Medicine MSc Research Ethics Committee.
Provenance and peer review Not commissioned; externally peer reviewed.
Data sharing statement No additional data are available.