Article Text

Abstract
Purpose People with type 2 diabetes (T2D) have a doubled morbidity and mortality risk compared with persons with normal glucose tolerance. Despite treatment, clinical targets for cardiovascular risk factors are not achieved. The Hoorn Diabetes Care System cohort (DCS) is a prospective cohort representing a comprehensive dataset on the natural course of T2D, with repeated clinical measures and outcomes. In this paper, we describe the design of the DCS cohort.
Participants The DCS consists of persons with T2D in primary care from the West-Friesland region of the Netherlands. Enrolment in the cohort started in 1998 and this prospective dynamic cohort currently holds 12 673 persons with T2D.
Findings to date Clinical measures are collected annually, with a high internal validity due to the centrally organised standardised examinations. Microvascular complications are assessed by measuring kidney function, and screening feet and eyes. Information on cardiovascular disease is obtained by 1) self-report, 2) electrocardiography and 3) electronic patient records. In subgroups of the cohort, biobanking and additional measurements were performed to obtain information on, for example, lifestyle, depression and genomics. Finally, the DCS cohort is linked to national cancer and all-cause mortality registers. A selection of published findings from the DCS includes identification of subgroups with distinct development of haemoglobin A1c, blood pressure and retinopathy, and their predictors; validation of a prediction model for personalised retinopathy screening; the assessment of the role of genetics in development and treatment of T2D, providing options for personalised medicine.
Future plans We will continue with the inclusion of persons with newly diagnosed T2D, follow-up of persons in the cohort and linkage to morbidity and mortality registries. Currently, we are involved in (inter)national projects on, among others, biomarkers and prediction models for T2D and complications and we are interested in collaborations with external researchers.
Trial registration ISRCTN26257579
- General diabetes
- Diabetes & Endocrinology
- Epidemiology
- Primary care
This is an Open Access article distributed in accordance with the Creative Commons Attribution Non Commercial (CC BY-NC 4.0) license, which permits others to distribute, remix, adapt, build upon this work non-commercially, and license their derivative works on different terms, provided the original work is properly cited and the use is non-commercial. See: http://creativecommons.org/licenses/by-nc/4.0/
Statistics from Altmetric.com
Strengths and limitations of this study
The Hoorn Diabetes Care System cohort constitutes a large collection of individuals with type 2 diabetes (n=12 673 and still growing) with a low dropout rate. Almost all persons with type 2 diabetes in the catchment area are included.
Some persons were lost to follow-up due to a serious life-threatening disease, which could result in selective missings.
The cohort contains mainly people of Western European origin and the contribution of other ethnic groups is limited.
Annually repeated, standardised examinations according to centrally standardised protocols are available, including linkage with data on microvascular and cardiovascular complications, and cause-specific mortality. All this information is combined in a dataset in which repeated clinical measures can be related to clinical outcomes, which are measured in a setting typical for the real world.
The infrastructure and database we have built in the past years is highly suitable for additional studies and measurements.
Introduction
Population-based studies on glucose tolerance, including our own Hoorn Study,1 have shown a doubled morbidity and mortality risk in people with type 2 diabetes (T2D),2 despite multifactorial treatment.3 Additionally, with target values for cardiovascular risk factors not being achieved, diabetes care in the Netherlands was in need of improvement.4 For this reason, in 1996 we started with centrally organised diabetes care in the region West-Friesland, a semi-urban region with 2 00 000 inhabitants and representative for a Western-European, semi-urban population resulting in the Hoorn Diabetes Care System cohort (DCS). The DCS centre is responsible for the quality of T2D care and uses managed care plans, collaborating with contracted general practitioners (GPs). The managed care plan encompasses the care provided by a person’s GP, according to the Dutch College of GPs’ treatment guidelines for T2D and a standardised annual assessment organised centrally by the DCS centre. Until the beginning of 2012, GPs were free to collaborate with the DCS and to refer the people with T2D to the system. The participation rate gradually increased between 1996 and 2012. From the start of 2010, reimbursement of diabetes care took place by the DCS. From that time on, all people with T2D were referred to the system. At the beginning of 2015, only 96 people with possible T2D but with insulin-pump treatment were under secondary care in the target region. The DCS study is a prospective cohort study representing a comprehensive dataset on the natural course of T2D, with repeated clinical measures and outcomes during follow-up. In this paper, we describe the design of the DCS cohort.
Cohort description
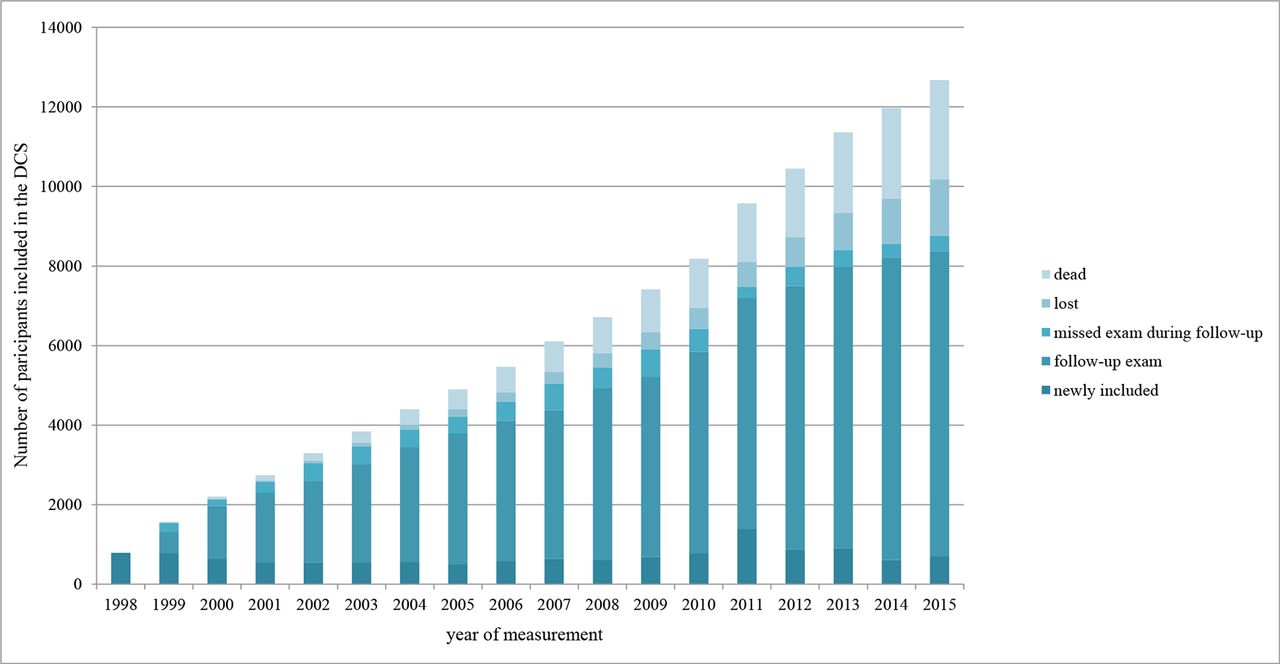
Currently, almost all people with T2D from all the 103 GPs in the West-Friesland region of the Netherlands are included in this prospective dynamic cohort. Since its start in 1996, the proportion of all people with T2D referred to our centre has increased every year, and from 2010 onwards all people with T2D from the catchment region have been referred (figure 1). In 2013, only 2% of the people with T2D were in secondary care, and according to the GP records, <5% declined to participate in the study, mostly due to psychiatric disorders. Persons with T2D who were unable to travel were visited at home. We are not able to compare responders with non-responders. In 2015, 12 673 individuals with T2D and at least one annual examination at the DCS centre had been enrolled in the study, of which 2497 had died during follow-up. Baseline characteristics of the DCS cohort are presented in table 1. In total, there were 70 261 follow-up visits in the database, with <3.1% missing information for each biomedical variable and <3.5% for microvascular and cardiovascular complications. Figure 1 depicts the number of exams that were completely missed during follow-up and the number of participants that were lost to follow-up. Up until now, 1413 participants (11.1%) were lost to follow-up. For specific research projects people were approached individually, but only after approval of the protocol by the Ethical Review Committee of the VU University Medical Center, Amsterdam and obtaining written informed consent. We keep anonymised computer records and the participants were informed about the use of these records for research purposes.
The number of participants with type 2 diabetes included in the Hoorn Diabetes Care System (DCS) cohort. For each year, the numbers of participants newly included in the cohort, participants with a follow-up exam, participants with a missed exam during follow-up, participants who were lost to follow-up and participants who had died are presented.
Baseline characteristics of the Hoorn Diabetes Care System cohort
Follow-up
In this prospective cohort study, examination of persons with T2D is performed annually. Inclusion of persons newly diagnosed with T2D, that is, baseline measurement within 1 year after diagnosis, occurred in 55.7% of the participants, with a median diabetes duration of 0.2 years (interquartile range (IR): 0.1 to 0.4). The remaining 44.3% was included at least 1 year after T2D diagnosis, with a median diabetes duration of 4.5 years (IR: 2.1 to 9.0). For each person, the year of entry into the cohort was considered the baseline measurement and were followed-up until death or movement out of the catchment region. Overall, 10% of the participants were regarded lost to follow-up with either the last two measurements (year 2014 and 2015) missing or the last two assessments before death (figure 1). Reasons for loss to follow-up are moving out of the catchment region, moving to a nursery home or referral to secondary care. No differences were observed in clinical characteristics between participants who were lost to follow-up and those who remained in the cohort, except for older age and longer diabetes duration.
Measurements
Confirmation of diabetes
T2D was considered confirmed if at least one of the following measures was reported by the GP: 1) one or more classic symptoms, including excessive thirst, polyuria, weight loss, hunger or pruritus, all in combination with elevated plasma glucose concentrations, either fasting plasma glucose ≥7.0 mmol/L or random plasma glucose ≥11.1 mmol/L; 2) in the absence of symptoms at least two elevated plasma glucose concentrations on two different occasions. People with diabetes at the age of 40 years or younger who needed insulin within 4 weeks after the diagnosis of diabetes were excluded.
Measurements
Participants were instructed to refrain from eating and drinking (except drinking water) from 22:00 hours the night before the visit. The following measurements were conducted annually using fasting blood, specified by standard operating procedures. Haemoglobin A1c (HbA1c) determination was based on the turbidimetric inhibition immunoassay for haemolysed whole EDTA blood (Cobas c501, Roche Diagnostics, Mannheim, Germany) and is expressed in mmol/mmol according to the International Federation of Clinical Chemistry and Laboratory Medicine (IFCC) as well as percentage according to the Diabetes Control and Complications Trial (DCCT)/National Glycohemoglobin Standardization Program (NGSP). Blood glucose level was assessed in fluorinated plasma with the UV test using hexokinase (Cobas c501, Roche Diagnostics). Levels of triglycerides, total cholesterol and high-density lipoprotein (HDL) cholesterol were determined enzymatically (Cobas c501, Roche Diagnostics). Low-density lipoprotein (LDL) cholesterol concentration was calculated using the formula: LDL cholesterol=cholesterol–HDL cholesterol– 0.45xtriglycerides.5 At triglyceride concentrations >4.5 mmol/L, the concentrations were determined directly in the LDL cholesterol assay. Details on the within-run and total coefficient of variation for all measurements are provided in the online Supplementary table S1.
Weight and height were measured, while participants were barefoot and wearing light clothes. Body mass index (BMI) was calculated by dividing weight (in kilograms) by the square of height (in metres). Systolic and diastolic blood pressure were measured twice (3 min apart) after 5 min of rest in a seated position on the right arm using a random-zero sphygmomanometer (Hawksley-Gelman, Lancing, Sussex, UK); from 2003 on, an oscillometric device was used (Colin Press-Mate BP-8800, Komaki City, Japan; from 2011 on, a Welch Allyn ProBP 3400, Skaneateles Falls, New York, USA). Previous research in this cohort compared the different blood pressure monitors which showed high agreement between the monitors (unpublished data).
Information on current medication use was registered yearly at the annual visit by checking the dispensing labels of the medication. Of each medication type, the Anatomical Therapeutic Chemical classification code, prescribed dosage regimen and dispensed quantity were registered.
Additional information on medication use could be obtained for a subsample of the DCS cohort (n=5822) by linkage to the outpatient PHARMO Database Network. This database contained data on dispensed drugs including drug name, class, dosage and repeat prescriptions at any given time, derived from pharmacy registries in the catchment region.6 7
Information on educational level, marital status, ethnic background and smoking status was obtained by self-report.
Microvascular complications
With regard to microvascular complications, we measured the presence of nephropathy using the urinary albumin-creatinine ratio (mg/mmol), from an overnight first-voided urine sample.
Urinary albumin was determined by the reaction of the antigen with anti-albumin antibodies and measured turbidimetrically (Cobas c501, Roche Diagnostics). The creatinine concentration in heparinised plasma and urine was determined enzymatically (Cobas c501, Roche Diagnostics). Kidney function was estimated according to the Modification of Diet in Renal Disease (MDRD) formula.8 Details on the within-run and total coefficient of variation for all measurements are provided in the online Supplementary table S1.
Second, the grade of retinopathy was determined using fundus photography of both eyes. Until 2000, fundus photography was performed using a Kowa Pro Fundus camera with green filter (Kowa Optical Industry, Torrance, California, USA). Black and white 35 mm photographs were taken 30 min after mydriasis with 0.5% tropicamide and 2.5% phenylephrine eye drops. From 2000 to 2004, fundus photography was performed using a non-mydriatic Canon CR5 camera (Canon, Tokyo, Japan). After 2004, fundus photography was performed with a non-mydriatic Topcon TRC NW 100 camera (Topcon, Tokyo, Japan). All fundus photographs were 45 degrees of two fields: one field centred on the macula and one nasal field with the optic disc positioned on a disc-diameter from the temporal edge of the field, according to the EURODIAB Prospective Complications Study protocol.9 In case of missing or failed fundus photography, data on retinopathy were retrieved from the regional hospital. All photographs were graded according to the EURODIAB classification score9 : grade 0: ‘no retinopathy’, grade 1: ‘minimal non-proliferative retinopathy’, grade 2: ‘moderate non-proliferative retinopathy’, grade 3: ‘severe non-proliferative or preproliferative retinopathy’, grade 4: ‘photocoagulated retinopathy’ and grade 5: ‘proliferative retinopathy’ (see online Supplementary Table S2). Until the end of 2014, grading was performed by one ophthalmologist. Thereafter, automated grading was implemented (IDx-DR device) and in case of referral diabetic retinopathy, images were reassessed by an ophthalmologist for final grading. Validation of this method in the DCS cohort showed a high specificity and sensitivity in the detection of referable diabetic retinopathy.10 The adapted retina risk model was implemented in regular diabetes care provided by the DCS and people were invited according to different intervals.11
Third, screening of the foot was performed by 1) dermatological and musculoskeletal inspection, 2) check for skin pressure and foot deformity, 3) neurological assessment including test of protective sensation using a 10 g monofilament and test of vibratory sensation using a 128 Hz tuning fork, 4) assessing presence of peripheral arterial disease (PAD) by foot pulses and 5) assessing presence of limited joint mobility.12 13 According to this screening, risk of foot complications was classified using a modified Simm’s classification, which was used to determine care and care frequency: 0) no loss of protective sensation (PS) and no PAD; 1) loss of PS or presence of PAD, without signs of local increased pressure; 2 a) loss of PS combined with PAD, b) loss of PS combined with signs of local increased pressure caused by foot deformities and/or limited joint mobility (LJM), c) loss of PS combined with PAD and local increased pressure caused by foot deformities and/or LJM, d) signs of local increased pressure caused by foot deformities and/or LJM combined with PAD and 3) (history of) ulcer/amputation.14
Complications of the foot are categorised according to the classification system of the International Working Group on the Diabetic Foot: 0: no neuropathy, 1: neuropathy, 2: neuropathy and deformity or PAD, 3: history of foot ulceration or a lower-extremity amputation15 and is available for the cohort since 2010. Annual incidence of the three microvascular complications are shown in table 2.
Annual incidence of microvascular and cardiovascular complications
Cardiovascular complications
Cardiovascular events, including myocardial infarction, angina pectoris, heart failure, stroke, transient ischaemic attack and PAD was based on self-reported events during the annual visit. Annual incidence of self-reported cardiovascular disease ranged from 3.0% to 4.1%. Second, to assess the condition of the heart’s electrical conduction system a standard resting 12-lead ECG was taken and coded according to the Minnesota coding.16 Finally, the measurement of self-reported cardiovascular diseases is currently being verified against the electronic patient registration from the regional hospital and GP. In this morbidity and mortality registration, cardiovascular diseases are coded according to the International Classification of Diseases, Injuries and Causes of Death, ninth revision, including ICD-9 codes 390–459, and 798. Only verified cases of cardiovascular diseases were included. In a sensitivity analysis of 453 participants, we observed that the sensitivity of self-report was 86% while specificity was 90%. The positive and negative predictive values were 90% and 87%, respectively.
Cancer
A subsample of the study population, n=3150, gave informed consent for linkage with information on cancer morbidity which was obtained from the nationwide Netherlands Cancer Registry and includes ongoing data starting from 1991. Topography and morphology are coded according to the International Classification of Diseases for Oncology. Data on primary treatment, chemoradiation, radiotherapy, hormone therapy and surgery have been included.
Mortality
Vital status is checked every 6 months using the National population registry and cause of death is determined using GP records and coded as explained earlier using the morbidity and mortality registry. Cause of death is coded according to the ICD-9.
Biobanking
Biobanking started in 2008. As part of the Dutch academic biobanking ‘String of Pearls Initiative’17 and Biobanking and BioMolecular resources Research Infrastructure (BBMRI Biobank), we have collected additional urine plasma, serum and citrate plasma samples from a random sample of about 5500 persons in our cohort and stored those at −80°C for future use. Of 1700 participants, we have repeated samples during follow-up. The following analyses have been performed in (part of) the biobank samples: isolation of DNA (all) and RNA (n=1030, two time points), genome-wide SNP genotyping (GWAS, n=3400), RNA sequencing at two time points (n=400) and metabolomics (n=1000). Metabolomics data were obtained using a high-throughput proton (1 hour) nuclear magnetic resonance metabonomics approach by the company Brainshake.18 19 For metabolomics in the diabetes research on patient stratification (DIRECT) study, Biocrates and metabolon platforms have been used. The possibility for additional assays and/or in silico analyses exists and can be requested.
Additional measurements
In smaller, random subsamples of the cohort, the following additional measurements have been performed: questionnaires on lifestyle,20–22 determinants of behaviour change,23–25 risk and illness perceptions,26 27 depressive symptoms,28–31 subjective health,32–35 quality of life,36 treatment satisfaction,37–41 dietary records and diabetes coping.42–47 Additional physical and laboratory measurements have been performed in 167 persons with recently diagnosed T2D, for a FP7-IMI project, the DIRECT study,48 including physical activity measurement by accelerometer, sleep behaviour and abdominal MRI. Currently, we are involved in the EU project on biomarkers for renal degeneration ‘Proteomic prediction and renin angiotensin aldosterone system inhibition prevention of early diabetic nephropathy in type 2 diabetic patients with normoalbuminuria (PRIORITY)’49 and the 'Risk assessment and progression of dabetes (RHAPSODY)' project focussing on novel biomarkers for T2D.50
Findings to date
Although up until now, our cohort has not been extensively used for research already some really interesting findings have been published. Currently, 25 papers have been published and several submitted. About 20 studies are currently in progress, focussing on improvement of diabetes care and risk models for the prediction of diabetes-related complications, steps to more personalised medicine. Some of the key findings from the DCS cohort are presented below.
Longitudinal patterns
In persons with T2D, four subgroups with distinct HbA1c trajectories were identified.51 The first two subgroups (92%) reached and maintained good glycaemic control over time (HbA1c ≤53 mmol/mol). Only a small subgroup (8%) showed a more unfavourable course of glycaemic control. These persons were younger, had higher HbA1c levels and a longer diabetes duration at baseline. Additionally, we identified four classes with distinct trajectories of systolic blood pressure (SBP) control; an adequate SBP control class (86%), a delayed responders class (6%), an insufficient SBP control class (3%) and a non-responders class (5%).52 People within SBP classes other than the adequate SBP control class were older, more often female, had higher BMI and SBP levels and a higher prevalence of microvascular complications and cardiovascular mortality. Different patterns of retinopathy development were identified, those with progressive retinopathy had a longer diabetes duration and higher levels of HbA1c and SBP compared with participants with less progressive retinopathy.53
Genetics of T2D
In the past years, our biobank data have been used to assess if genetic variation can explain variability in response to diabetes medication. We observed that carriers of A allele of the single nucleotide polymorphism (SNP) rs11212617 near the ATM gene, which is involved in the 5' adenosine monophosphate-activated protein kinase (AMPK) signalling pathway, have a lesser response to metformin, compared with C allele carriers.54 Additionally, we observed SNP rs7202877, near the digestive enzyme chymotrypsin (CTRB1/2) was associated with the expression of the enzyme and that carriers of the G allele, have a lesser response to DPP4-inhibitor treatment, compared with T allele carriers.55 Furthermore, our data have been used in replication studies for genetic determinants of T2D development and progression, which identified several SNPs, such as CD300LG, COBLL1 and MACF1, 56 SULF2, 57 DRD2/ANKK1 58 and GCK, G6PC2, MTNR1B and GCKR. 59 Overall, these data show the role of genetics in the development and treatment of T2D and provide options for personalised medicine.
Microvascular and cardiovascular complications
A prediction model for personalised diabetic retinopathy screening was validated in the DCS cohort. The model showed good predictive accuracy and screening frequency could safely be reduced, indicating that the use of the model may facilitate personalised screening leading to reductions in healthcare use and costs.11
In a subsample of the DCS cohort, the effect of cardiovascular disease risk communication was investigated. The difference between actual and perceived cardiovascular risk was lower after the risk communication intervention, compared with the control group, but disappeared after 12 weeks.60 With the aim to decrease cardiovascular risk, a subsample of the DCS cohort received a cognitive behavioural intervention to improve weight status. This intervention however did not change weight, risk of cardiovascular disease or quality of life after 6 months.61
Strengths and limitations of this study
One of the weaknesses of the DCS cohort is that it contains mainly people of West-European origin and the contribution of other ethnic groups is very limited. Second, some persons were lost to follow-up due to a serious life-threatening disease, which could result in selective missings. If the annual measurement is then missed, no standardised measurements are available. An integrated medical record system for all care providers although in a naturally defined region would be desirable. However, this is not possible in the present healthcare situation in the Netherlands. Third, detailed information on pharmaceutical treatment, like daily dose and change of medication during the year, is not available. For this purpose, linkage to information from other databases was required. Finally, biobanking started in 2008 and samples are missing for participants who died before that date.
The strengths of cohort are the large sample of persons with T2D, currently n=12 673, which is still growing. In the DCS cohort, almost all persons with T2D from participating GPs are included, with a very low proportion of persons in secondary care. The dropout rate is extremely low, due to a high acceptance of the system and the low emigration rates. Annually repeated, standardised examinations according to centrally standardised protocols are available. We therefore have a huge amount of information, including linkage with data on microvascular and cardiovascular complications, medication use, cancer morbidity and cause-specific mortality. All this information is combined in a dataset in which repeated clinical measures can be related to clinical outcomes, which are measured in a setting typical for the real world. Finally, the infrastructure and database we have built in the past years is highly suitable for additional studies and measurements.
Acknowledgments
This study was been made possible by collaboration with the Diabetes Care System West-Friesland. The authors thank participants of this study and research asDCS@vumc nld staff of the Diabetes Care System West-Friesland.
References
Footnotes
Contributors AAWAvdH conceived and designed the study, researched the data and wrote the manuscript. GN and JMD conceived and designed the study and reviewed and edited the manuscript. SPR, JWB, PE, LMtH, FR and NL contributed to discussion and reviewed and edited the manuscript. AAWAvdH had full access to the data and is the guarantor of this work. All authors reviewed and approved the final version of the manuscript.
Funding To perform additional research in (subsamples of) the DCS cohort, funding has been received from several instances including the VUMC, Dutch Federation of University Medical Centres, health insurers, Dutch Science Organisation NWO, Dutch Organization for Health Research and Development ZonMw, Dutch Diabetes Foundation, European Foundation for the Study of Diabetes, International Diabetes Federation, European Innovative Medicine Initiative and European Union.
Competing interests None declared.
Patient consent Obtained.
Provenance and peer review Not commissioned; externally peer reviewed.
Data sharing statement Researchers can apply for data by submitting a proposal to DCS@vumc.nl. After agreement of the proposed analysis by the steering committee, and after ethics approval and data transfer agreement, collaborative researchers receive individual patient data for the specific research question. For potential collaborators fees are depending on the amount of work for data extraction.