Article Text

Abstract
Objectives To characterise the sex-specific difference in the association between anthropometric changes and risk of diabetes in the general population in Canada.
Setting and participants From 2000 to 2008, Alberta’s Tomorrow Project (ATP) invited Alberta’s residents aged 35–69 years to a prospective cohort study. A total of 19 655 diabetes-free ATP participants having anthropometrics measured at the baseline and follow-ups were included.
Design and outcome measures A longitudinal study design was used to examine the association between anthropometric changes and risk of diabetes and the sex difference in this association. Changes in weight, body mass index (BMI), waist circumference (WC) and waist-hip-ratio (WHR) were calculated as the difference between baseline and follow-up measures. Diabetes cases were identified using the Canadian National Diabetes Surveillance System algorithm with administrative healthcare data (2000–2015) linked to the ATP cohort. The sex-specific association between anthropometric changes and incidence of diabetes were examined by multivariable Cox regression models.
Results Changes in weight, BMI, WC and WHR over time were positively associated with incidence of diabetes in both men and women. The sex difference in risk of diabetes associated with 1 standard deviation (SD) increase in anthropometrics was 0.07 (95% CI −0.02 to 0.14) for weight, 0.08 (95% CI −0.03 to 0.17) for BMI, 0.07 (95% CI −0.02 to 0.15) for WC and 0.09 (95% CI 0.03 to 0.13) for WHR. Similar results were found in sex difference in the associations with changes per 5% and changes per categories (5% loss, ±5%, 5% gain).
Conclusions The positive association between anthropometric changes and risk of diabetes was generally stronger in men than in women. However, this sex-specific difference of approximately 10% of the total risk associated with anthropometric changes had limited significance. For population-based public health programmes aiming to control obesity and incidence of diabetes, it may not be necessary to set up sex-specific goals for anthropometric reduction.
- anthropometric changes
- diabetes
- sex difference
- longitudinal study
- Alberta’s Tomorrow Project
This is an open access article distributed in accordance with the Creative Commons Attribution Non Commercial (CC BY-NC 4.0) license, which permits others to distribute, remix, adapt, build upon this work non-commercially, and license their derivative works on different terms, provided the original work is properly cited, appropriate credit is given, any changes made indicated, and the use is non-commercial. See: http://creativecommons.org/licenses/by-nc/4.0/.
Statistics from Altmetric.com
Strengths and limitations of this study
Using data from Alberta’s Tomorrow Project, a large population-based cohort, our study was able to characterise sex-specific difference in the impact of anthropometric changes over time on risk of diabetes.
Cases of diabetes were identified using the Canadian National Diabetes Surveillance System approach, a well-validated algorithm, to identify diabetes cases from administrative healthcare data.
Anthropometric measures considered in this study include body mass index, a measurement of overall obesity, waist circumference and waist-height-ratio, the central obesity indicators and waist-hip-ratio, a body shape indicator.
With two follow-up measures of self-reported anthropometrics, our study considered anthropometric changes over time as time-varying exposure variables, which enables us to model the risk of diabetes with subject-specific variations and time-related variations in anthropometric changes.
Future study using objective measurements of anthropometrics would be more impartial in estimating the sex-specific difference in the association.
Introduction
Anthropometric measures, including weight, body mass index (BMI), waist circumference (WC) and waist-hip-ratio (WHR), are commonly used in clinical and research settings for measuring obesity. However, different anthropometric measures have different potentials to demonstrate the sex-specific difference in obesity and obesity-related health outcomes, such as diabetes. As a measurement of overall obesity, BMI often overestimates body fat mass in men compared with women, as men generally have more lean mass (as a proportion of total mass) than women.1 WHR, a body shape indicator, has better potential to reflect the sex-specific difference in adiposity storage than BMI and WC,2 as men and women tend to store fat in different depots (abdomen vs hips and thighs, respectively).3 In addition, although the central obesity indicators WC4–7 and waist-height-ratio (WHtR) 6–9 have been suggested as better predictors of diabetes than BMI, little is known about the sex-difference in the predictability.10 11
A couple of controlled intervention studies, including the Diabetes Prevention Program (DPP) in the USA and the Diabetes Prevention Study in Finland, have suggested that among high-risk populations, weight loss (>5%) was associated with greater reduction in incidence of diabetes in men than in women, although these differences were not statistically significant.12 13 A subsequent study of the DPP participants in the USA also showed that men had a greater reduction in 2 hour glucose than women after achieving the same level of weight loss for individuals with high risk of diabetes.14 Our recent observational study of Alberta’s Tomorrow Project (ATP), a longitudinal cohort study in Canada, has also found that among individuals with obesity, moderate (5%–10%) reduction in BMI was associated with 34% (95% CI: 12% to 51%) reduction in risk of diabetes.15
However, fewer studies have investigated the sex-specific difference in the impact of anthropometric changes on risk of diabetes in general populations, and results have been inconsistent.10 11 16 A pooled analysis of two cohorts in Germany suggests that the risk increase in diabetes associated weight gain was similar between women and men.16 A cohort study in Japan, however, suggested that WC increase was associated with higher increase in risk of diabetes in women than men, although this difference was not statistically significant.10 Another cohort study in participants aged 50+years in Denmark showed that the association between changes in WC and risk of diabetes was only significant in women, but not in men.11 Allowing for variations in cohort characteristics and sample size,10 11 14 16 it is still uncertain whether the association between anthropometric changes and risk of diabetes is significantly different between men and women in general populations.
As a follow-up study of our previous investigation on the effect of BMI reduction on diabetes,15 in this study, we used the same cohort data from ATP, a population-based cohort study in Alberta, Canada, to further elucidate the potential sex difference in the impact of anthropometric changes, including BMI, WC and WHR, on risk of diabetes in general populations.
Methods
Study population
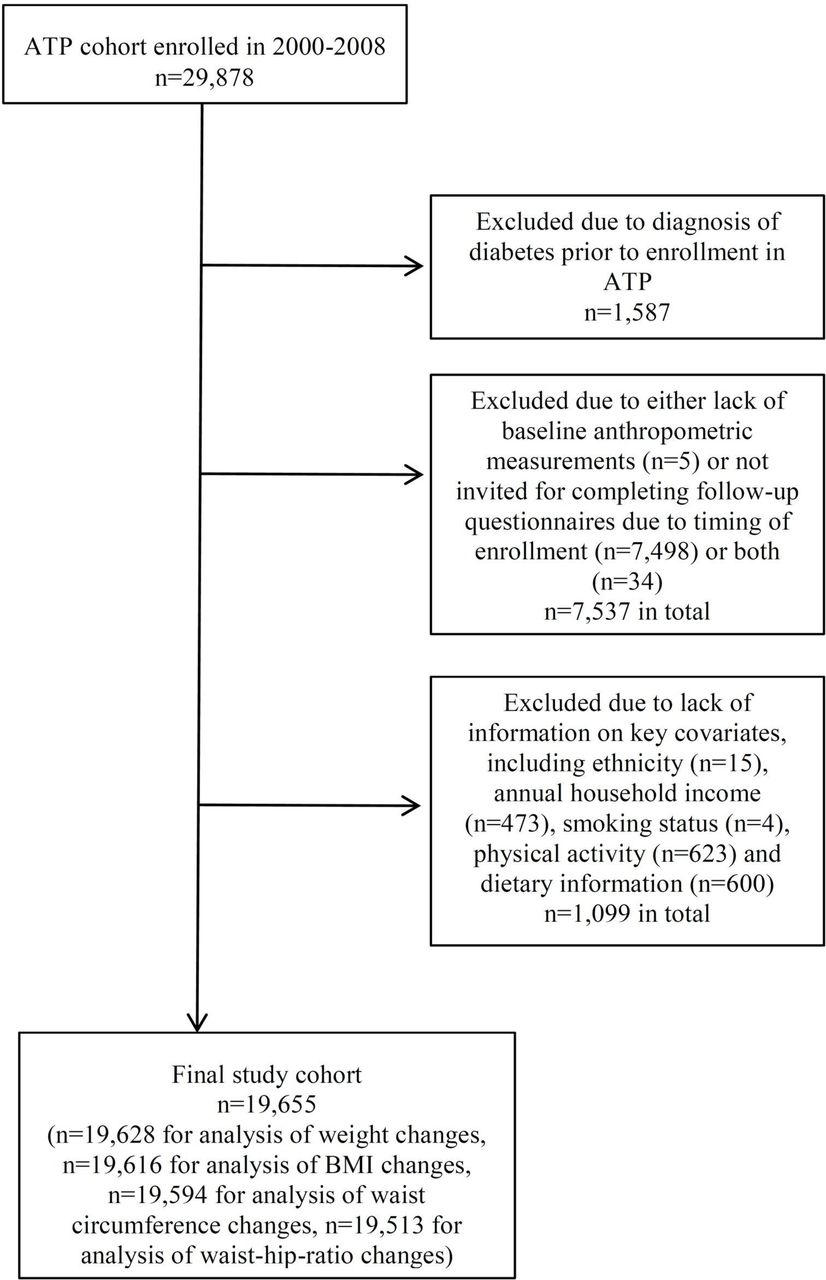
From 2000 to 2008, ATP recruited 29 878 Albertans aged 35–69 years with no history of cancer, other than non-melanoma skin cancer, at the time of enrolment by telephone random digit dialling.17 After enrolment, participants were invited to complete two follow-up questionnaires: Survey 2004 and Survey 2008. Survey 2004 was the first follow-up survey completed in 2004 for participants that were enrolled in 2000–2003. The mean time from baseline to this follow-up survey was 2.5±0.3 years; median was 2.5 years. Survey 2008 was a second follow-up survey conducted in 2008; this survey was conducted for all participants enrolled in 2000–2007. The mean time from initial baseline enrolment for participants to this survey was 4.2±2.2 years; median was 3.8 years. The anthropometrics self-reported at the follow-up surveys were used to determine changes in anthropometrics from the baseline. Incidence of diabetes was determined from the Alberta Health (AH) administrative healthcare data from time of enrolment to 31 March 2015, with mean follow-up time 10.4±2.7 years; median was 10.2 years. Figure 1 shows inclusion and exclusion criteria for this longitudinal study. After exclusion, the study population was 19 655 (n=19 628 for analysis of weight changes, n=19 616 for analysis of BMI changes, n=19 594 for analysis of WC changes, n=19 513 for analysis of WHR changes) diabetes-free participants with anthropometrics measured at the baseline and at least one follow-up and with completed information on key covariates, such as ethnicity, household income and lifestyle factors (smoking, physical activity and dietary intake). All ATP participants provided written consents to participating in ATP and allowing healthcare data linkage and long-term follow-ups at the time of enrolment.

Flowchart for the inclusion and exclusion of ATP cohort (2000–2008). ATP, Alberta’s Tomorrow Project; BMI, body mass index.
Anthropometric measurement
Basic anthropometrics, including weight (kg), height (cm), WC (cm) and hip circumference (HC, cm) were self-reported by participants at baseline and follow-ups. Similarly to our previous study,15 weight and height were corrected using sex-specific correction factors to reduce self-reporting bias.18 BMI was calculated by dividing body weight in kilograms by the square of participant’s height in metres. WHR was calculated as the ratio between WC and HC.
Anthropometric changes (∆) were calculated for weight, BMI (overall obesity indicator), WC (central obesity indicator) and WHR (body shape indicator). Absolute changes in anthropometrics (eg, ∆WC) were calculated by subtracting the baseline measures from follow-up measures. For easy interpretation and comparison, absolute changes were standardised with 1 SD of absolute changes. Relative changes in anthropometrics (eg, ∆WC%) were quantified as the percentage of change from baseline. Study participants were further classified based on relative changes in anthropometrics (ie, ±5%, >5% gain and >5% loss). All these three measures of anthropometric changes (absolute, relative and by categories) were used in this study to evaluate the potential impact of measurement bias on the results.
Diabetes case definition
Clinical information was obtained from the linked deidentified AH administrative health records (1 October 2000 to 31 March 2015). Diabetes cases were identified using the Canadian National Diabetes Surveillance System (NDSS) algorithm based on International Classification of Diseases (ICD)-9 and ICD-10 codes as previously described.15 19 An additional algorithm was developed to exclude prevalent cases based on self-report data, that is, self-reporting diabetes at enrolment, plus any of the following conditions: (i) ever hospitalised for diabetes, (ii) ever having physician claims for diabetes or (iii) ever taking diabetes medication with Anatomical Therapeutic Chemical Classification (ATC) code for insulin (A10A) or other glucose-lowering drugs (A10B).15 The index date of diabetes was determined by the earliest date of health records that contribute to the case definition. Cases were identified as ‘incident’ only if the index date was >6 months after enrolment to ensure true incident cases were identified. Incidence rate (IR) of diabetes was defined as number of incident cases per 1000 person-years (PY).
Other covariates in analyses
Based on risk factors for diabetes identified in the literature,20 participants were further categorised by the following variables at the baseline: parental history of diabetes (yes/no), whether or not (yes/no) physically active (defined as >210 min of moderate-intensity to vigorous-intensity recreational physical activities per week in the past year);21 tertiles (low, medium, high) of Healthy Eating Index 2005 Canada (HEI-2005-Canada), reflecting the overall diet quality;22 Elixhauser comorbidity index (0, 1, >2) calculated for the overall disease burden of participants;23 24 location of residence (rural/urban areas);25 smoking status (never, occasional smoker, former daily smoker, current daily smoker); annual household income (<$20k, $20k–29k, $30k–49k, $50k–79k, $80k+) and educational attainment (high school or less, some postsecondary, postsecondary).26
Statistical analyses
Means and SD were calculated for continuous variables; proportions were calculated for categorical variables. The normality of a continuous variable was checked using Shapiro-Wilk test. Pearson’s correlation (r) was used to examine the correlation between different anthropometric changes. Student t-test (for mean of continuous variables) and χ2 test (for proportion of categorical variables) were used to examine the difference between men and women in the baseline characteristics and anthropometric changes. Statistical analyses were performed using STATA software (Stata 2007, Release 14).
The sex-specific association between anthropometric changes and incidence of diabetes was examined using multivariable Cox proportional hazard models, with anthropometric changes as time-varying exposure variable and incidence of diabetes as outcome variable.27 Survival time in Cox regression models was defined as the time to incidence of diabetes or the end of study (31 March 2015). Time-varying exposures were handled by splitting time-to-event data into multiple observations based on the dates of follow-up measurement of anthropometrics in 2004 and 2008.28 Other covariates were not considered as time-varying variables in the Cox regression models, as the covariates did not vary over time (eg, ethnicity) or information was not reassessed in follow-ups beyond the baseline measurements (eg, physical activity and dietary intake). The magnitude of association was estimated by hazard ratio (HR) of diabetes associated with per SD change, per 5% change or per categories of anthropometric changes (±5% as reference group).
A purposeful selection method was used to build statistical models, that is, the known risk factors for diabetes, such as age, social determinants (annual household income), parental history of diabetes and lifestyle behaviours (physical activity, HEI-2005-Canada categories), were forced into the regression model and other covariates, including ethnicity, the corresponding baseline anthropometrics, living in rural/urban areas, educational attainment, smoking status, comorbidity index and interaction terms, that were non-significant at p≥0.05, were removed from the final model. In this study, a priori interaction with sex was examined and the corresponding subgroup analyses were conducted. Wald’s χ² test was used to examine the significance of interaction terms (sex differences) of the association from the Cox regression models. Inverse logarithm (antilog) was applied to the beta-coefficient of interaction term to calculate sex-specific HRs and the differences.
We also undertook several sensitivity analyses: (i) excluding participants who had extreme change in anthropometrics (ie, 2% cut-off in tails of the normally distributed anthropometric changes) to estimate impact of these extreme outliers; (ii) excluding participants who had a high degree (>3%) of discrepancy in self-reported heights between baseline and follow-ups to examine the potential impact of self-report errors; (iii) including participants who had missing values in covariates using a ‘missing indicator’ category to ensure our primary analysis was not affected by these exclusions; (iv) subgroup analysis of sex differences in the association by age groups.
Patient and public involvement
Patients and/or public were not involved in development of research question, study design, conducting study and result dissemination.
Results
Characteristics of study participants
The baseline characteristics of study participants are shown in table 1. Over 60% of participants were women. A greater proportion of men (83.0%) than women (64.6%) were considered being ‘overweight or obese’. On average, women had larger HC, but smaller WC and WHR than men (table 1). Compared with participants included in the analyses (n=19 655), participants who were excluded (n=8636) had similar age (49.4 vs 50.4 years), similar sex distribution (women: 60.5% vs 62.8%), similar levels of educational attainment (postsecondary or higher education: 71.2% vs 72.2%), slightly higher percentage of smokers (57.9% vs 54.0%) and slightly higher percentage of having multiple (≥2) comorbidities (16.6% vs 13.9%).
Baseline characteristics of study participants by sex
Anthropometric changes during follow-ups
On average, all four anthropometrics (weight, BMI, WC and WHR) increased from the baseline across follow-ups. Change in weight/BMI was moderately correlated (r=0.61) with changes in WC and weakly correlated (r=0.18) with changes in WHR. The majority (60%–70%) of participants had minimal to negligible (ie, ±5%) changes in anthropometric from their baseline measures, and a slightly greater proportion of participants had increased anthropometrics (∆>+5%) than those with a reduction (∆<–5%) (table 2). Women had a greater mean absolute gain in all four anthropometrics than men since the baseline, especially for WC and WHR (p<0.001). This sex-specific difference was more prominent in changes in WC and WHR than weight and BMI (table 2).
Anthropometric change from the baseline
Sex difference in anthropometric changes and incidence of diabetes
In 203 683 PY (average follow-up time: 10.4±2.7 years), 1226 incidences of diabetes were identified, with an incident rate (IR) of 6.0 cases per 1000 PY. There was a significant higher (p<0.01) IR of diabetes in men (591 cases in 75 741.0 PY, ie, 7.8 cases per 1000 PY) than in women (635 cases in 127 941.6 PY, ie, 5.0 cases per 1000 PY). When comparing the crude IR of diabetes across different categories of anthropometric changes (±5%, >5% gain and >5% loss), participants with >5% gain in anthropometrics, especially in weight, BMI and WC, had a higher IR of diabetes compared with participants with >5% loss. This result was consistently observed in men and women (table 3).
Incidence rate of diabetes stratified by sex and categories of anthropometric changes
Sex-stratified multivariable Cox regression analyses showed that on average, the positive association between anthropometric changes and risk of diabetes was greater in men than in women (table 4). Specifically, the increase in risk of diabetes associated with a per SD increase in anthropometrics was 20% (95% CI 14% to 27%) in men vs 13% (95% CI 8% to 19%) in women, respectively, for weight; 23% (95% CI 15% to 31%) vs 14% (95% CI 8% to 19%), respectively, for BMI; 25% (95% CI 18% to 34%) vs 18% (95% CI 12% to 24%), respectively, for WC and 17% (95% CI 11% to 22%) vs 8% (95% CI 5% to 11%) for WHR. Moreover, in both men and women, per SD (or per 5%) increase in WC was associated with the largest increase in risk of diabetes, followed by ∆BMI (or ∆weight) and ∆WHR (table 4).
Association between anthropometric changes and incidence rate of diabetes by sex: results from Cox regression*
In the regression models of the total population with an interaction term for sex, statistical tests showed that there were no significant (alpha=0.01) interactions with sex for the association between anthropometric changes and diabetes, except for changes in WHR (p<0.01). The risk difference between men and women for diabetes associated with 1 SD increase in anthropometrics was 0.07 (95% CI −0.02 to 0.14) for weight changes, 0.08 (95% CI −0.03 to 0.17) for BMI changes, 0.07 (95% CI −0.02 to 0.15) for WC changes and 0.09 (95% CI 0.03 to 0.13) for WHR changes. Similar results were observed for the sex difference in risk of diabetes associated with per 5% increase in anthropometrics and with different categories of anthropometric changes (table 4).
In sensitivity analyses of (i) excluding participants who had extreme anthropometric changes (2% cut-off in the normal distribution), (ii) excluding participants who had high degree (>3%) discrepancy in self-reported height between baseline and follow-ups, (iii) including participants who had missing values in categorical covariates and (iv) subgroup analysis of the sex difference by age groups, no significant changes were observed in beta-coefficient estimates of HRs for diabetes (online supplementary tables S1–S4).
Supplemental material
Discussion
Consistent with our previous findings on the impact of BMI changes on diabetes,15 in this study, we found that there was positive association between changes in all four anthropometrics we examined (weight, BMI, WC and WHR) over time and incidence of diabetes, and more importantly, this positive association was generally stronger in men than in women. In addition, the sex-specific difference in risk of diabetes was more evident for changes in the body shape indicator WHR compared with changes in obesity indicators BMI and WC, which might be due to the fact that men and women tend to have different body fat distribution even with the same degree of obesity.3 However, the sex difference observed in this study, which was approximately 10% of the total risk of diabetes associated with anthropometric changes for the majority of participants, had limited significance with noticeable uncertainty. Results of this study were consistent across age groups and ethnicity after controlling for a wide range of underlying risk factors for diabetes, including household income, initial anthropometrics, comorbidity index, parental history of diabetes, smoking status, leisure time physical activity and diet quality.
Our findings generally agree with previous intervention studies of high-risk populations, which showed that weight loss was more effective in reducing incident diabetes in men than in women, although the differences were not statistically significant.12 13 Nevertheless, in a longitudinal cohort study in Denmark, WC change in participants aged 50 years and above was not associated with risk of diabetes in men and only weakly associated with the risk of diabetes in women.11 A population-based cohort study in Japan showed that WC increase over time was associated with higher increase in risk of diabetes in women (HR=2.30 (1.31–4.04)) than in men (HR=1.84 (1.10–3.08)) among urban residents aged 30–83 years with WC at the median or higher.10 These inconsistent results were mainly due to the variations in the study cohort characteristics, especially in age and ethnicity. Age-related changes in sex hormone and endocrine balance29 may lead to varied results on the sex-specific difference between age groups,10 11 although this age-related sex difference was not evident in our study. Ethnicity is another factor that might contribute to the varied results between our study (92.7% Caucasian) and the study in Japan,10 as similar variations have also been observed in the sex-specific association between baseline WC and risk of diabetes in European,7 USA5 and non-Caucasian30–32 populations.
In our study, based on HRs in the Cox regression, increase in WC was associated with a relatively greater change in risk of diabetes compared with BMI and WHR; this observation is consistent with clinical findings that diabetogenic substances, such as triglycerides, free fatty acids, inflammatory cytokines and adipokines, are primarily produced from central adipose tissues,33–36 and many observation studies showing WC was a better predictor of diabetes compared with BMI.4–7 On the other hand, changes the body shape indicator WHR had a relatively weaker association with risk of diabetes, which was partially due to the fact that WHR, a ratio of WC and HC, tends to show no changes as when WC and HC have changes in the same direction. Nevertheless, further concordance tests (eg, Harrell’s C-statistics) are warranted to conclude on the predictability of different anthropometric changes on risk of diabetes.
The strengths of this study include a longitudinal analysis of sex-specific difference in the association between anthropometric changes and risk of diabetes in a large, province-wide population-based cohort. Instead of using self-reported information for incidence of diabetes, we used the NDSS approach, a well-validated method, to identify diabetes cases from deidentified administrative health data, although undiagnosed, or subclinical cases might be missing in administrative health records.37 In addition, our study was able to minimise the potential influence of undiagnosed diabetes on anthropometrics by using a 6 month clearance time.
Results of our study demonstrating the positive association between anthropometric changes and risk of diabetes in a Canadian cohort further support that anthropometric reduction is an effective approach to control obesity and reduce incidence of diabetes for general populations. Nevertheless, the small sex differences in the risk of diabetes associated with anthropometric changes suggest that it might not be necessary to implement sex-specific intervention to reduce anthropometrics for public health programmes aiming to reduce obesity and incidence of diabetes.
There were several limitations in our study. First, participants who had missing values in anthropometric measures and other covariates were excluded from our multivariable analyses. However, the sensitivity analyses of using missing indicators in the regression models showed that our results were robust when including the excluded participants in our analyses. In addition, participants excluded from the study were quite similar to those included with regard to age, sex distribution and socioeconomic status. Second, in our study, anthropometric measures were self-reported by participants and therefore might be subject to information bias. However, the sensitivity analyses of excluding participants with more than 3% discrepancy in self-reported heights between baseline and follow-ups (a potential indicator of self-reporting errors) from the analyses showed that self-reporting errors had minimal impact on our results. Finally, as men and women tend to have different preference when self-reporting their weight and height,18 using self-reported measurement may lead to biased estimation on the sex-specific association. Although we used sex-specific correction factors for weight and height measures to minimise sex-related self-reporting bias,18 future study with objective measurements of anthropometrics is warranted.
Conclusion
In summary, using data from a large population-based cohort, our study shows that the positive association between anthropometric changes and risk of diabetes was generally stronger in men than in women. However, the small sex differences (~10%) in the association suggest that for public health programmes aiming to control obesity and incidence of diabetes, it may not be necessary to set up sex-specific goals for anthropometric reduction.
Acknowledgments
We thank the contributions from participants and staff of Alberta’s Tomorrow Project (ATP). We also thank Alberta Health Analytics and Performance Reporting for helping us with data linkage of administrative healthcare data with the ATP cohort. This study is based in part on data provided by Alberta Health.
References
Footnotes
Contributors PJR, JAJ and DTE conceived the idea, originated the study and together with MY designed the study methodology. MY, DTE, JEV and J-YX contributed to study design and defining data variables. MY conducted all analyses on data. MY, PJR, JAJ, DTE, JEV and J-YX jointly wrote manuscript. All authors revised the manuscript for intellectual content and approved final submission.
Funding This study is supported by funding provided to Alberta’s Tomorrow Project from the Canadian Partnership Against Cancer, Alberta Cancer Foundation, Alberta Cancer Prevention Legacy Fund (administered by the Government of Alberta), Alberta Health Services and School of Public Health Bridge Funding, University of Alberta.
Disclaimer The interpretation and conclusions contained herein are those of the researchers and do not necessarily represent the views of the Government of Alberta. Neither the Government nor Alberta Health express any opinion in relation to this study.
Competing interests None declared.
Ethics approval This study was approved by the Health Research Ethics Board of the University of Alberta (study ID Pro00058561).
Provenance and peer review Not commissioned; externally peer reviewed.
Data sharing statement There are no additional unpublished data available for data sharing.
Patient consent for publication Not required.