Article Text

Abstract
Objective Diabetes has been growing as a major health problem and a significant burden on the population and on health systems of developing countries like Mexico that are also ageing fast. The goal of the study was to estimate the future prevalence of diabetes among Mexico’s older adults to assess the current and future health and economic burden of diabetes.
Design A simulation study using longitudinal data from three waves (2001, 2003 and 2012) of the Mexican Health and Aging Study and adapting the Future Elderly Model to simulate four scenarios of hypothetical interventions that would reduce diabetes incidence and to project the future diabetes prevalence rates among populations 50 years and older.
Participants Data from 14 662 participants with information on self-reported diabetes, demographic characteristics, health and mortality.
Outcome measures We obtained, for each scenario of diabetes incidence reduction, the following summary measures for the population aged 50 and older from 2012 to 2050: prevalence of diabetes, total population with diabetes, number of medical visits.
Results In 2012, there were approximately 20.7 million persons aged 50 and older in Mexico; 19.3% had been diagnosed with diabetes and the 2001–2003 diabetes incidence was 4.3%. The no-intervention scenario shows that the prevalence of diabetes is projected to increase from 19.3% in 2012 to 34.0% in 2050. Under the 30% incidence reduction scenario, the prevalence of diabetes will be 28.6% in 2050. Comparing the no-intervention scenario with the 30% and 60% diabetes incidence reduction scenarios, we estimate a total of 816 320 and 1.6 million annual averted cases of diabetes, respectively, for the year 2020.
Discussion Our study underscores the importance of diabetes as a disease by itself and also the potential healthcare demands and social burden of this disease and the need for policy interventions to reduce diabetes prevalence.
- general diabetes
- diabetes & endocrinology
- health economics
- public health
This is an Open Access article distributed in accordance with the Creative Commons Attribution Non Commercial (CC BY-NC 4.0) license, which permits others to distribute, remix, adapt, build upon this work non-commercially, and license their derivative works on different terms, provided the original work is properly cited and the use is non-commercial. See: http://creativecommons.org/licenses/by-nc/4.0/
Statistics from Altmetric.com
Strengths and limitations of this study
The study is the first in Mexico using national representative longitudinal individual data to project the prevalence of diabetes among older adults in Mexico.
The study uses an adapted version of the Future Elderly Model (FEM), a demographic and economic simulation model designed to project the future costs and health status of the elderly based on their recent past and current health status and taking into account a broad set of risk factors.
Our simulations estimate the potential savings to the healthcare system from reductions in diabetes incidence/prevalence and hence in the total population with diabetes.
The limitations are related to the nature of the data from the Mexican Health and Aging Study, since the analysis is based on self-reported data and may underestimate the prevalence of diabetes. The FEM is using only two waves of information to estimate the disease transitions, and this could have an impact on the reliability of results.
Introduction
Diabetes represents a major health problem and a significant burden on healthcare systems and societies overall. This is particularly the case in countries like Mexico, where the prevalence of diabetes among the population 20–79 years old was 15.9% in 2011. This was the highest in the The Organisation for Economic Co-operation and Development (OECD)1 and ranked number 9 worldwide.2 According to the national estimates in Mexico, the self-reported prevalence of diabetes among the population aged 60 and older was 24% in 2012, and in the period between 2000 and 2012, the prevalence doubled among those aged 70 and older from 10% to 20%, and among those aged 60–69 the prevalence grew 1.5 times, going from 18% to 26%.3
Population ageing and the growing prevalence of diabetes raise concerns about the increased burden on social, health and family systems because of the known consequences of this disease. People with diabetes may experience additional health complications,4 5 greater social needs,6 loss in productivity and earnings7 and diminished quality of life.8 9 Moreover, in 2012, diabetes was the leading cause of mortality in the Mexican adult population, accounting for 17% of all deaths.10 It is also the leading cause of premature withdrawal from economic activity, blindness and renal failure.11 Diabetes has a direct impact on overall life expectancy and on the quality of life of the older adult population.
A key risk factor associated with diabetes is high body weight,12 as obese or overweight individuals are more likely to become diabetic.13 Estimates from the 2012 National Health Survey in Mexico reveal that 41% of adults aged 30–49 were overweight, 37% obese and 79% had abdominal obesity14; figures are similar for those aged 50 years and older.3 Furthermore, obesity is projected to increase across all age groups, with serious implications for diabetes patients and for the Mexican healthcare system.2
From a public policy perspective, it is important to take a glance into the future burdens and understand how the prevalence of diabetes will change over the next decades. Moreover, since there are health interventions that have proven to be effective in reducing the onset and management of the disease, it is important to understand how current and potential new policies, particularly those designed to prevent or ameliorate the rise of chronic diseases, may alter the diabetes trends. For sure, the future prevalence of diabetes will be influenced by the momentum of population ageing, the trends in obesity and the patterns of medical advances, among other factors. Thus, we estimate the future cases of diabetes among older adults in Mexico, assuming the current patterns of risk factors and behaviours, as well as the likely trends if hypothetical preventive interventions are adopted to reduce the onset of new cases.
One way to assess the future burden of the disease is to use microsimulation models. Projecting the prevalence of diabetes, the number of individuals with diabetes in the population and the consequences for the healthcare system in terms of healthcare needs can be useful for public health policy-makers to raise awareness of the potential consequences of varying paths that the burden of diseases can take and possibly designate resources to prevent cases. Microsimulation has been used as a tool for social science research and policy analysis15 and can be used to evaluate the impact of interventions under alternative scenarios.16 Such scenarios often rely on information from clinical trials where evidence strongly supports the ability to prevent or delay the onset of a disease. For example, a systematic review of the literature concludes that a variety of interventions can help reduce the onset and improve the management of diabetes in a diversity of country settings. This review takes into account the costs involved as well.17 Specifically for the USA, the Diabetes Prevention Program (DPP) was a multicentre randomised clinical trial that demonstrated that weight loss through dietary changes and more physical activity could prevent or delay onset of type 2 diabetes, resulting in 58% reduction in the incidence of diabetes. The DPP also showed that use of a generic oral diabetes drug (metformin) reduced the incidence of disease among at-risk individuals by 31%. Thus, for the purposes of this paper, we consider the future prevalence of diabetes if it were possible to adopt hypothetical public health interventions that reduced the incidence of diabetes on a scale up to the results shown by the DPP.18 We selected these results for simulation of the scenarios, with the caveat that these results might not perfectly apply to Mexico. We are assuming average effectiveness of national-level interventions, which may be difficult to achieve, but the assumed scenarios can help policy-makers understand the impact on the burden of diabetes if these various levels of prevention could be achieved, including the projected burden should no intervention be adopted.
The goal of the study was to estimate the future prevalence of diabetes among Mexico’s older adults to assess the current and future health and economic burden of diabetes. We estimate future levels of diabetes under different scenarios for the population aged 50 years and older in Mexico. Where hypothetical interventions to be implemented to reduce the incidence of diabetes, the two main questions we answer are: how much would the prevalence of diabetes change? And how would the healthcare burden of diabetes diminish in terms of medical resources to treat the disease?
To address these questions, we modelled the trajectory of future diabetes in Mexico from 2012 to 2050 using a microsimulation model, the Future Elderly Model (FEM). We construct four scenarios for the projections, estimating the effect of reducing 2-year diabetes incidence rates by 0%, 10%, 30% and 60%. We selected the scenarios based on evidence from clinical trials, with effects from as large as that in the clinical trial setting to more attenuated. The microsimulation model takes into account the current prevalence, the estimated new cases of diabetes (incidence) among those aged 50 and older in each 2-year period, the deaths among the group 50 and older in each 2-year period and the prevalence among the new population entering the group 50 and older in each 2-year period in the future.
Using information on what can be achieved by implementing proven interventions helps us to construct different scenarios that reflect realistic results of adopting these interventions. Combining results from clinical trials, past trends based on national health surveys and individual characteristics from the Mexican Health and Aging Study (MHAS) could lead to stronger conclusions about the future of diabetes in Mexico.
Methods and data
The FEM is a demographic and economic simulation model, originally designed to project the future costs and health status of the elderly based on their current health status and taking into account a broad set of risk factors.19 In contrast to projection models that use aggregate measures of health traits for a population cohort, the FEM uses information on how individual health characteristics change at the individual level using longitudinal survey data.20 Details on the FEM have been described elsewhere.21
The individual level data comes from the MHAS, a prospective survey of a nationally and urban–rural representative sample of adults aged 50 years and older residing in Mexico in 2001.22 From its inception, the MHAS was designed to be highly comparable to the US Health and Retirement Study (HRS). The MHAS content includes health in multiple domains, health behaviours and risk factors, socioeconomic conditions, work history, health insurance, health expenditures and family background, among others. A next-of-kin module gathers information on deceased study participants. We used three waves of available data: 2001, 2003 and 2012. A refresher sample of individuals aged 50–61 was added in 2012, to once again represent the population aged 50 and older in 2012.
For our purposes, FEM-Mexico uses two main modules of the FEM developed for the USA (FEM-US). The first produces individual trajectories, that is, 2-year transitions and estimates incidence for a number of health conditions and disability statuses. The second module ensures that the data remain representative of the population aged 50 years and older into the future by replenishing the sample, with 50–51 year olds incorporated into the sample every 2 years.
The data used for the FEM-US and the FEM-Mexico differ in one important methodological aspect, the interwave periods. As mentioned above, the FEM was created to be used with the US HRS, a longitudinal survey collected every 2 years; MHAS has a 2-year gap between the first (2001) and second (2003) wave and a 9-year gap between the second and third (2012) wave. To overcome this methodological difference, we use the MHAS 2001 and 2003 waves to estimate health transitions and 2-year incidence, and we use the 2012 wave as the baseline to start the microsimulation. In other words, we imposed the 2001–2003 health transitions onto the 2012 MHAS population. We tested the adequacy of this approach by applying the 2001 prevalence and the 2001/2003 incidence to project the prevalence of diabetes in 2012. We then compared the estimated prevalence with the prevalence observed in MHAS 20123 and the estimates were quite similar; hence, we concluded that this approach is reasonable. These results are not shown but are provided in the technical online supplementary appendix.
Supplementary file 1
To measure diabetes prevalence, MHAS respondents were asked: “Has a doctor or medical personnel ever told you that you have diabetes or a high blood sugar level?” The equation for the 2001 to 2003 diabetes incidence was used to estimate the probability of developing diabetes, using a probit regression model with covariates measured in 2001 as follows: age (50–64, 65–74, 75+ years), gender (male, female), education (less than basic, basic, high school and college), marital status (single, married, separated/divorced, widowed), ever hypertension (yes, no), body mass index (BMI underweight/normal, overweight, obese),i smoking status (never, current, or former), physical activity in the last 2 years (yes, no), size of locality of residence (less than 100 000 inhabitants, 100 000 or more inhabitants) and health insurance (yes, no). To estimate the incidence equation, only the cases that reported no diabetes in 2001 are included in the analytical sample.
We estimated similar incidence equations using probit regression models for self-reported hypertension heart attack, lung disease, stroke and mortality; ordered probit models for smoking status (never, current, former), limitations with five activities of daily living (ADLs) (none, one, two, three or more) and four instrumental ADLs (IADLs) (none, one, two or more) and linear regression models for log (BMI). The list of variables included in the right-hand side of each equation varies depending on the theoretical relationship of the independent variables with the corresponding dependent variable.
Since FEM works as a simultaneous equations model, the parameters in one equation affect the parameters of the other equations, meaning that transitions could occur in multiple diseases in any given year of the projection. Thus, an individual could have more than one disease transition in the same year, for example, new diabetes and new hypertension. Similar to FEM-US, in FEM-Mexico, once a health condition (chronic disease) is acquired or mortality occurs, these states are treated as absorbing or permanent.
In addition, we assessed the healthcare consequences of diabetes by comparing in each one of the scenarios the number of medical visits by individuals with diabetes versus those without. We estimated an ordinary least squares equation for the number of medical visits as a dependent variable, including with/without diabetes as the main explanatory variable. MHAS respondents were asked: “In the last year, how often have you visited or consulted a doctor or medical personnel?”
To maintain representativeness of the 50-year and older population, the microsimulation model needed replenishment cohorts every 2 years. To replenish the sample, we took the sample of 50/51-year olds that were added to the sample from MHAS 2012. Then, the model applied the predicted probabilities of health transitions and the health status of the new 50/51 year cohorts to the sample of individuals in the MHAS 2012 to calculate the future health status. This process was repeated every 2 years in the projections until 2050, and then summary variables were calculated.
Since we anticipated that the new cohorts in the future are going to have different characteristics than the current ones, we calculated and applied trends for diabetes prevalence, BMI and smoking status using data on younger cohorts from an alternative source of information, the Mexican National Health and Nutrition Surveys (ENSA 2000 and ENSANUT 2006 and 2012), a series of repeated national cross-sections in Mexico. Based on the observed/predicted characteristics (education, BMI, smoking) of the younger cohorts who will enter ages 50/51 in the future, we anticipate that future 50/51-year olds will have higher prevalence of diabetes, overweight and obesity and also higher education than the current 2012 cohort. These trends are not shown but are available from the technical online supplementary appendix.
We implemented the FEM-Mexico simulation by loading the 50+ MHAS population in 2012, then applying the 2-year transition models for mortality and incidence of health conditions (diabetes, other comorbidities, ADLs, IADLs, BMI and smoking status) with Monte Carlo decisions to calculate the new states of the population every 2 years. We estimated the total population by adjusting for immigration and mortality forecasts using data from the Mexican National Population Council projections and added the new 50/51-year olds to the simulation every 2 years. Finally, summary variables were computed.
We simulated four scenarios for the projected diabetes prevalence rates among the population 50 and older through 2050. We adopted these scenarios to estimate the potential benefits of prevention programme20 according to the results from Gregg et al 23 about the efficacy of alternative interventions, for example by changing lifestyle and using prescription drugs: (1) Status quo or no intervention. This scenario assumes that the current trends will continue, that is, current rates of for example, smoking, obesity, other diseases, will continue unchanged; (2) 60% reduction in the incidence of diabetes starting at age 50 in 2014, assumed for every cohort entering age 50 in the future. According to the DPP, an intensive lifestyle intervention and medication (eg, metformin) among high-risk cases could reduce the incidence of diabetes by 60%; thus we simulated a scenario under such assumption; (3) 30% reduction in 2-year diabetes incidence, assuming that older adults receive a structured lifestyle intervention at the national level starting at age 50 in 2014; (4) a modest 10% reduction in 2-year diabetes incidence also starting at age 50 in 2014. The scenarios assume that environmental and economic policies are implemented to reduce diabetes risk factors starting at age 50, that, among the entering cohorts, but that the interventions impact the behaviours of all age groups starting in 2014.
The resulting number of diabetes cases for each scenario are used to estimate the consequences of future diabetes in terms of healthcare resources. We obtain a gross estimate of the total number of medical visits for patients with and without diabetes and applying the cost of a medical visit, we calculated the corresponding total healthcare cost. In the results section, first we present the descriptive characteristics of the 50 years and older population in 2012, the starting period of the simulations. Next, we present the incidence of the health conditions between 2001 and 2003, as well as the marginal effects of the covariates for each of the equations but with a special focus on the diabetes equation and diabetes as a covariate in other equations. Finally, we present a summary of projected values for a selection of years between 2012 and 2050.
Results
Table 1 presents descriptive statistics using information just from MHAS. In 2012, there were approximately 20.7 million persons aged 50 and older in Mexico; of these, 19.3% had been diagnosed with diabetes, 37.9% with hypertension and the prevalence for each of the other diseases (heart attack, stroke, lung disease and cancer) was less than 5%. The percentage of the population reporting difficulty in performing at least one ADL and IADL was 12.8% and 8.9%, respectively, and the percentage of the population reporting difficulty in performing at least one of either ADL or IADL was 16.6%. Of the total population aged 50 and older, 35.1% had normal weight, 42.8% were overweight and 22.0% were obese. The average age was 62.6 years, 46.9% were men and 53.1% women; almost half of the 50 years and older population reported less than basic schooling (0–5 years) and 1 in 10 had at least some college degree; 70% were married and 15.4% were widowed, with important differences by sex.
Characteristics of the population 50 years and older MHAS 2012
The 2001–2003 diabetes incidence was 4.3% and the factors significantly associated with the onset of diabetes were: education, hypertension and BMI. Higher education was associated with lower probability of having a new case of diabetes. However, this likelihood increased by 1.5% for those with hypertension, 0.8% for those living in urban environments, 1.4% for the overweight and 2.7% for the obese population. As a predictor in the equations for other diseases and health outcomes, diabetes had significant effects, increasing the 2-year probability of death by 2.1% and the 2-year incidence of the following: hypertension by 3.4%, a heart attack by 0.7% and a stroke by 1.0% (see table 2).
Incidence equations for mortality, chronic diseases, smoking status and BMI for the population 50 years and older, FEM-Mexico 2001–2003 (marginal effects)
Projection of prevalence of diabetes, total population and number of medical visits by simulation scenarios, population 50 years and older, FEM-Mexico simulation 2012-2050
Regarding the results of the four simulated scenarios, table 3 provides baseline estimates from MHAS information (2012) and the projections for the years 2020, 2030, 2040 and 2050 of the prevalence of diabetes (see also figure 1), the total population, the total number of medical visits per year, the number of individuals with diabetes and the number of cases averted in comparison to the no-intervention scenario. The no-intervention scenario shows that the population 50 years and older is projected to increase from 20.7 million in 2012 to 48.0 million in 2050 and the prevalence of diabetes from 19.3% to 34.0%. Under the scenario of 30% reduction in 2-year diabetes incidence, the total population is projected to increase to 48.6 million in 2050 and the prevalence of diabetes will be 28.6%. The projected reduction in the prevalence of diabetes is 5.4 points and in mortality 552 000 more survivors. An intermediate and perhaps more plausible scenario is the 10% reduction in 2-year diabetes incidence. In this scenario, the population in 2050 will be 48.2 million and the prevalence of diabetes will be 32.3%, a 1.7 point reduction of the prevalence when compared with the no-intervention scenario. The 60% diabetes incidence reduction could lead to a 22.8% prevalence of diabetes in 2050 and 49.2 million individuals aged 50 and older.

Diabetes prevalence for scenarios of diabetes incidence reduction, population aged 50 and older, FEM-Mexico 2012–2050. FEM, Future Elderly Model.
The average age of death for the population was 75.3 years in 2012. According to the projections of the FEM-Mexico under the no-intervention scenario, the average age at death was 76.7 years in 2050, 76.8 for the scenario of 10% diabetes incidence reduction, 77.0 years for the 30% diabetes incidence reduction scenario and 77.3 years for the 60% reduction scenario.
We turn now to the economic consequences of diabetes. Since the MHAS has no data available for the average annual cost by disease, we used a rough approximation from two other sources to gauge the difference in cost related to the presence or absence of diabetes. For Mexico and according to Rodriguez-Bolaños,5 in the Mexican Institute of Social Security (IMSS), the annual cost for a patient with diabetes was US$3193 dollars. On the other hand, the New York State Diabetes Prevention and Control Program estimates that the average cost of a patient with diabetes is 3.5 times greater than for someone without the disease.22 We applied this ratio and obtained an average cost for a patient without diabetes in Mexico of US$912 per year.
Based on this average healthcare costs of the population with and without diabetes, using the projected population from the hypothetical scenarios in each group and assuming that the healthcare cost ratio between the two population will remain constant over time, we estimated the individual average yearly healthcare cost for the years 2012 and 2050. For example, in 2012, the total healthcare cost for the population with diabetes was US$12 802 million (4.0 million×US$3193) and was US$15 247 million (16.7 million×US$912) for the population without diabetes. Adding these two amounts, we calculated US$28 049 million in total healthcare cost for the total population. The individual average yearly cost for 2012 was US$1353, obtained by dividing the total healthcare cost by the total population (US$28 049/20.7 million). If we estimate the average healthcare cost at the individual level for the year 2050, in the no-intervention scenario it would be US$1663 dollars; in the 10% diabetes incidence reduction scenario, it would be US$1624 dollars; for the 30% reduction, it would be around US$1544 dollars; and for the 60% reduction, the average healthcare cost per individual would be US$1416 dollars (see table 4). If we multiply the individual average healthcare cost by the total population, the annual savings can be obtained by comparing the result to the no-intervention scenario, representing US$1593 million for the 10% diabetes reduction scenario, US$4849 million for the 30% reduction scenario and US$10 190 million for the 60% diabetes incidence reduction scenario.
Projection of total population, percentage and healthcare cost by diabetes status, population aged 50 and older, FEM-Mexico simulation 2012–2050
We express these estimates in fiscal terms by estimating the share of the total national health expenditures that the population with diabetes represents. According to the WHO Global Health Expenditure database, the total expenditures in healthcare in Mexico was about US$28 049 million in 2012. Using figures from table 4, in 2012 the healthcare cost of the population with diabetes represents 45.6% (US$12 802 million/US$28 049 million) of the total healthcare cost. Similarly, in 2050, due to the increase in the diabetes prevalence and based on the no-intervention scenario, the healthcare cost of the population with diabetes will represent 63.2% of the total. The equivalent share for the 10% reduction scenario would be 61.4% compared with 57.3% share under the 30% reduction scenario, and for the 60% diabetes incidence reduction scenario, the healthcare cost of the population with diabetes represents 49.8% of the national healthcare cost.
To supplement the information about the economic consequences of diabetes, we used MHAS data to estimate that, in 2012, the 50 years and older population on average had 4.9 medical visits a year; the average is much higher for individuals with diabetes (8.3) compared with the older adults without diabetes (annual average of 4.1). Our microsimulation estimates are that, in 2050, under the no-intervention scenario, the average number of medical visits would be 6.4 for the older population, 8.8 for individuals with diabetes and 5.2 for those older adults without diabetes and the increase is mostly related to the presence of diabetes and other health conditions, for example, hypertension.
If we compare the total number of medical visits in each year of the projection for the no-intervention scenario versus the 10% reduction in 2-year diabetes incidence, we cannot find a large difference. However, if we examine the cumulative number of avoided medical visits from 2012 to 2050, the perspective is quite different. In 2012, a medical visit in the IMSS costs 559 pesos (US$35).5 With the projection results, and assuming that this cost per visit remains the same in constant terms, we can roughly compare the no intervention with the 30% incidence reduction scenario. We estimate 49.2 million avoided medical visits from 2012 through 2050, which represents US$2047 million in savings. Similarly, we estimate 547 543 avoided medical visits between 2014 and 2016, representing US$10.4 million dollars in savings (data not shown).
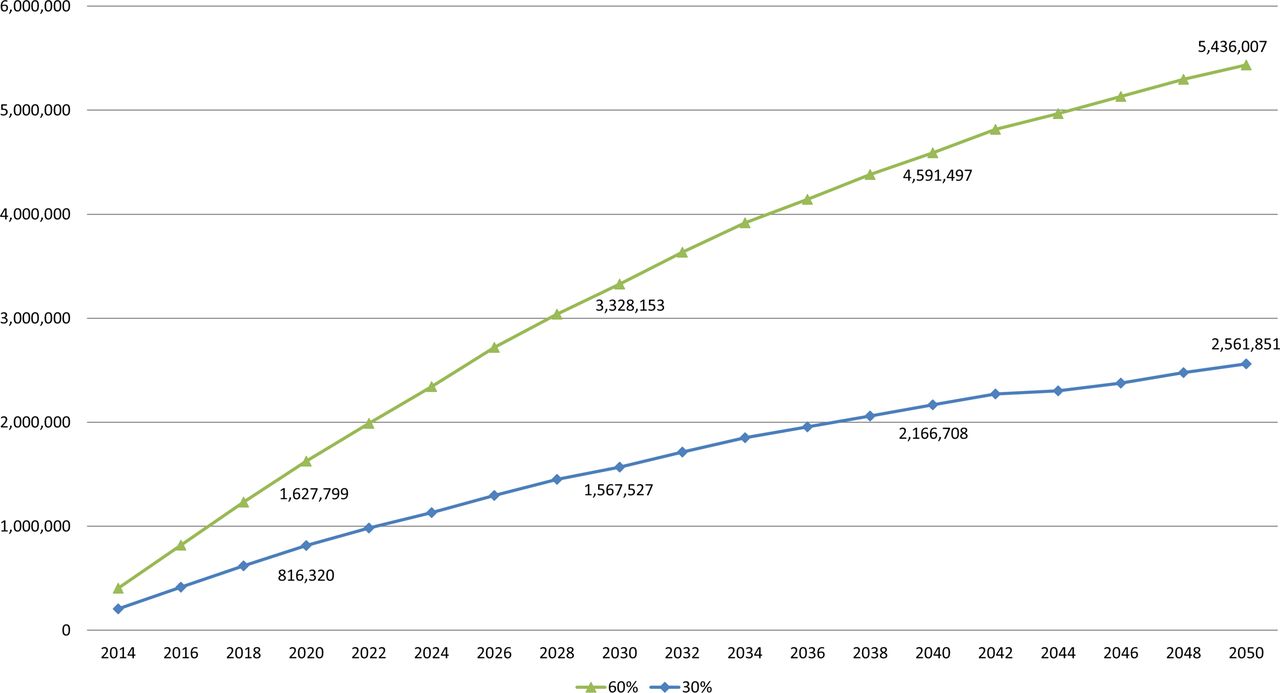
Similarly, we estimate the number of cases that could be averted if we could reduce the incidence/prevalence of diabetes. When comparing the no-intervention scenario to the 30% diabetes incidence reduction scenario (with, say, lifestyle modification), we calculate for the year 2020, a total of 816 320 annual averted cases of diabetes, and for the year 2050, 2.5 million. If we compare no intervention with the 60% diabetes incidence reduction scenario (with metformin plus lifestyle modifications), the averted cases of diabetes would be 1.6 million in 2020 and 5.4 million in 2050 (see figure 2).

Number of averted diabetes cases, no-intervention scenario versus 30% and 60% diabetes incidence reduction, FEM-Mexico. FEM, Future Elderly Model.
Discussion
In the present study, we projected the diabetes prevalence in Mexico under four scenarios of diabetes incidence reduction: no intervention and hypothetical interventions that would reduce incidence 0%, 30% and 60%. Our simulation results, from 2012 through 2050, underscore the role that diabetes plays as a disease by itself and also its role in affecting the prevalence of other diseases and health conditions, which drive a significant rise in healthcare costs. We provide estimates of the impact that a reduction in the diabetes incidence could represent for the public health system in terms of the amount of population without diabetes and the corresponding savings in healthcare costs.
The analysis of specific diabetes prevention interventions is beyond the scope of our paper, but previous authors have contributed vastly to this body of evidence. The Diabetes Prevention Program and other research studies using medical trials had found that interventions to reduce the incidence of diabetes could delay the onset of the disease and reduce its prevalence by 10%–60% depending on the duration of the interventions and the strategies used, ranging from lifestyle changes to prescribed drugs or a combination of both. We choose to apply the results from the DPP to the FEM-Mexico scenarios because the programme focuses on lifestyle modification and Mexico is promoting public policies to change diet and increase exercise among the population; also, the DPP recommended the use of metformin, a drug proven to delay the onset of diabetes, whose low cost makes it applicable in Mexico. This body of research suggests that public policies could focus on lifestyle modification, weight loss and increased physical activity to prevent or delay diabetes.24 These clinical trials have identified the variety of interventions and the heterogeneity of their effectiveness; the upper limit of the scenarios we used in our simulations may be difficult to achieve in clinical practice or at the population level because of the heterogeneity in the characteristics and preferences of individuals.25 Nevertheless, the evidence shows that the interventions intended to delay diabetes may result in significant savings if the cost of the intervention were less than the costs treatments. In addition, these studies highlight the importance of interventions that identify individuals at the highest risk of developing diabetes to maximise the effectiveness of interventions and minimise side effects of interventions with prescribed drugs. While personalised or tailored treatment may not be feasible for the general population as a whole, it could represent great gains if applied to certain population groups: for example, those identified at the highest risk of developing diabetes. Thus, tools to identify those at the highest risk may be highly relevant in countries with limited resources like Mexico. Also, research evaluating the cost and effectiveness of public health interventions aimed at reducing diabetes incidence should be prioritised, as without such information it is not possible at this stage to know if such interventions are likely to reduce the net future healthcare cost, and if so by how much.
Our simulations estimate the potential savings to the healthcare system from reductions in diabetes incidence/prevalence and hence in the total population with diabetes. These potential savings represent a rough estimate and may be a lower bound, since we have not considered the benefits of reducing diabetes to the families, economic productivity and the gains in quality of lives of the individuals involved. Certainly, projections such as the ones we present can serve to raise awareness about major trends with population ageing that may affect health and thus social and economic development.26 The projected scenarios illustrate the future burden of the disease if current trends continue unchanged, as well as the potential beneficial effects if interventions to reduce diabetes prevalence are implemented.
The limitations of the study are related to the nature of the data from the Mexican Health and Ageing Study. For example, the analysis is based on self-reported data and may not fully represent the prevalence of diabetes,27 and the model’s use of only two waves of information to estimate disease transitions may potentially impact the reliability of results.
The acceleration of population ageing in the coming decades will play a key role in the burden of the disease,4 as older adults are more likely to develop diabetes than younger adults and mortality among people with diabetes is declining. These two factors, combined with better technology to manage the disease, may increase the prevalence of diabetes and the years spent with the disease. Obesity trends are also important. The current epidemic of obesity in Mexico implies that the healthcare system needs to quantify the future high cost of the status quo. Our estimates show that, if left unchanged, the prevalence of diabetes will reach unprecedented growth by 2050. Thus, diabetes is projected to be one of the major challenges for the Mexican ageing society, given its prevalence, the associated risk factors, the genetic predisposition of the Mexican population, the high cost of healthcare and family care for the disease and other economic and health consequences. We hope to have contributed to the knowledge of the potential trends and benefits of diabetes prevention and control interventions that can begin now, and that this information can prove to be of assistance to decision makers.
References
Footnotes
↵ i Underweight/normal is defined as a BMI lower than 25, overweight is defined as a BMI between 25.0 and 29.9 and a BMI of 30 or higher is considered obese.
Contributors CG-G, BT, RW and DPG made substantial contributions to the conception and design of the paper. BT assisted with analysis and interpretation of data for this manuscript. CG-G analysed the data and drafted and revised the paper. RW, BT and DPG revised the draft paper critically for important intellectual content. All authors approved of the final version to be published. CG-G is the guarantor.
Funding Research reported in this publication was supported by the National Institute On Aging of the National Institutes of Health under Award Numbers P30AG024968 and R01AG018016. The content is solely the responsibility of the authors and does not necessarily represent the official views of the National Institutes of Health.
Competing interests All authors have completed the ICMJE uniform disclosure form at www.icmje.org/coi_disclosure.pdf (available on request from the corresponding author) and declare: support from the National Institute of Aging (Grants P30AG024968 and R01AG018016); Dr. Goldman serves as a consultant to Precision Health Economics, a health care consultancy that provides services to the life sciences industry, and holds equity in its parent company, Precision Medicine Group; and no other relationships or activities that could appear to have influenced the submitted work.
Provenance and peer review Not commissioned; externally peer reviewed.
Data sharing statement The MHAS is a public use data set that can be obtained from the MHAS webpage http://www.mhasweb.org/