Article Text

Abstract
Introduction Diabetic kidney disease (DKD) accounts for the majority of increased risk of mortality for patients with diabetes, and eventually manifests in approximately half of those patients diagnosed with type 2 diabetes mellitus (T2DM). Although increased screening frequency can avoid delayed diagnoses, this is not uniformly implemented. The purpose of this study was to develop and retrospectively validate a machine learning algorithm (MLA) that predicts stages of DKD within 5 years upon diagnosis of T2DM.
Research design and methods Two MLAs were trained to predict stages of DKD severity, and compared with the Centers for Disease Control and Prevention (CDC) risk score to evaluate performance. The models were validated on a hold-out test set as well as an external dataset sourced from separate facilities.
Results The MLAs outperformed the CDC risk score in both the hold-out test and external datasets. Our algorithms achieved an area under the receiver operating characteristic curve (AUROC) of 0.75 on the hold-out set for prediction of any-stage DKD and an AUROC of over 0.82 for more severe endpoints, compared with the CDC risk score with an AUROC <0.70 on all test sets and endpoints.
Conclusion This retrospective study shows that an MLA can provide timely predictions of DKD among patients with recently diagnosed T2DM.
- diabetes mellitus
- type 2
- kidney diseases
- algorithms
- decision support techniques
Data availability statement
Data are available upon reasonable request. Data are available from the corresponding author upon reasonable request. Restrictions apply to the availability of these data, which were used under license for the current study and so are not publicly available.
This is an open access article distributed in accordance with the Creative Commons Attribution Non Commercial (CC BY-NC 4.0) license, which permits others to distribute, remix, adapt, build upon this work non-commercially, and license their derivative works on different terms, provided the original work is properly cited, appropriate credit is given, any changes made indicated, and the use is non-commercial. See: http://creativecommons.org/licenses/by-nc/4.0/.
Statistics from Altmetric.com
Significance of this study
What is already known about this subject?
Type 2 diabetes mellitus (T2DM) is a risk factor for impaired renal function due to long-term hyperglycemia and hypertension affecting kidney function, resulting in diabetic kidney disease (DKD). DKD cases have steadily increased over the last three decades and are expected to continue rising worldwide.
Most individuals with early stages of DKD either exhibit non-specific symptoms or are asymptomatic, contributing to missed diagnoses. There is a lack of accurate early risk prediction of DKD development in patients at the time of T2DM diagnosis.
What are the new findings?
We developed machine learning algorithms (MLAs) to predict risk within a 5-year time frame for DKD development at the time of T2DM diagnosis, using 1 year of prior electronic health record data.
The MLAs had improved performance compared with the Centers for Disease Control and Prevention (CDC) risk score.
How might these results change the focus of research or clinical practice?
Use of these MLAs in medical practice may help support clinicians in their decision-making. Early DKD risk prediction can facilitate intervention and improve patient outcomes for DKD.
Data used for MLAs may be automatically extracted from electronic health records. This enables broad screening and may increase identification of patients at risk of DKD, and removes the burden of manually calculating the risk assessment of DKD with current standard models, such as the CDC risk score.
Introduction
Chronic kidney disease (CKD) is a general term for describing any disorders that lead to the gradual loss of kidney function or structure.1 CKD is defined by impaired renal function and/or increased urinary albumin excretion and strongly associated with excess morbidity and cardiovascular as well as all-cause mortality,2–5 and is a common complication for patients with type 2 diabetes mellitus (T2DM).3 CKD due to diabetes is also referred to as diabetic kidney disease (DKD), or diabetic nephropathy,3 6 and accounts for the majority of increased risk of mortality for patients with diabetes.2 T2DM results in long-term hyperglycemia and hypertension, which are the main drivers behind pathophysiological and metabolic glomerular changes, and subsequent renal deterioration in DKD.7 Several studies have shown that mortality risk increases significantly in patients with glomerular filtration rate (GFR) levels consistent with CKD stages 3–5.8 9 In 1990–2012, global mortality resulting from DKD increased by over 90%.10 11 With approximately half of patients with T2DM developing kidney disease,3 the global rise in T2DM12 13 imposes a significant cost to patients as well as healthcare systems.
Although early detection of DKD may prevent its progression,14 15 routine screening is not universally feasible; this can lead to missed or delayed diagnoses. DKD diagnosis is based on measurement of renal function and albumin levels in urine along with assessment by a clinician. DKD is defined by: estimated GFR (eGFR) <60 mL/min/1.73 m2 and albuminuria/creatinine ratio >300 mg/g.16 Diabetic retinopathy may also be concurrent; more than 25% of patients develop retinopathy within 2 years of T2DM diagnosis.17 Despite that these measurements are basic clinical and laboratory measurements, screening for DKD is not uniformly implemented.4 Because individuals with T2DM have an increased susceptibility to development of DKD, it is critical for clinicians to rapidly identify those who are at high risk. Prompt and accurate risk stratification may warrant thorough examination and increased screening frequency in high-risk patients for earlier DKD identification.
Early DKD prediction could lead to therapeutic interventions and lifestyle changes, prevention of progression to higher stages, and reduction of dialysis dependency as well as costly healthcare spending.18 Risk scores19 20 and machine learning (ML)21–23 approaches have been validated for CKD progression, including the Centers for Disease Control and Prevention (CDC) CKD risk score, which is based on demographic information and pre-existing conditions.18 However, there remains a need for kidney disease prediction for patients newly diagnosed with T2DM who are at high risk of DKD development. This is critical as patients who are unaware of their high risk may be less likely to undergo routine screening, increasing their odds of missed or delayed diagnosis. We have developed ML algorithms (MLAs) for patients at the time of T2DM diagnosis to predict development of DKD within a 5-year time frame.
Research design and methods
Data source and data processing
Retrospective analysis was performed on patient electronic health records (EHRs) data extracted from a large, proprietary database representing over 700 healthcare sites across the USA between 2007 and 2020. All patient data were de-identified in compliance with the Health Insurance Portability and Accountability Act. The dataset was split into training, training validation, and hold-out testing sets (see figure 1).
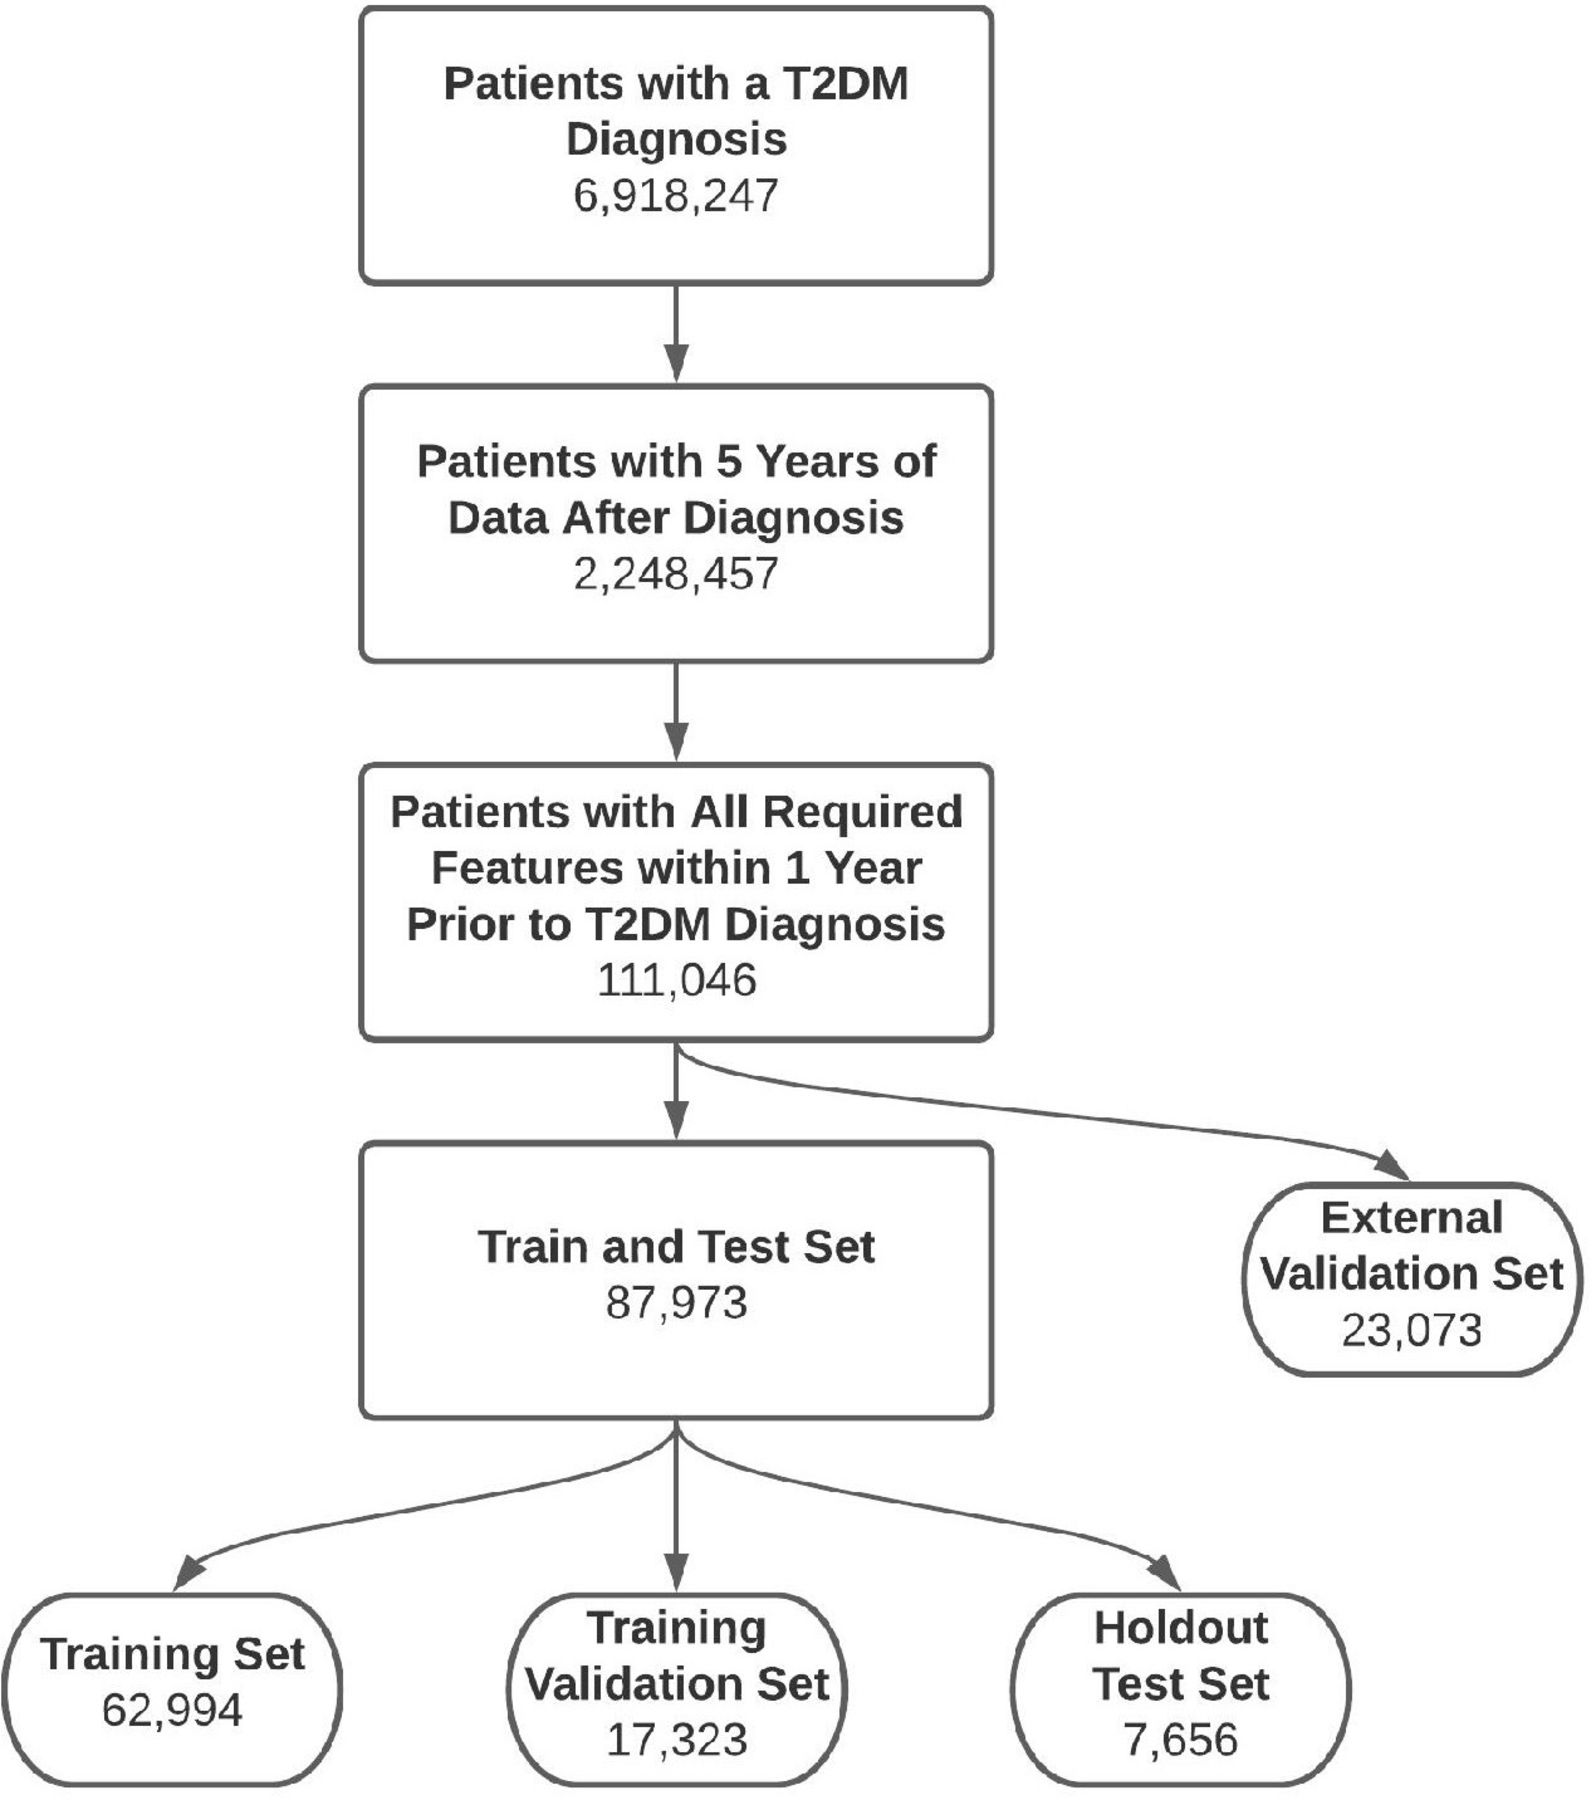
Patient inclusion diagram. Hold-out test set and external validation set both consist of patients who are not seen during training and validation of the MLAs. The external validation set consists only of patients from clinical sites that are not used in training, validation and hold-out test sets. MLAs, machine learning algorithms; T2DM, type 2 diabetes mellitus.
Algorithm models were tuned with hyperparameter optimization (HPO), fitting each hyperparameter combination on the training set and evaluating its performance on the training validation set. The hyperparameter combination which yielded the highest average precision was then used to train the final model on both training and training validation sets, as described in the Machine learning model section below. We report performance of the model on the hold-out test data (not used during the model development process) and the external validation data. The external validation data come from healthcare sites and patients separate from those used for model selection and training. Each model estimates the risk of developing DKD in the 5 years following T2DM diagnosis. Tree-based models use decision trees to build more complex ensembles, which can allow for a desirable balance of speed, complexity, and interpretability. Two variations of this model type were fitted to the data to assess different tree-based techniques, random forests (RF) and gradient boosted trees (XGB). RF fit many decision trees to the data, which combine their predictions democratically. XGB sequentially fit trees that improve on previous errors to generate their predictions.
Gold standard
All patients with T2DM were identified using the International Classification of Diseases (ICD-9 and ICD-10) codes. Within this population, patients with at least 5 years of medical data post-T2DM diagnosis, age over 18 years old, and with at least one of each required measurements in the year prior to T2DM diagnosis were included in the study (see table 1). We included patients with albuminuria or reduced eGFR at the start of the study. The positive class, patients who developed DKD within the 5 years after T2DM diagnosis, were defined by ICD codes as reported in online supplemental table 1. Patients with T2DM who did not have an associated ICD code for DKD within the 5-year window were in the negative class. Patients were excluded if they had been diagnosed with CKD or had a renal transplant before T2DM diagnosis time.
Supplemental material
Measurements used as inputs for machine learning algorithms (MLAs) and for calculating CDC risk score.
In addition to an any-stage DKD endpoint, we evaluated model performance on endpoints defined as reaching DKD stages 3–5 as well as reaching DKD stages 4–5 within 5 years following T2DM diagnosis. The endpoint for the CDC CKD risk score is stages 3–5. Patients reaching stages 4–5 require close monitoring of kidney function as well as assessment for potential kidney transplants or dialysis.
Input selection
To generate the inputs, we first conducted a comprehensive search through previous literature for CKD risk factors. This list included age, sex, diabetes, hypertension, cardiovascular diseases, smoking, obesity, age, alcohol use, cholesterol levels, white cell counts, genetic disposition, etc.24–27 We then narrowed the list of features down by what is available in the EHR. For example, genetic information and socioeconomic status, though they affect the risk of CKD, are not typically found in the EHR. Finally, we trimmed the model of features that did not significantly affect the model performance, that is, malignancy, HIV infection and triglyceride levels.
ML model
Two MLAs were developed and evaluated: an XGB (XGBoost)28 model and an RF model. The RF model was developed using the Python library Scikit-learn.29 Input features for both models consisted of demographics, clinical measurements, laboratory values, and patient history as reported in table 1. Demographics, clinical measurements, and laboratory values were averaged over the year prior to T2DM diagnosis as described below. The eGFR was precalculated in the dataset using the following equation:  , where SCr is serum creatinine in mg/dL.30 The developed models were compared with the CDC CKD risk score based on pre-existing conditions and demographic information.31 HPO was performed using the Python library Hyperopt32 for all models except the CDC CKD risk score, which does not require training.
The non-external data were split into training, training validation, and test sets with a 50:25:25 split. HPO was performed by fitting the model on the any-stage training data, then testing on the any-stage training validation data. The combination of hyperparameters which yielded the highest area under the precision-recall curve on the any-stage training validation data was then used to test on the hold-out testing data and the external validation data. The other endpoints of stages 3–5 and stages 4–5 kidney disease were also tested on the hold-out and external validation dataset, but were not used during model training. Hyperparameters for each model can be found in the online supplemental table 2.
Input features for the models were averaged over the 1-year input time window using combinations of feature median, 5th and 95th percentiles, and last available measurement when applicable. In the RF model, features were standardized to have mean 0 and variance 1 using statistics from the training data, and missing features were imputed with the training data averages. The XGB model assesses missing values as inputs and does not require feature standardization. The option to standardize and impute features was thus given as an option to be selected in HPO for XGB, but was not required (however, the final model did select standardization and imputation during hyperparameter optimization). The CDC CKD model required no imputation, as inputs are based on demographic and diagnostic information which were available for all patients.
For each endpoint, model performance was evaluated on a hold-out testing set not seen during the model training process. An additional test set from a unique source was also used for external validation of the models and endpoints. The models were assessed based on area under the receiver operating characteristic curve (AUROC), sensitivity, specificity, positive and negative likelihood ratios, and diagnostic odds ratio (DOR).
Results
A total of 6 918 247 patients with T2DM were available in our dataset. Patients were filtered based on availability of 5 years of data following T2DM diagnosis, resulting in 2 248 457 patients. The dataset was further filtered for patients who have age and required input laboratory measurements and clinical data (eg, body mass index and creatinine) available within the prior year, resulting in 111 046 patients. From this patient population, 23 073 patients from clinical sites not used in the training and testing of the MLAs were isolated and used as an external validation hold-out test set. A total of 87 973 patients were randomly split into training (62 994), validation (17 323), and test sets (7 656), where the test set consists of patients not seen by the algorithm during training and validation (figure 1).
Urinary albumin is typically used for diagnosing DKD. However, these measurements are not always available and may limit screening generalizability. Thus, our model did not use urinary albumin to make DKD predictions. eGFR was an included input feature. Before inclusion criteria were applied to our dataset, 30.96% of the patients were missing urinary albumin measurements and 11.13% of patients were missing eGFR measurements.
Demographics of both the hold-out test set and external validation set at the time of T2DM diagnosis are presented in online supplemental tables 3 and 4, respectively. Most patients in the positive class exhibiting DKD are aged 50 years and above. Most common comorbidities included hypertension, cardiovascular disease, and dyslipidemia in both the positive and negative class.
Performance of the MLA models (RF, XGB) for DKD stages 3–5 was compared with the CDC CKD scoring system. The AUROC curves are presented in figure 2, for (a) the hold-out test dataset and (b) external validation dataset, demonstrating that both MLA models outperformed the CDC CKD comparator in terms of the model’s ability to discriminate between classes. Both models also outperformed the CDC CKD comparator in terms of sensitivity and specificity on both test sets. AUROC curves for the MLA models (RF and XGB) for any-stage or stages 4–5 DKD are compared with the CDC scoring system and shown in online supplemental figures 1 and 2, respectively. For both of the other endpoints, the MLAs also outperformed the CDC risk score in terms of AUROC as well as sensitivity and specificity.

Area under the receiver operating characteristic curve (AUROC) plots of machine learning models random forest (RF) and gradient boosted tree (XGB), and Centers for Disease Control and Prevention (CDC) CKD scoring system for (A) hold-out dataset and (B) external validation dataset for prediction of DKD stages 3–5 in the 5 years following T2DM diagnosis. A random classifier was used as the baseline. CKD, chronic kidney disease; DKD, diabetic kidney disease; T2DM, type 2 diabetes mellitus.
Tables 2 and 3 summarize the performance for RF, XGB and the CDC CKD score for the hold-out test set and external validation set, respectively. XGB and RF achieved similar results in terms of discrimination and classification performance, with the RF performing more consistently across the two test sets.
Results on hold-out test set
Results on external validation set
Discussion
We have developed and evaluated ML DKD screening tools using data easily accessible in the EHR, which provide a robust method of predicting DKD within a 5-year window for patients at the time of their T2DM diagnosis. Our MLA models, which use only demographics, clinical measurements, laboratory measurements, and patient history drawn from the EHR outperform the CDC CKD scoring system. Urinary albumin is commonly used for kidney disease diagnosis, however it is not routinely collected data for all patients. Therefore, to enable screening for DKD on a broad patient population, it was not included as an input. Data for the MLAs can be automatically extracted from the EHR, removing the burden of manually calculating CKD risk assessment with the CDC CKD scoring system. These algorithms may provide warning of DKD to physicians for improved patient care by determining who is at high risk and allow for earlier detection and intervention. Routine screening for CKD is essential for those at high risk, particularly in patients with T2DM, who have a higher propensity to develop DKD. However, standard detection of early DKD in patients with T2DM is poor,33 resulting in inadequate management of disease state and higher healthcare costs. Early warning systems augment clinical expertise to enable clinicians to make improved treatment and intervention decisions. Prediction and early diagnostic methods of DKD offer a lifetime of benefits including prevention of stage progression and development of associated comorbidities, deterrence of dialysis dependency, and an overall extension of life expectancy, as well as a reduction in spending on healthcare resources.18 Additionally, early intervention could significantly improve patient quality of life as patients with CKD report disease and management affecting not only their physical health, but also mental and social health.34 As established in previous studies,20 22 35 we chose to assess DKD risk over a 5-year window to remain within a time frame that would allow improvements in outcome through lifestyle or treatment plan changes.
Previous MLA-based approaches to CKD prediction include that of Ravizza et al, who forecast CKD within 3 years of a recent diagnosis of diabetes, using 2 years of prior data.21 Their performance, which was based on a predicted outcome which included all stages of CKD, dropped from an AUROC of 0.79 to an AUROC of 0.72 when prediction was restricted to the more severe outcomes defined by Dunkler et al.36 More recently, Chan et al developed a model using EHR data along with three plasma biomarkers that achieved an AUROC of 0.77 for predicting the progression of DKD in patients with diabetes who have early DKD.22 However, early awareness and prevention is a major obstacle for DKD; thus, developing a model only for patients who are already diagnosed with DKD is a critical limitation and does not address the current clinical challenges. Moreover, the use of plasma biomarkers also poses a challenge for this method to be widely implemented, as these are not routinely screened for or part of typical EHR data. Additional testing for plasma biomarkers would increase the labor burden and cost of care. Further, several new biomarkers have been proposed for DKD diagnosis and prognosis, but enough evidence for their clinical implementation is still lacking; studies are typically performed on small cohorts and not externally validated.37 Our algorithms use 1 year of prior patient data to predict the development of DKD within the next 5 years at the time of T2DM diagnosis, and achieved AUROC values of 0.77 for any-stage DKD and 0.83 for DKD stages 3–5 on an external validation dataset. Both RF and XGB performed similarly in terms of AUROC and sensitivity/specificity. Results for the RF models were more consistent between hold-out test set and external datasets, likely due to a higher resistance to overfitting than XGB models, because RF models combine many full trees’ decisions democratically as opposed to building a single output from weak-learning smaller trees as in XGB. These results may support the use of RF models for greater generalizability across different clinical settings.
MLAs are at their best in clinical medicine when used to supplement medical expertise. Tools that inform clinicians of risk and allow their clinical judgment to be used proactively rather than reactively are highly beneficial for patient outcomes. This data-driven information, when presented to the clinician in an easy-to-use manner, can augment the use of their clinical knowledge and experience. We have previously demonstrated the utility of this approach for detecting sepsis in intensive care units.38 Additionally, we have also shown that use of ML-based techniques in healthcare may lead to considerable cost-savings.39 Development and adoption of MLA models in clinical settings may significantly improve diagnosis and treatment options for patients. The use of MLA for disease prediction and diagnosis is especially useful for diseases which would benefit from early diagnosis and intervention such as DKD.
There were several limitations to this study. First, this is a retrospective study and therefore we cannot guarantee the same performance in a clinical study. The dataset used for our models had a diverse demographic sample, yet, we cannot guarantee how it will perform in clinical settings with other patient populations. We generated the patient population with diabetes and subsets of populations with CKD based on ICD codes. Although previous studies have demonstrated that use of ICD codes to determine and classify patient populations with diabetes are highly reliable,40–43 we note that there is a possibility of bias that could arise from human error or under-reporting in ICD coding. Furthermore, although it has the potential to improve DKD risk evaluation and patient outcomes, we cannot determine how clinicians would react to the use of MLA models. Future studies should include evaluation of our MLA performance in a prospective clinical practice and assess patient outcome. This research provides interesting preliminary data and we hope to do more studies in the future to validate its use.
In this retrospective study, we have developed and evaluated MLAs for the prediction of DKD risk over the next 5 years, for patients recently diagnosed with T2DM. The MLAs use commonly available data extracted from the patient’s prior year EHR data. Our algorithm provides increased accuracy over the CDC score. MLAs may be helpful in clinical settings to enable early interventions to improve patient outcomes.
Data availability statement
Data are available upon reasonable request. Data are available from the corresponding author upon reasonable request. Restrictions apply to the availability of these data, which were used under license for the current study and so are not publicly available.
Ethics statements
Patient consent for publication
Ethics approval
This study does not involve human participants.
References
Supplementary materials
Supplementary Data
This web only file has been produced by the BMJ Publishing Group from an electronic file supplied by the author(s) and has not been edited for content.
Footnotes
AA and ZI contributed equally.
Contributors AA performed the data analysis and created the tables and figures. ZI, AG-S, JH and MH contributed to the experimental design and writing. QM and RD obtained the data and developed the project idea. QM is the guarantor for this study.
Funding The authors have not declared a specific grant for this research from any funding agency in the public, commercial or not-for-profit sectors.
Competing interests All authors who have affiliations listed with Dascena (Houston, Texas, USA) are employees or contractors of Dascena.
Provenance and peer review Not commissioned; externally peer reviewed.
Supplemental material This content has been supplied by the author(s). It has not been vetted by BMJ Publishing Group Limited (BMJ) and may not have been peer-reviewed. Any opinions or recommendations discussed are solely those of the author(s) and are not endorsed by BMJ. BMJ disclaims all liability and responsibility arising from any reliance placed on the content. Where the content includes any translated material, BMJ does not warrant the accuracy and reliability of the translations (including but not limited to local regulations, clinical guidelines, terminology, drug names and drug dosages), and is not responsible for any error and/or omissions arising from translation and adaptation or otherwise.