Article Text

Abstract
Introduction To examine how the risk of cardiovascular disease changes according to degree of change in body mass index (BMI) and low-density lipoprotein (LDL)-cholesterol in patients with diabetes using the health medical examination cohort database of the National Health Insurance Service in Korea. In comparison, the pattern in a non-diabetic control group was also examined.
Research design and methods The study samples were 13 800 patients with type 2 diabetes and 185 898 non-diabetic controls, and their baseline characteristics and repeatedly measured BMI and LDL-cholesterol until occurrence of cardiovascular disease were collected in longitudinal data. We used the variability model that is joint of mixed effects and regression model, then estimated parameters about variability by Bayesian methods.
Results The risk of cardiovascular disease was increased significantly with high average real variability (ARV) of BMI in the patients with diabetes, but the risk of cardiovascular disease was not increased according to degree of ARV in non-diabetic controls. The Bayesian variability model was used to analyze the effects of BMI and LDL-cholesterol change pattern on development of cardiovascular disease in diabetics, showing that variability did not have a statistically significant effect on cardiovascular disease. This shows the danger of the former simple method when interpreting only the mean of the absolute value of the variation.
Conclusions The approach of simple SD in previous studies for estimation of individual variability does not consider the order of observation. However, the Bayesian method used in this study allows for flexible modeling by superimposing volatility assessments on multistage models.
- type 2 diabetes
- cardiovascular disease risk
- body mass index
- cholesterol
This is an open access article distributed in accordance with the Creative Commons Attribution Non Commercial (CC BY-NC 4.0) license, which permits others to distribute, remix, adapt, build upon this work non-commercially, and license their derivative works on different terms, provided the original work is properly cited, appropriate credit is given, any changes made indicated, and the use is non-commercial. See: http://creativecommons.org/licenses/by-nc/4.0/.
Statistics from Altmetric.com
Significance of this study
What is already known about this subject?
Risk factors for cardiovascular disease are age, sex, smoking, diabetes, and obesity, and lifestyle management is important to reduce the incidence of cardiovascular disease.
In particular, weight changes in diabetics are closely related to cardiovascular disease, and there are several studies showing that risk of cardiovascular disease changes according to increase or decrease of cholesterol level.
What are the new findings?
In patients with diabetes, OR in the group with high body mass index (BMI) variability was 1.51 (95% CI 1.04 to 2.20), which significantly increased the risk of cardiovascular disease compared with the group with low variability. However, fluctuations in BMI did not affect incidence of cardiovascular disease with Bayesian variability model (
 =−0.05, p=0.273).
The risk of cardiovascular disease did not increase according to variability of low-density lipoprotein-cholesterol in both average real variability and Bayesian variability model.

How might these results change the focus of research or clinical practice?
A simple method to use the variability created by calculating statistics as a risk factor can produce false results.
Depending on the nature of the repeated measures data, the analysis method should be carefully selected.
Introduction
Cardiovascular disease is one of the major causes of death in Korea,1 and to reduce the incidence of cardiovascular disease, it is very important to know your risk factors and to prevent and/or manage them well. The concept of risk factors for cardiovascular disease began with the Framingham study in the 1960s, which noted factors of age, sex, family history, smoking, hypertension, hyperlipidemia, insulin resistance and diabetes, lack of exercise, and obesity.2 It is not clear whether obesity alone increases the risk of cardiovascular disease or whether the risk is increased by interaction of other factors related to obesity. Traditionally, however, some studies have reported that independent obesity may be linked to future cardiovascular disease.3 Treatments that lower low-density lipoprotein (LDL)-cholesterol reduce the risk of coronary artery disease, and several studies have shown that a 20%–60% reduction in LDL-cholesterol with statins reduces about 34% of coronary events over a 5-year period compared with placebo.4 In addition, patients with type 2 diabetes may experience reduced risk of cardiovascular disease when high high-density lipoprotein (HDL)-cholesterol level is maintained.5
Diabetes is a major risk factor for cardiovascular disease according to the American Heart Association, which emphasizes management of lifestyles for diabetics.6 Obesity and cholesterol are important indicators of lifestyle. Insulin resistance caused by diabetes can reduce HDL-cholesterol and triglyceride levels, which are indicative of hyperlipidemia, and consequently increase the risk of cardiovascular disease. In addition, patients with diabetes are often mildly obese, and use of regular diabetes medications except metformin contributes to weight gain.7 A study in the USA found that weight increased after the onset of diabetes, and weight control efforts were an important factor in diabetes management.8
In particular, a study on the effects of weight loss on cardiovascular disease risk in overweight and obese patients with diabetes showed that the risk of cardiovascular disease was significantly reduced by losing 5%–10% of body weight within 1 year.9 However, a Korean study found that overall risk of death and cardiovascular mortality in the increased weight group was lower than in the maintenance group.10 There is controversy over the relationship between development of cardiovascular disease and changes in weight and body mass index (BMI) in people with diabetes compared with the normal population.
The medical examination of the National Health Insurance Service (NHIS) in Korea is performed in adults and includes measurement of BMI, blood pressure, cholesterol, diabetes, hypertension, smoking, and exercise, all of which affect cardiovascular disease. Thus, analysis of these periodic and cumulative data may play an important role in predicting cardiovascular disease occurrence. If values such as BMI and cholesterol are high, or if their variabilities are rapid, we will be able to provide evidence as to whether they can affect the occurrence of cardiovascular disease.
There are some points to be aware of when observing variability in repeated measures data. In longitudinal data, the period of measurement should be considered. For example, blood pressure is high during the day and low at night. Therefore, if the blood pressure is repeatedly measured every day or night, it can be regarded as a short-term fluctuation. And since medical examination conducted by NHIS is taken every year or every 2 years, blood pressure measured at that time is a long-term change. The visit-to-visit variability refers to the degree of change in the value observed each time a patient visits a medical institution, which is also a long-term variation. In addition, it is necessary to examine whether the interval of repeated measurement points is constant or not. The number of time points for analysis is also important, but there are no guidelines on how the results of the estimates vary with the number of time points used.
The purpose of this study is to identify the pattern of changes in BMI and LDL-cholesterol by occurrence of disease in Korean patients with diabetes and the effect of variability of the two indicators on development of cardiovascular disease. In addition, we examined how biomarker change patterns affect cardiovascular disease in normal adults.
Research design and methods
Data and subject selection
In this study, we used the NHIS-Health Screening to analyze the effects of BMI and LDL-cholesterol change patterns on cardiovascular disease. This database is a cohort form of claims for medical information. The sample is randomly selected from 10% of all Koreans aged 40–80 years who had medical examination in 2002–2003. The sample size is 514 795 and includes information on health insurance, income, medical history, health medical examination results, and medical institutions in 2002–2015.
The patients with diabetes in this study were diagnosed with type 2 diabetes mellitus prior to 2003 and were defined operationally based on the International Classification of Diseases 10th Revision codes and diabetes-related medication.11 12 Patients who were non-diabetic had no diabetes-related medication use and fasting blood sugar <126 mg/dL in health check-ups. Both groups excluded subjects with diseases such as cancer, hyperthyroidism, hypothyroidism, liver cirrhosis, and renal failure that could affect changes in BMI and LDL-cholesterol. The exclusion of subjects is 4169 in diabetic and 28 300 in non-diabetic controls, and some of them had more than one disease, so it was expressed as the total number of patients. Cardiovascular disease was defined as hospitalization for cardiovascular disease, more than four outpatient visits per year, or death within 30 days of the first diagnosis. To secure the observation period for disease occurrence, cardiovascular patients before 2004 were excluded from the study. The final subjects were 13 800 patients with diabetes and 185 898 non-diabetic controls (figure 1). Among them, the rate of new cardiovascular disease in 2005–2015 was 27.7% and 6.4%, respectively, averaging 2.9% and 0.6% each year.
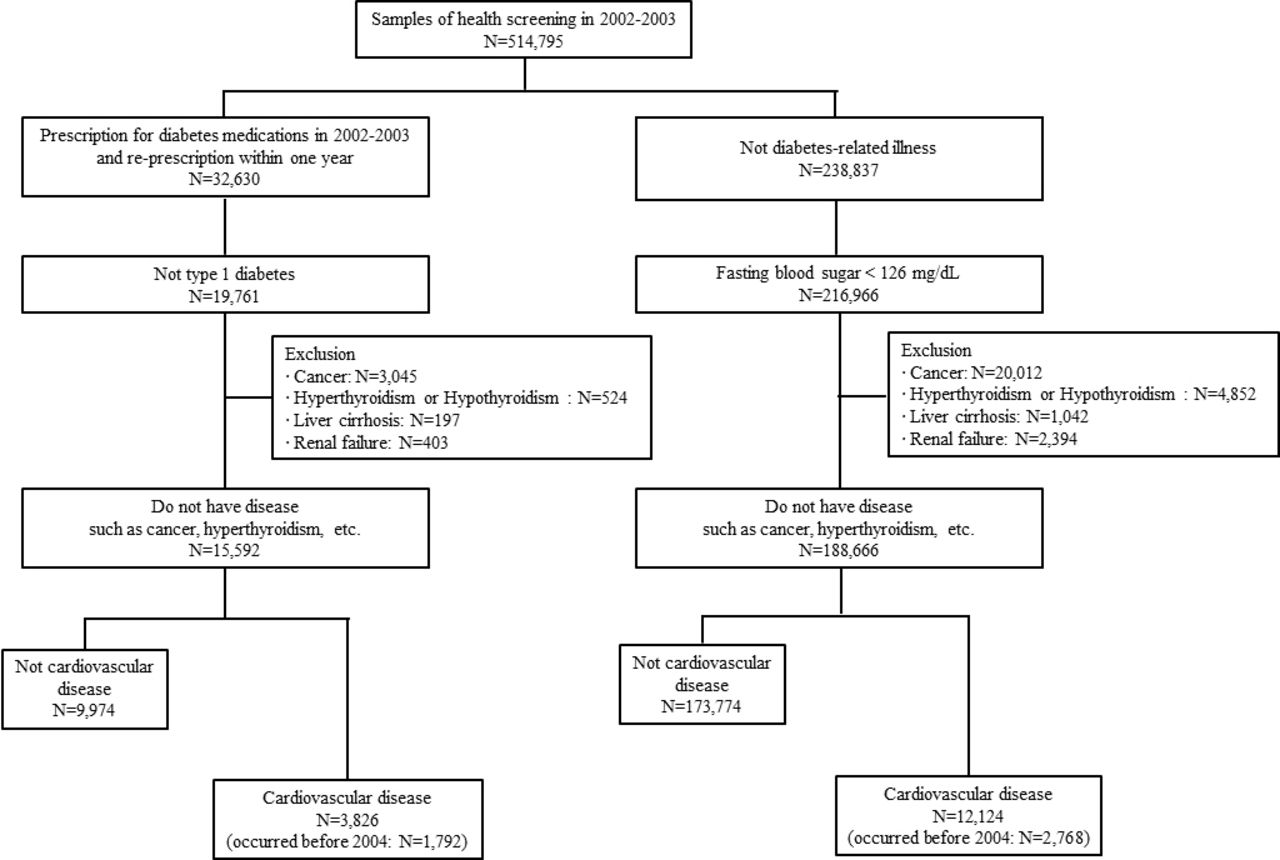
Selection of study subjects.
The selected subjects were followed to 2015 to determine the associations between repeated measures of biomarker changes and development of cardiovascular disease.
Statistical method
Since timing of cardiovascular disease occurrence and repeated examinations differ from subject to subject, an analysis considering this is essential. Using longitudinal data, changes in BMI and cholesterol are affected by previous conditions, and the relationships between confounders and exposure variables should be included in the analysis.
There are several methodologies where time-dependent covariates are included in the analysis of risk factors that affect occurrence of an event. In the traditional Cox regression model, if the baseline risk factors are long-term effect and change over time, individual time windows can be defined to calculate the risk and estimate weighted average of overall risk.13 This model is also widely used to assume a marginal structural model that homogenizes the distribution of confusion factors between exposure and disturbance variables at each time point using inverse probability of treatment weighting.14 In addition, a two-stage method using mixed effects model and time-to-event model and joint modeling are possible to estimate parameters. The methods described above do not include direct interpretation of the degree to which time-dependent covariates change over time. For example, a high cholesterol group measured repeatedly may show a higher risk of developing cardiovascular disease, but additional analysis is needed regarding risk of high cholesterol changes until the onset of cardiovascular disease.
In this study, we consider the concept of intraindividual variation as a repeated measure from baseline to event occurrence. When variability is treated as a predictor in a model, it is usually used to quantify individual SD (ISD), coefficient of variation, or root mean square of successive differences, which are simple but can provide biased results due to integration of linear effects over time.15 The Bayesian variability model was fitted including estimates of individual variability.
The Bayesian variability model is largely divided into two parts. First, intraindividual variation is modeled and estimated to explain measurement error, and then a prediction model including the estimated value is constructed. Let Y be the outcome and V be the within-person variable that includes repeated measures. The purpose of estimation is to predict the score for Y using intraindividual variation at V and, if possible, to estimate the mean of each individual in V with an additional predictor of Y.
If N individuals each have an individual mean  and an ISD
  , then the distribution of V is expressed as

where  is a gamma distribution with scale and shape parameters α and β. After estimating the ISD, we can fit it into a standard linear regression as a predictor of Y:

Two parameter vectors for latent  and
and  are related to intraindividual variability. The Bayesian variability model can be estimated using Markov chain Monte Carlo.
Results
Subject characteristics
To determine the overall pattern of changes in BMI and LDL-cholesterol in diabetic and non-diabetic controls, the mean and SE of the time point before the onset date of cardiovascular disease or the end of the study (December 2015) were calculated as shown in figure 2. As the results are compiled from yearly health medical examinations before the index date, the number of samples fluctuates because there are examinees who did not receive medical examination at each point. Although the rate of missing at each point is high based on the total number of subjects, it is not unreasonable to examine the approximate pattern since it is a missing at random. In the database of NHIS, BMI has been included since 2002 and LDL-cholesterol since 2009, so the number of time points is different. In the early 2000s, the SE at each time point was large due to the low examination rate. BMI and LDL-cholesterol levels in patients with diabetes tend to decrease gradually with approach to the index date, but general variability is greater in patients with cardiovascular disease. In addition, BMI and LDL-cholesterol of the non-diabetic control group showed similar values at each time point, although variability in cardiovascular disease was slightly larger.

Change patterns of body mass index (BMI) and low-density lipoprotein (LDL)-cholesterol. CVD, cardiovascular disease.
To observe the variability of repeatedly measured biomarkers, we selected subjects who underwent three or more total health check-ups before onset of cardiovascular disease or the end of the study. In other words, occurrence of cardiovascular disease may be observed after at least 2007, but selection bias may exist. However, analysis of biomarker variability before the index date is the main purpose of this study, and this can be excluded. Three or more check-ups were performed by 996 patients with diabetes and 27 654 non-diabetic controls, respectively, and 164 and 952 people had cardiovascular disease.
Table 1 shows the general characteristics of the study subjects; since the majority of examinees over 40 who receive regular health check-ups are employed, there was a higher proportion of men in the study subjects. There was a difference in distribution of age group between patients with cardiovascular disease and those with non-cardiovascular disease, and the proportion of patients with cardiovascular disease over 50 was higher. Smoking and exercise items had some missing data from the questionnaire. In both diabetic and non-diabetic controls, the rate of smoking was higher and there was a tendency to exercise less in patients with cardiovascular disease. In addition, BMI and LDL-cholesterol at baseline did not differ depending on the occurrence of cardiovascular disease in diabetic controls, but in non-diabetic controls, patients with cardiovascular disease had higher BMI.
Characteristics of study subject
Changes in BMI and LDL-cholesterol and cardiovascular disease
First, it was confirmed whether cardiovascular disease occurred according to degree of variability of biomarkers by multivariate logistic regression model (table 2). Average real variability (ARV) of BMI and LDL-cholesterol was calculated and classified into low and high groups based on median. The median ARV of BMI was 0.57 in patients with diabetes and 0.55 in non-diabetic controls. The median ARV of LDL-cholesterol was 18 and 17, respectively.
The effect of variability level on CVD incidence
In patients with diabetes, OR in the group with high BMI variability was 1.51 (95% CI 1.04 to 2.20), which significantly increased the risk of cardiovascular disease compared with the group with low variability. However, in non-diabetic controls, the risk of cardiovascular disease did not increase according to degree of change. OR of the high LDL-cholesterol variability was 1.37 (95% CI 0.80 to 2.34) and 1.35 (95% CI 1.13 to 1.61) in diabetic and non-diabetic controls, respectively. It suggests that risk of cardiovascular disease increased in non-diabetic controls. In addition, as is generally known, non-smoking and exercise may reduce the incidence of cardiovascular disease. When the BMI was adjusted in diabetic controls, the OR is 1.56 (95% CI 1.04 to 2.34) for smoking and 0.35 (95% CI 0.21 to 0.59) for high-intensity exercise. In non-diabetic controls, the OR is 1.41 (95% CI 1.21 to 1.65) for smoking and 0.38 (95% CI 0.31 to 0.46) for high-intensity exercise.
The results of the Bayesian variability model of patients with diabetes are shown in table 3. The intercept of BMI indicates that the average BMI is about 24. There was an individual difference in mean BMI ( =2.50), and the variability among individuals was estimated to be 7.89/9.58=0.82. However, fluctuations in BMI did not affect incidence of cardiovascular disease (
 =−0.05, p=0.273). LDL-cholesterol in patients with diabetes was about 101 mg/dL, and there was an individual difference in mean LDL-cholesterol, with an estimated 23.33 individual variability. As with BMI, change in LDL-cholesterol did not have a statistically significant effect on cardiovascular disease. Similar to the results above for ARV, the significant factors affecting development of cardiovascular disease were age, smoking, and exercise.
Variability analysis results in diabetics
Discussion
The relationships between cardiovascular disease, obesity, exercise, and nutrition have been studied in the academic community. As a result, a healthy life with monotonous reductions in weight and LDL-cholesterol has been shown to help lower cardiovascular disease. However, in diabetics who have difficulty managing weight long term, and in whom weight fluctuations are frequent, it is necessary to understand the effect of this fluctuation on cardiovascular disease.
Patients with diabetes with high ARV in BMI are thought to have a significantly higher risk of cardiovascular disease, though this is not shown in the Bayesian variability model. This shows the danger of the former simple method when interpreting only the mean of the absolute value of the variation. The majority of volatility studies only care about the degree of variation and do not consider the timing. The purpose of this study was to reduce the error of interpretation by applying a model that reflects the time point of measured values. As an alternative, a Bayesian variability model was applied. In this model, ISDs are distributed, allowing estimation of type of variation. Application of such a model requires assumptions and technical considerations. Many methods of analyzing the impact of variability on events of interest have not been developed yet. It is considered that a sensitivity analysis for the application of models is necessary.
For LDL-cholesterol, the estimation results of ARV and Bayesian variability models did not show a statistically significant effect on cardiovascular disease. It is not necessary to pay attention yet to the rapid fluctuation of LDL-cholesterol. Maintaining an adequate level of LDL-cholesterol may help prevent cardiovascular disease. Common factors affecting cardiovascular disease were age, smoking, and exercise, in line with other cardiovascular research. The incidence of cardiovascular disease increases in the elderly and smokers, and high-intensity exercise may lower the incidence of cardiovascular disease. This is true for both diabetic and non-diabetic controls.
Conclusion
An approach such as ISD for estimating individual variability does not consider the order of observation. The Bayesian method used in this study allows for flexible modeling of trends by applying variability assessments to multistage models and shows how to apply individual volatility as a predictor. Fitting the Bayesian variability model for patients with diabetes, we have not found evidence that sudden variability in BMI and LDL-cholesterol may affect the development of cardiovascular disease.
The following limitations exist in this study. Due to the characteristics of the health screening, they are measured every year, and the intervals between the measured points are too long to conduct the variability of the values. Since the number of measurements is small, from a minimum of 3 to a maximum of 11, there is a possibility of unstable estimation, and the state of glycemic control, duration of disease, and drug change. In addition, the Bayesian variability model does not include a complex model of time dependency considering only volatility. Despite these limitations, this study presented an analytical method using variability as a predictor.
There is no detailed guidance on the number of samples or repeated measurements required when applying the Bayesian variability model. It is necessary to consider the allowed magnitude of variability in model estimation. In addition, discussion of the extended concept of the volatility model as a discontinuous and non-normal distribution is left for further study.
Acknowledgments
The authors sincerely thank the staff of National Health Insurance Service (NHIS) and Ilsan Hospital for data collection.
References
Footnotes
Contributors TMY and ECP supervised the study. TMY performed the data analysis and prepared the figures and tables. TMY and MJK reviewed and edited the manuscript. SOS interpreted the data and provided clinical information.
Funding This work was supported by the National Health Insurance Ilsan Hospital grant (NHIMC 2018-01-044).
Competing interests None declared.
Patient consent for publication Not required.
Ethics approval This study was approved by the Institutional Review Board of National Health Insurance Service Ilsan Hospital (Goyang, Republic of Korea) (No NHIMC 2018-01-044).
Provenance and peer review Not commissioned; externally peer reviewed
Data availability statement Data may be obtained from a third party and are not publicly available. This study used NHIS-NSC data (NHIS-2018-2-096) made by the National Health Insurance Service (NHIS).