Article Text

Abstract
Introduction Genome-wide methylation analyses of gestational diabetes mellitus (GDM) diagnosed after 24 gestational weeks (late GDM (L-GDM)) using cord blood have been reported. However, epigenetic changes in neonates born to mothers with GDM diagnosed before 24 gestational weeks (early GDM (E-GDM)) have not been reported. We investigated DNA methylation in neonates born to mothers with E-GDM using cord blood samples.
Research design and methods Genome-wide DNA methylation analysis was performed using an Illumina EPIC array to compare methylation rates of 754 255 autosomal sites in cord blood samples from term neonates born to 162 mothers with GDM (E-GDM: n=84, L-GDM: n=78) and 60 normal glucose tolerance (normal OGTT) pregnancies. GDM was diagnosed based on Japan Society of Obstetrics and Gynecology criteria modified with International Association of Diabetes in Pregnancy Study Group criteria. In this study, all GDM mothers underwent dietary management, while self-monitoring of blood glucose and insulin administration was initiated when dietary modification did not achieve glycemic control.
Results There were no significant differences in genome-wide DNA methylation of cord blood samples between the GDM (E-GDM and L-GDM) groups and normal OGTT group or between the E-GDM and normal OGTT groups, L-GDM and normal OGTT groups, and E-GDM and L-GDM groups.
Conclusions This is the first report to determine the DNA methylation patterns in neonates born to mothers with E-GDM. Neonates born to mothers with GDM, who were diagnosed based on Japan Society of Obstetrics and Gynecology criteria, may not differ in DNA methylation compared with those born to normal OGTT mothers.
- gestational diabetes mellitus
- pregnancy
Data availability statement
Data are available on reasonable request. The data set supporting the results of this article are available in the Gene Expression Omnibus repository (GSE122086, https://www.ncbi.nlm.nih.gov/geo/query/acc.cgi?acc=GSE122086; and GSE122288, https://www.ncbi.nlm.nih.gov/geo/query/acc.cgi?acc=GSE122288https://www.ncbi.nlm.nih.gov/geo/query/acc.cgi?acc=GSE122288).
This is an open access article distributed in accordance with the Creative Commons Attribution Non Commercial (CC BY-NC 4.0) license, which permits others to distribute, remix, adapt, build upon this work non-commercially, and license their derivative works on different terms, provided the original work is properly cited, appropriate credit is given, any changes made indicated, and the use is non-commercial. See: http://creativecommons.org/licenses/by-nc/4.0/.
Statistics from Altmetric.com
Significance of this study
What is already known about this subject?
The intrauterine environment in maternal gestational diabetes mellitus (GDM) is reportedly associated with changes in fetal DNA methylation.
What are the new findings?
There was no significant association between cord blood DNA methylation values and GDM group compared with that in the normal oral glucose tolerance test (OGTT) group.
There was no significant association between cord blood DNA methylation values and GDM diagnosed before 24 gestational weeks (early GDM (E-GDM)) or GDM diagnosed after 24 gestational weeks (late GDM (L-GDM)) group compared with that in the normal OGTT group.
There was no significant association between cord blood DNA methylation values between cord blood DNA methylation values and the E-GDM group compared with the L-GDM group.
There was no significant difference in cord blood DNA methylation level in GDM with insulin and diet therapy group and GDM with only diet-controlled group.
How might these results change the focus of research or clinical practice?
Since we found no significant differences in umbilical cord blood DNA methylation between E-GDM or L-GDM and normal OGTT, from a methylation analysis perspective, appropriate treatment for GDM may defend fetal epigenetic changes.
Introduction
Gestational diabetes mellitus (GDM) is a common perinatal complication associated with poor prognosis during the perinatal period (ie, cesarean section (CS), shoulder dystocia, macrosomia (birthweight ≥4000 g), and neonatal hypoglycemia or jaundice) and the next generation’s future healthcare (ie, obesity and metabolic syndromes).1–3 In recent reports on GDM diagnosed after 24 gestational weeks (late GDM (L-GDM)), epigenetic modifications associated with maternal hyperglycemia were assumed to mediate the susceptibility to metabolic disorders in offspring. The intrauterine environment in maternal GDM was reportedly associated with changes in fetal DNA methylation at CpG (5'-Cytosine-phosphate-Guanine-3) sites in metabolic genes.4–12 Based on these studies, the mechanisms of future metabolic syndrome and obesity development were evaluated from an epigenetic perspective. However, these studies were based on small cohorts and did not characterize the maternal glycemic status during pregnancy nor provided detailed fetal/neonatal information.
GDM has been diagnosed and managed before 24 gestational weeks (early GDM (E-GDM)) in Japan.13 While it was reported that effectiveness of therapeutic intervention for E-GDM was lower than that for L-GDM,14 recently, the importance of treatment for E-GDM is becoming increasingly recognized.15 Because women with E-GDM show higher frequencies of preterm birth than those diagnosed with L-GDM, and often exhibit poor prognosis (ie, pre-eclampsia, CS, admission to neonatal intensive care units, macrosomia or large for gestational age (birthweight ≥90th percentile) and neonatal jaundice).16–19 However, it is not known how therapeutic interventions for E-GDM affect epigenetic change in offspring.
The aim of this study was to investigate genome-wide methylation in cord blood from offspring born to mothers with GDM, particularly those mothers with E-GDM, through DNA methylation analysis.
Materials and methods
Study population
Umbilical cord blood samples were collected from single-term neonates born to Japanese mothers with GDM (n=167) or normal glucose tolerance (normal oral glucose tolerance test (OGTT); n=63) and who received perinatal care at Keio University Hospital (Tokyo, Japan) from January 2011 to December 2016. In our hospital, as described in our previous report, women who screened positive for GDM in the first trimester had at least one of the following criteria: random plasma glucose level ≥95 mg/dL, hemoglobin A1c ≥5.9%, glycoalbumin ≥15.8%, a personal history of GDM or macrosomia delivery, family history of type 2 diabetes, or prepregnancy body mass index (BMI) ≥25 kg/m2. When patients were positive for E-GDM screening, they immediately underwent a 75 g OGTT to diagnose E-GDM.15 As a two-step procedure to diagnose L-GDM is used in Japan, women who screened negative or had normal OGTT results in the first trimester were also evaluated by a 50 g glucose challenge test at 24–28 gestational weeks. If the glucose challenge test result was positive (≥7.8 mmol/L (140 mg/dL)), the mothers immediately underwent the diagnostic 75 g OGTT. According to the additionally modified International Association of Diabetes in Pregnancy Study Group (IADPSG) criteria by Japan Society of Obstetrics and Gynecology, E-GDM and L-GDM were diagnosed when a pregnant woman exceeded one or more of the following thresholds: fasting plasma glucose (FPG) of 92 mg/dL, OGTT 1-hour plasma glucose (PG) of 180 mg/dL, OGTT 2-hour plasma glucose of 153 mg/dL. Each subject was diagnosed based on the OGTT, and all mothers with GDM underwent dietary management and self-monitoring of blood glucose measurements at our institution, with evaluations performed every 2 or 3 weeks. Insulin administration was initiated when dietary treatment did not achieve the glycemic goal. In this study, women who screened as negative for OGTT at 24–28 gestational weeks were defined as the normal OGTT group.15 Exclusion criteria included multiple pregnancies, preterm birth (gestational age at delivery <37 weeks), fetal growth restriction, hypertensive disorder during pregnancy, neonatal asphyxia (umbilical artery pH <7.1 or Apgar score at 5 min <7), and congenital fetal anomaly. Additionally, we excluded women with diabetes mellitus (ie, type 1 or 2) before pregnancy and overt diabetes during pregnancy, with the latter defined as hemoglobin A1c >6.5%, FPG ≥126 mg/dL, or random PG level ≥200 mg/dL and requiring confirmation by one of the first two measures. Insulin sensitivity and secretion were evaluated based on parameters calculated using the diagnostic 75 g OGTT. The insulin sensitivity was evaluated using a whole-body insulin sensitivity index derived from the OGTT (ISOGTT) and homeostasis model assessment of insulin resistance (HOMA-IR).20 21 Insulin secretion was assessed based on the insulinogenic index,22 and beta-cell function was calculated as the OGTT-derived disposition index using insulin secretion sensitivity index (ISSI) 2.23
DNA methylation analysis using umbilical cord blood samples
The methods of DNA methylation analysis was described in our previous report.24 Umbilical cord blood was collected from each neonate immediately after birth. Genomic DNA was extracted using the QIAsymphony DNA Midi kit (Qiagen, Hilden, Germany), followed by bisulfite treatment using the Zymo EZ-96 DNA methylation kit (Zymo Research, Irvine, California, USA). Genome-wide DNA methylation status for >850K CpG sites was analyzed using the Infinium MethylationEPIC BeadChip array (Illumina, San Diego, California, USA). Methylation data were acquired using the iScan system (Illumina) as idat files and processed by the minfi and ChAMP packages (https://bioconductor.org/biocLite.R) in R (V.3.4.0; www.R-project.org). The background was corrected using the NOOB method in the minfi package.25 Corrected data were normalized by BMIQ in the ChAMP package (V.2.8.9).26 The manifest file was annotated using ‘IlluminaHumanMethylationEPICanno.ilm10b2.hg19’. We removed 11 800 probes with detection p values >0.01 in at least one sample, 3125 probes with a bead count <3 in at least 5% of samples and 2894 non-CpG targeting probes. Additionally, we filtered 17 124 probes located on either the X or Y chromosome, 49 multihit probes,27 and 77 589 single-nucleotide polymorphism-related probes using ChAMP.28 This yielded 754 255 autosomal probes from 230 samples. We used the beta value (β) for our analysis, representing the ratio of the methylated probe intensity and overall intensity (sum of methylated and unmethylated probe intensities). The cell composition of each cord blood sample (ie, ‘Bcell’, ‘CD4T’, ‘CD8T’, ‘Gran’, ‘Mono’, ‘NK’, and ‘nRBC’) was analyzed using ‘FlowSorted.CordBlood.450k’ in the minfi package.29 We confirmed that the same sample had not been measured twice as clustering samples by using methylation levels of 1297 probes with a minor allele frequency of the target CpG site >0.40.30
Statistical analysis
Perinatal information was retrospectively obtained from medical records. The p value was adjusted to correct for multiple testing by controlling the expected proportion of false-positives among all discoveries (ie, false discovery rate) using the Benjamini-Hochberg method. Multiple testing were performed using the false discovery rate method, and thresholds of 0.05 and 0.01 were compared. Data are presented as the median (range) or number of cases (percentage). Continuous data were compared between groups using the Mann-Whitney U test. Categorical variables were analyzed using the χ2 test or Fisher’s exact test. The trend for the number of abnormal values during OGTT was analyzed by Cochran-Armitage trend analysis. All tests were statistically analyzed by JMP software (V.15, SAS Institute), and p values <0.05 were considered as significant.
For the epigenome-wide association study, we assessed raw and normalized β values from the 230 samples using principal component analysis to exclude outliers, which resulted in exclusion of eight samples (E-GDM: n=2, L-GDM: n=3, normal OGTT: n=3) from further analysis. Robust linear regression analysis was performed to examine the associations between DNA methylation and GDM, E-GDM, or L-GDM. Furthermore, we analyzed the DNA methylation between insulin and diet therapy group and diet group in GDM mothers. Cell composition, neonate sex, maternal age, maternal pregravid BMI, and experiment plate batch were included to analyses as covariates. The p value was adjusted using the Benjamini-Hochberg method to correct for multiple testing. An adjusted p<0.05 was considered as significant.
Results
Maternal and neonatal characteristics of GDM and normal OGTT
Maternal and neonatal characteristics of the GDM (E-GDM and L-GDM) and normal OGTT groups are shown in table 1. For metabolic parameters, FPG, 1-hour and 2-hour PG, and HOMA-IR were higher in the GDM group than in the normal OGTT group (all p<0.001). However, mothers with GDM showed a lower ISOGTT and ISSI-2 relative to mothers with normal OGTT (both p<0.001), whereas no difference was observed in terms of the insulinogenic index. The median HbA1c was 5.4% (range: 4.6%–6.4%), and the median glycoalbumin (GA) was 13.1% (range: 9.7%–16.0%) at the third trimester in the GDM group. However, because none of the patients had HbA1c ≥5.8% and GA ≥15.8% at the third trimester, it was considered that the glucose levels were well controlled in all GDM patients.
Comparison of maternal and neonatal characteristics between pregnant Japanese women with GDM and normal OGTT
Maternal and neonatal characteristics of early GDM and late GDM
The maternal and neonatal characteristics of the E-GDM and L-GDM groups are shown in table 2. Regarding metabolic features, FPG, ISSI-2, and ISOGTT in E-GDM were significantly higher than those in L-GDM; however, 1 h PG, 2 h PG, and HOMA-IR in E-GDM were significantly lower than those in L-GDM. There were no significant differences in perinatal outcomes (ie, gestational week at delivery, birth weight, CS incidence, umbilical artery pH, Apgar scores, and placental weight) or in the incidence of insulin therapy during pregnancy between the groups. However, gestational weight gain in E-GDM was significantly lower than that in L-GDM.
Comparison of maternal and neonatal characteristics between pregnant Japanese women with GDM and normal OGTT
Cord blood epigenome-wide association study for GDM
In DNA methylation analysis, newborn sex, gestational age (in days), and estimated proportions of B cells, CD8 + T cells, CD4 + T cells, natural killer cells, monocytes, and nucleated red blood cells in the cord blood were included in multivariate linear regression analysis as covariates. There was no significant association between DNA methylation values and GDM compared with in the normal OGTT group (figure 1). Furthermore, in subgroup analysis, there were no significant association between DNA methylation values and E-GDM or L-GDM compared with in the normal OGTT group and between DNA methylation values and in the E-GDM group compared with in the L-GDM group (figure 2A–C). We classified the GDM group into insulin and diet therapy group and diet group and found that there was no significant difference in the DNA methylation level in each group compared with that in the normal OGTT group (figure 2D,E).
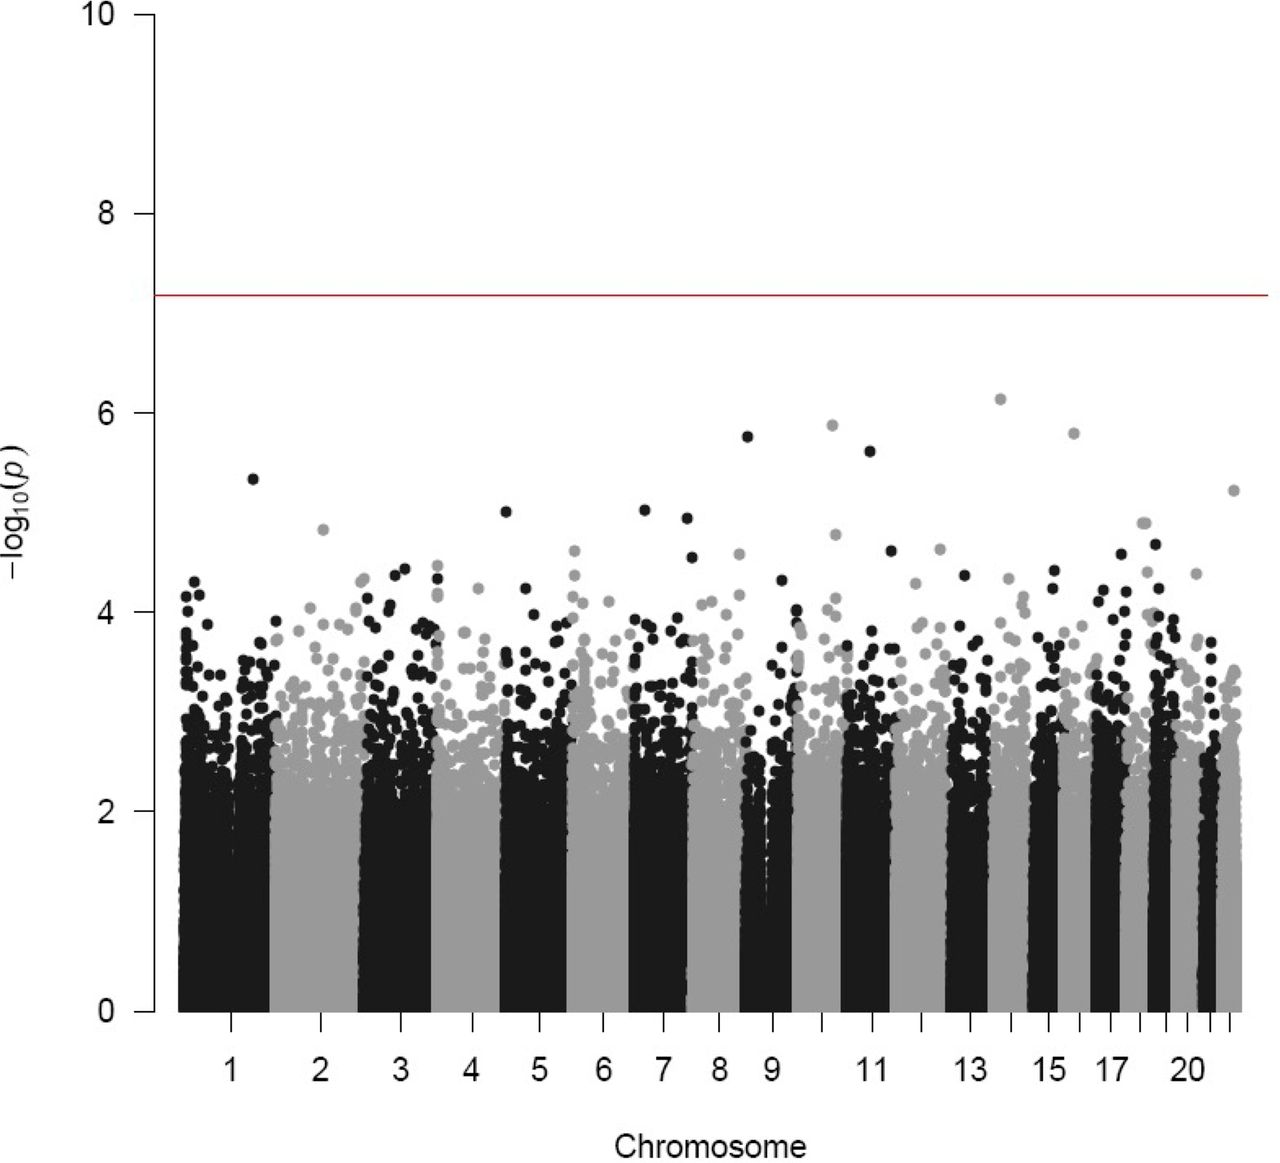
Comparison of DNA methylation between GDM and normal OGTT groups. The x-axis shows mean DNA methylation differences in GDM compared with normal OGTT, and the y-axis shows the −log10 of the p value for each CpG (5'-Cytosine-phosphate-Guanine-3) site and represents the strength of association. The color of each dot represents the p value adjusted, as shown in the scale bar. GDM, gestational diabetes mellitus; OGTT, oral glucose tolerance test.

Subgroup analysis of DNA methylation. (A) Comparison of DNA methylation between E-GDM and normal OGTT groups. The x-axis shows the mean DNA methylation differences in E-GDM compared with normal OGTT. (B) Comparison of DNA methylation between L-GDM and normal OGTT groups. The x-axis shows the mean DNA methylation differences in L-GDM compared with normal OGTT. (C)Comparison of DNA methylation between E-GDM and L-GDM groups. The x-axis shows the mean DNA methylation differences in E-GDM compared with L-GDM. (D) Comparison of DNA methylation between the insulin and diet therapy and normal OGTT groups. The x-axis shows the mean DNA methylation differences in the insulin and diet group compared with those in the normal OGTT group. (E) Comparison of DNA methylation between the diet therapy and normal OGTT groups. The x-axis shows the mean DNA methylation differences in the diet therapy group compared with those in the normal OGTT group. The y-axis shows the −log10 of the p value for each 5'-Cytosine-phosphate-Guanine-3 (CpG) site and representing the strength of association. The color of each dot represents the p value adjusted, as shown in the scale bar. E-GDM, early gestational diabetes mellitus; L-GDM, late gestational diabetes mellitus; OGTT, oral glucose tolerance test.
Discussion
We found no significant difference in umbilical cord blood DNA methylation between GDM and normal OGTT. Moreover, patients with GDM classified as E-GDM and L-GDM based on Japan Society of Obstetrics and Gynecology criteria showed no differences in the DNA methylation profiles among groups.
Epigenetic modifications associated with GDM are thought to influence the susceptibility to metabolic disorders in offspring.4–12 An overview of genome-wide methylation analyses of GDM using cord blood obtained from earlier empirical studies is shown in table 3. In all studies, epigenetic changes were detected in metabolic mechanisms-related genes; however, in those reports, the maternal glycemic state during pregnancy and fetal information were not described in detail, and the studies included small cohorts. Additionally, the criteria for diagnosing GDM differs from IADPSG criteria in many reports. In our study cohort, all mothers with GDM underwent dietary management, with self-monitoring of blood glucose and insulin administration initiated when dietary modification did not achieve glycemic control. We also excluded neonates who were born at preterm or developed neonatal asphyxia, and we adjusted cell counts based on reference data.31 Although various causes of epigenetic changes in offspring have been reported,32 33 the findings from our cohort indicate that DNA methylation in cord blood is not altered when mothers with GDM take proper precautions during pregnancy. However, the absolute methylation rates between our study and other studies were distinct (data not shown) in some candidate loci that previous studies identified as differentially methylated in GDM. For example, the average global methylation levels differed by 3%–4% between our study and that by Antoun et al.12 Furthermore, absolute methylation rates at 8 out of the top 10 differentially methylated sites between GDM and non-GDM, reported by Antoun et al12 differed by 5%–15% between our subjects and those in the study by Antoun et al regardless of the presence of GDM. These differences in absolute methylation rates between studies were also observed at six CpG sites that were identified by Howe et al34 in a meta-analysis as being differentially methylated in cord blood cells from infants born to GDM mothers. These mismatches might be a result of effects of ethnicity. Genetic variation with ethnicity may influence the effects of GDM on infant methylome. Further analysis introducing standardized methods for cell collection and data normalization could help understand accurate universal effects of GDM on infant methylome.
Overview of genome-wide methylation analyses of GDM using cord blood in published studies
According to our previous data, there were no difference in perinatal outcomes (ie, preterm delivery, hypertensive disorder of pregnancy, CS, macrosomia, and insulin therapy) between E-GDM and L-GDM,15 although others studies showed that E-GDM had poor perinatal prognosis. Moreover, when patients were diagnosed with GDM in early pregnancy and started treatment, as their gestational weight gain was limited, it was expected that fetal growth during pregnancy would be decreased. The previous reports showed that treatment of mild GDM during pregnancy did not reduce childhood obesity or metabolic dysfunctions in the offspring.35 36 Therefore, Hagiwara et al14 reported that the therapeutic interventions for E-GDM were not as effective as those for L-GDM. However, another study reported that the incidence of preterm birth in women with E-GDM who were followed up without treatment and had abnormal OGTT results at 24–28 gestational weeks was significantly higher than that in women with E-GDM who were followed up without treatment and had normal OGTT results at 24–28 gestational weeks (p=0.01).37 According to our previous report, management of E-GDM may be an appropriate option.15 In the report by Antoun et al12 using the IADPSG as a diagnostic criterion for GDM, only L-GDM diagnosed after 24 weeks of gestation was recruited. Although Antoun et al identified GDM-associated methylation changes in cord blood cells from larger populations than ours, it was revealed that there was no significant methylation changes between E-GDM or L-GDM or normal OGTT in this study. The early diagnosis and therapeutic intervention of GDM may have caused the difference in results from studies involving L-GDM, which have a longer period of no intervention from onset to diagnosis.
This study had several limitations. First, our study cohort was relatively small. According to user-friendly tool for comprehensive power estimation for epigenome wide association studies (pwrEWAS), the mean statistical power required to detect a 20% methylation difference between GDM and normal OGTT groups with our sample size was 0.779. The 2% difference that we identified at the two CpG sites is a minor difference with respect to the size of our dataset, as the statistical power to detect such difference was 0.218. However, our sample size was larger than those reported previously.4–12 In a previous report on GDM diagnosed by a single criterion, the power of the largest epigenome-wide association study was 0.143 in case of a 2% difference. Therefore, the power of our results was stronger than that of the previous report, and the present study is the largest genome-wide association study of GDM diagnosed by a single criterion. A recent large cohort study reported two upregulated genes as associated with maternal GDM;34 however, because GDM was diagnosed according to several inconsistent criteria in the previous cohort, we considered that those results may not be entirely accurate. Furthermore, we excluded neonates born at preterm or who developed neonatal asphyxia, as these factors may have affected the DNA methylation of umbilical blood samples. Therefore, our results may be more meaningful. Second, although our results were different from the previous reports that suggested epigenetic changes in the metabolic genes, we could not determine whether the difference was due to better control of GDM during pregnancy. As Asian women, including Japanese women, have impaired beta cell compensation compared with Caucasian and Hispanic women,38 39 the mechanism of GDM development might be different between Japanese and other ethnicities. Therefore, these results might reflect a condition unique to Asian patients with GDM. Furthermore, our patients were older than the patients enrolled in previous studies and the HbA1c level in the first trimester in the normal OGTT group was higher than that in the GDM group. We could not determine whether the differences in maternal characteristics affected the results or not. However, we hypothesized that categorizing and managing E-GDM and L-GDM may have had a positive impact on DNA methylation of cord blood.
Our genome-wide methylation analysis revealed no differences in the methylation level in cord blood from offspring born to mothers with GDM relative to in those with Normal OGTT among not only L-GDM but E-GDM. Further studies are required to determine whether these results are associated with long-term outcomes in offspring.
Data availability statement
Data are available on reasonable request. The data set supporting the results of this article are available in the Gene Expression Omnibus repository (GSE122086, https://www.ncbi.nlm.nih.gov/geo/query/acc.cgi?acc=GSE122086; and GSE122288, https://www.ncbi.nlm.nih.gov/geo/query/acc.cgi?acc=GSE122288https://www.ncbi.nlm.nih.gov/geo/query/acc.cgi?acc=GSE122288).
Ethics statements
Patient consent for publication
Ethics approval
This study involves human participants and was approved by Keio University School of Medicine Ethics Committee (nos. 20100154, approved 27 September 2010; 20110321, approved 9 March 2012; 20150103, approved 23 June 2015; 20150168, approved 31 July 2015) and the institutional review board of National Research Institute for Child Health and Development (no. 234, approved 5 March 2012) and was performed in accordance with the ethical standards outlined in the 1964 Declaration of Helsinki and its later amendments. All study participants provided informed consent. Participants gave informed consent to participate in the study before taking part.
Acknowledgments
The authors would like to thank the medical staff in the perinatal care unit of Keio University Hospital for excellent patient care, and the staff of the Department of Maternal-Fetal Biology, National Research Institute for Child Health and Development, and special thanks to Professor Atsushi Tajima, Department of Bioinformatics and Genomics, Graduate School of Advanced Preventive Medical Sciences, Kanazawa University, for his support. We thank Editage (www.editage.jp) for English language editing.
References
Footnotes
Contributors YK and TK collected the data, performed statistical analyses, wrote the manuscript, contributed to the discussion, and reviewed/edited the manuscript; KM contributed to the discussion and wrote and reviewed/edited the manuscript; AH collected the data; MTam, KHas, SI, DO, YS, MH, MTan, and KHat contributed to the discussion and reviewed/edited the manuscript; and all authors approved the final manuscript for publication. TK and KHat are responsible for the overall content as the guarantor.
Funding This study was supported by the Japan Agency for Medical Research and Development grant number 18ek0109278h0002, 18ek0109290h0002, and 18mk0102093s0402, and by the Japan Society for the Promotion of Science KAKENHI grant number 17K19535 and 19K09761.
Competing interests None declared.
Provenance and peer review Not commissioned; externally peer reviewed.