Article Text

Abstract
Introduction Non-alcoholic fatty liver disease is reportedly associated with type 2 diabetes and progressive liver fibrosis, as evaluated by transient elastography, and has been linked with micro- and macroangiopathy in people with type 2 diabetes. The purpose of this cross-sectional study was to investigate the association between serum mac-2 binding protein glycosylation isomer (M2BPGi) levels and diabetic complications in people with type 2 diabetes.
Research design and methods Serum M2BPGi levels were measured in terms of cut-off index (C.O.I.) units. Urinary albumin excretion (UAE) was calculated and nephropathy was graded as normoalbuminuria, microalbuminuria, or macroalbuminuria. Retinopathy was divided into three groups: no-diabetic retinopathy (NoDR), non-proliferative-diabetic retinopathy (NPDR), or proliferative-diabetic retinopathy (PDR) .
Results The mean age for the 363 studied subjects (212 males) was 66.4±10.6 years, the median serum M2BPGi level was 0.77 (0.57–1.04) C.O.I., and the median UAE was 22 (9–82.1) mg/g creatinine. M2BPGi levels in microalbuminuria (0.83 (0.61 to 1.18) C.O.I.) and macroalbuminuria (0.88 (0.67 to 1.22) C.O.I.) cases were higher than those in normoalbuminuria cases (0.71 (0.54 to 0.92) C.O.I.). M2BPGi levels in NPDR (0.93 (0.68 to 1.28) C.O.I.) and PDR (0.95 (0.71 to 1.31) C.O.I.) cases were higher than in cases with NoDR (0.73 (0.56 to 0.99) C.O.I.). Furthermore, M2BPGi levels in subjects with a history of cardiovascular diseases were higher than in those with no such history (0.82 (0.65 to 1.22) vs 0.76 (0.55 to 1.03) C.O.I., p=0.019). The logarithm of (M2BPGi+1) was associated with the logarithm of UAE values after adjusting for covariates (standardized β=0.107, p=0.031).
Conclusions This study reveals a close association between serum M2BPGi levels and diabetic microangiopathy and macroangiopathy in people with type 2 diabetes. The results also show that liver fibrosis, evaluated by M2BPGi, is independently associated with an increased risk of albuminuria.
- liver disease
- cardiovacsular disease(s)
- albuminuria
- biomarkers
This is an open access article distributed in accordance with the Creative Commons Attribution Non Commercial (CC BY-NC 4.0) license, which permits others to distribute, remix, adapt, build upon this work non-commercially, and license their derivative works on different terms, provided the original work is properly cited, appropriate credit is given, any changes made indicated, and the use is non-commercial. See: http://creativecommons.org/licenses/by-nc/4.0/.
Statistics from Altmetric.com
Significance of this study
What is already known about this subject?
There is an association between non-alcoholic fatty liver disease and microangiopathy and macroangiopathy in people with diabetes.
Liver fibrosis, evaluated by transient elastography, is associated with microangiopathy and macroangiopathy in people with type 2 diabetes.
Mac-2 binding protein glycosylation isomer (M2BPGi) has been reported as a non-invasive new serological glycobiomarker for liver fibrosis.
What are the new findings?
Serum M2BPGi level increased coordinately with diabetic microangiopathy.
Serum M2BPGi levels in people with a history of cardiovascular diseases were higher than in people without such a history.
The logarithm of M2BPGi was independently associated with the logarithm of urinary albumin excretion.
How might these results change the focus of research or clinical practice?
Serum M2BPGi levels could be used to assess diabetic complications.
Introduction
The number of people afflicted with type 2 diabetes is on the rise, and diabetic complications, such as microangiopathy and macroangiopathy, are important health problems associated with this disease.1 2 Type 2 diabetes is reportedly associated with non-alcoholic fatty liver disease (NAFLD),3–5 which includes a range of liver conditions from simple steatosis to fibrosis and cirrhosis.6 It has been reported that 56% of people with type 2 diabetes have NAFLD, 37% have liver fibrosis, and 17% have severe liver fibrosis.7There is an association between NAFLD and microangiopathy8 9 and macroangiopathy10 in patients with diabetes. The gold standard for diagnosing liver fibrosis remains liver biopsy. However, liver biopsy is highly invasive. Recently, mac-2 binding protein glycosylation isomer (M2BPGi) has been reported as a non-invasive new serological glycobiomarker for liver fibrosis.11–13
Chronic inflammation and oxidative stress are common pathways in the development of liver fibrosis and diabetes.14 15 There is an association between progressive liver fibrosis, evaluated by transient elastography, and microangiopathy and macroangiopathy in patients with type 2 diabetes.16–18 Thus, it is possible that M2BPGi levels are associated with diabetic complications, particularly microangiopathy and macroangiopathy. However, such an association has not been investigated in previous studies. Therefore, in this cross-sectional study of patients with type 2 diabetes, we investigated these associations.
Materials and methods
Participants and study design
The KAMOGAWA cohort study has been performed by us since 2014 on patients with diabetes.19 Medical data were collected after obtaining informed consent of individuals whose identity was kept secret and compiled into a database. In this cross-sectional study, we selected data of people with type 2 diabetes who attended the outpatient clinic at the Kameoka Municipal Hospital (Kameoka, Japan) or the Kyoto Prefectural University of Medicine (Kyoto, Japan) from January 2016 to May 2018. Data pertaining to the medical history of the participants and their usage of medications were collected. In this study, we only included those people who had their serum levels of M2BPGi checked and excluded those who did not have their urine albumin excretion (UAE) checked.
Biochemical analyses and definitions
The formula used for calculating the body mass index (BMI) was: BMI=weight (kg)/[height (m)]2. Diagnosis of type 2 diabetes was performed based on the Report of the Expert Committee on the Diagnosis and Classification of Diabetes Mellitus.20 The study cohort was divided into non-smokers and current-smokers, based on their declarations in a self-administered questionnaire. Similarly, data of alcohol consumption per week over the past 1 month were collected through a questionnaire. Then, the mean ethanol intake was estimated. The habit of drinking ethanol was defined as an intake greater than 20 g/day.21 Participants were categorized into non-exercisers or regular exercisers based on their declaration in the questionnaire. Also, data of the activities undertaken by the participants were collected. Regular exercisers were defined as people who performed any type of sports activity at least once a week.22
Venous blood was collected from the participants and high-density lipoprotein (HDL) cholesterol, triglycerides, uric acid, creatinine (Cr), aspartate aminotransferase (AST), alanine transaminase (ALT), and platelets were evaluated. Serum M2BPGi levels were evaluated by the M2BPGi reagent and expressed as cut-off index (C.O.I.) units.23 High-performance liquid chromatography was used to determine hemoglobin A1c levels. The estimated glomerular filtration rate (eGFR) was calculated by the equation of the Japanese Society of Nephrology: eGFR (mL/min/1.73 m2)=194 × serum Cr–1.094 × age–0.287 (if women, ×0.739).24 An immunoturbidimetric method was used for UAE evaluation: UAE (mg/g Cr)=the urinary albumin concentration (mg/L)/the urinary Cr concentration (g/L). The mean value was calculated using three UAE values. The fibrosis-4 (FIB4) index was calculated by age (years)×AST (IU/L)/(platelets (109/L)×√ALT (IU/L)).25 NAFLD fibrosis score was calculated by −1.675 + (0.037×Age (years)) + (0.094×BMI) + (1.13×IFG/diabetes [yes=1, no=0]) + (0.99×AST/ALT) – (0.013×platelet [109/L]) – (0.66×albumin (g/dL)).26
In this study, diabetic microangiopathy was defined as the presence of diabetic nephropathy and/or retinopathy. The nephropathy stage was defined as follows: UAE less than 30 mg/g Cr was normoalbuminuria, 30–300 mg/g Cr was microalbuminuria, and more than 300 mg/g Cr was macroalbuminuria.27 Retinopathy was divided into three groups: no diabetic-retinopathy (NoDR), non-proliferative diabetic retinopathy (NPDR), and proliferative diabetic retinopathy (PDR).28 We defined diabetic macroangiopathy as a history of cardiovascular disease (CVD), such as coronary heart disease, cerebral hemorrhage, or ischemic stroke, which was gathered from the medical records.29 Acute myocardial infarction, unstable angina, and silent myocardial infarction, but not stable angina pectoris, were included as coronary heart diseases.29 Patients with an eGFR <60 mL/min/1.73 m2 were defined as having chronic kidney disease (CKD). After at least a 5 min rest in a quiet space, blood pressures were evaluated twice using a HEM-906 device (Omron Healthcare, Lake Forest, Illinois, USA). We used an average of two values for this study.
Medication data were also collected. Specifically, medications for diabetes, including sodium-glucose cotransporter two inhibitors, glucagon-like peptide-1 receptor agonists, and insulin; medications for hypertension, including renin-angiotensin-aldosterone system (RAAS) inhibitors; and medications for dyslipidemia, including statins were collected.
Statistical analyses
JMP V.13.2 software (SAS Institute, Cary, North Carolina, USA) was used for statistical analyses and GraphPad Prism V.8.4.2 software (GraphPad Software, La Jolla, California, USA) was used for creation figures. Means, medians, and frequencies of variables were calculated. Continuous variables are shown as means±SD or medians (IQR). Categorized variables are shown as a number. P<0.05 was set as statistically significant.
Because UAE, duration of diabetes, triglycerides, and M2BPGi were skewed variables, logarithmic transformation was executed before doing correlation, and multiple or logistic regression analyses. Pearson’s correlation was calculated to evaluate relationships between logarithms (M2BPGi+1) and other variables. Differences in serum levels of M2BPGi among groups were evaluated by Kruskal-Wallis and Steel-Dwass tests.
Relationships between the logarithm of UAE and logarithm (M2BPGi+1) were determined by multiple regression analyses with the following elements chosen as independent factors: sex, age, BMI, duration of diabetes, smoking status, systolic blood pressure, hemoglobin A1c, triglycerides, HDL-cholesterol, uric acid, and Cr, and treatment with insulin, RAAS system inhibitors, statins, and platelets.
Last, receiver operator characteristic (ROC) analyses were performed to calculate area under the ROC curve (AUC) of serum levels of M2BPGi for diabetic nephropathy, defined as the presence of microalbuminuria or macroalbuminuria, retinopathy, defined as the presence of NPDR or PDR, and macroangiopathy.
Results
In this study, 365 people with type 2 diabetes were selected. Among these individuals, two for whom there were no UAE data were excluded. Thus, 363 people were enrolled for this study.
Table 1 shows the clinical characteristics data. The mean age was 66.4 (10.6) years, the median serum M2BPGi level was 0.77 (0.57 to 1.04) C.O.I., and the median UAE was 22 (9 to 82.1) mg/g Cr. There were 207 people with normoalbuminuria, 107 people with microalbuminuria, and 49 with macroalbuminuria. Moreover, there were 285 people with NDR, 44 with SDR, and 34 with PDR. Forty-nine people had a history of CVD.
Clinical characteristics of study participants
Table 2 reports simple correlations between serum levels of M2BPGi and other factors. Age, duration of diabetes, BMI, systolic blood pressure, Cr level, log UAE, FIB4 index, and NAFLD fibrosis score were positively associated with logarithms (M2BPGi+1), whereas HDL-cholesterol, eGFR, and platelets were negatively associated with logarithms (M2BPGi+1).
Correlations between logarithmic (M2BPGi+1) and other variables
Table 3 reports comparisons of the serum levels of M2BPGi in various groups. Insulin usage, retinopathy stage, nephropathy stage, CKD, and history of CVD were associated with higher M2BPGi levels.
Comparisons of M2BPGi in various groups
Serum levels of M2BPGi in patients with microalbuminuria and macroalbuminuria were higher than in those with normoalbuminuria (figure 1). In addition, serum levels of M2BPGi in patients with NPDR and PDR were higher than in those with NoDR (figure 1).
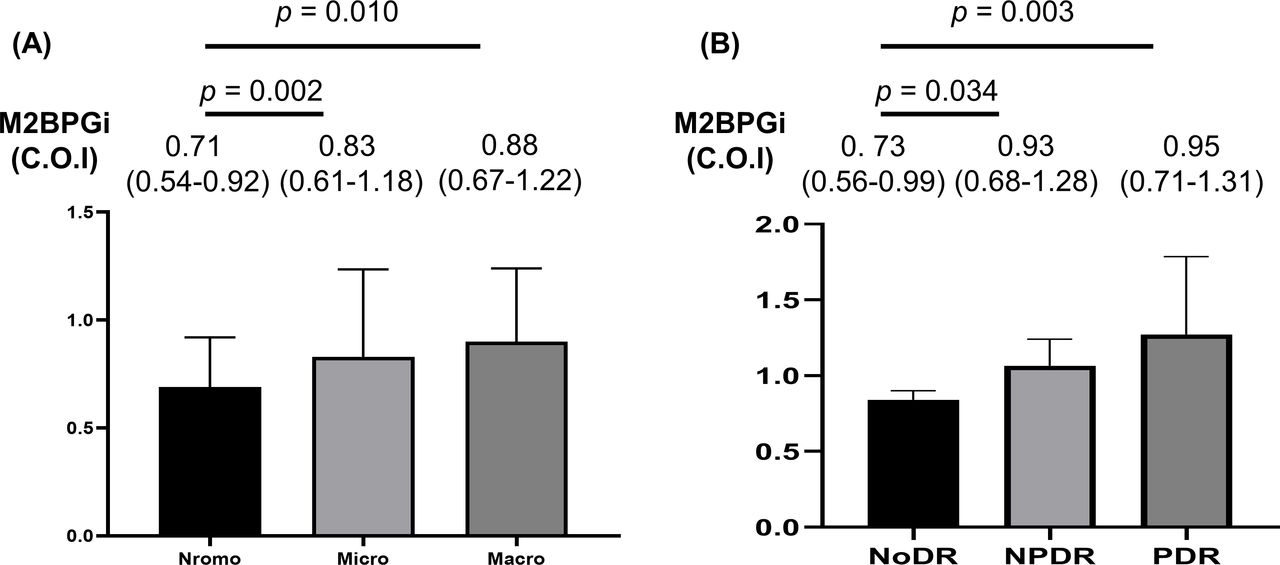
Comparisons of M2BPGi among nephropathy and retinopathy stages. (A) Comparisons of M2BPGi among nephropathy stage. (B) Comparisons of M2BPGi among retinopathy stage. Differences among nephropathy and retinopathy stages were evaluated by a one-way analysis of variance and Tukey honestly significant difference test. C.O.I, cut-off index; M2BPGi, mac-2 binding protein glycosylation isomer; NoDR, no diabetic-retinopathy; NPDR, non-proliferative diabetic retinopathy; PDR, proliferative diabetic retinopathy.
The results of multiple linear regression analyses of the log UAE values are reported in table 4. The logarithm values of (M2BPGi+1) (standardized β=0.104, p=0.042), HbA1c (standardized β=0.169, p<0.001), Cr (standardized β=0.312, p<0.001), HDL-cholesterol (standardized β=0.137, p=0.004), systolic blood pressure (standardized β=0.144, p=0.002), RAAS inhibitor usage (standardized β=0.138, p=0.005), and exercise habit (standardized β=−0.112, p=0.017) were associated with log UAE values after adjusting for covariates.
Multiple linear regression analyses of UAE logarithms
The results of ROC and AUC of M2BPGi for diabetic nephropathy, retinopathy and macroangiopathy are shown in figure 2. The optimal cut-off point of M2BPGi for diabetic nephropathy, retinopathy, and macroangiopathy was 0.95, 0.91, and 0.78, respectively.

ROC curve and AUC. (A) ROC curve and AUC of M2BPGi for diabetic nephropathy. The optimal cut-off point of the M2BPGi for diabetic nephropathy, defined as the presence of microalbuminuria or macroalbuminuria, was 0.95 (AUC 0.62 (95% CI 0.56 to 0.68), sensitivity=0.44, specificity=0.77, p<0.001). (B) ROC curve and AUC of M2BPGi for diabetic retinopathy. The optimal cut-off point of the M2BPGi for diabetic retinopathy, defined as the presence of non-proliferative diabetic retinopathy or proliferative diabetic retinopathy, was 0.91 (AUC 0.64 (95% CI 0.57 to 0.71), sensitivity=0.58, specificity=0.59, p<0.001). (C) ROC curve and AUC of M2BPGi for diabetic macroangiopathy. The optimal cut-off point of the M2BPGi for diabetic macroangiopathy was 0.78 (AUC 0.60 (95% CI 0.52 to 0.68), sensitivity=0.63, specificity=0.54, p<0.001). AUC, area under the ROC curve; M2BPGi, mac-2 binding protein glycosylation isomer; ROC, receiver operating characteristic.
Discussion
This study clarifies the relationship between the serum M2BPGi levels and diabetic microangiopathy and macroangiopathy in patients with type 2 diabetes. This is the first study, to our knowledge, to reveal the association between M2BPGi levels and diabetic microangiopathy and macroangiopathy in people with type 2 diabetes.
Possible interpretations for the connection between M2BPGi levels and diabetic microangiopathy and macroangiopathy are as follows. M2BPGi is a marker of liver fibrosis, although the mechanism of the association between M2BPGi and liver fibrosis is not fully understood.11 Cross-sectional studies and retrospective cohort study reported that there was an association between progressive liver fibrosis, evaluated by transient elastography, and microangiopathy and macroangiopathy in people with type 2 diabetes.16–18 In fact, liver fibrosis is a mortality risk from CVD in people with NAFLD.30
Both liver fibrosis and diabetic microangiopathy or macroangiopathy are associated with chronic inflammation, including tumor necrosis factor-α (TNF-α), the RAAS, and intercellular adhesion molecule-1. In patients with liver fibrosis, the expression of TNF-α is increased.31 TNF-α induces renal damage through several mechanisms.32 33 The cytotoxicity induced by TNF-α stimulates apoptosis of glomerular cells and, consequently, results in the progression of albuminuria34 and CVD.32 In addition, TNF-α is associated with diabetic retinopathy through reduced adherence of leukocytes to retinal blood vessels, blood-retinal barrier breakdown, and apoptosis of retinal cells.35 Moreover, activation of the RAAS occurs in liver fibrosis,36 which promotes inflammation through enhanced production of reactive oxygen species leading to hypertrophy and renal fibrosis.36 37 In addition, RAAS inhibitors are protective effectors for diabetic retinopathy.38 Furthermore, intercellular adhesion molecule-1 is associated with liver fibrosis,39 and diabetic microangiopathy40 and macroangiopathy.41 Thus, M2BPGi, which is a surrogate marker of liver fibrosis, has a close association with diabetic microangiopathy and macroangiopathy.
Previous studies revealed an association between progressive liver fibrosis and diabetic microangiopathy or macroangiopathy in patients with type 2 diabetes.16–18 To detect liver fibrosis, a liver biopsy is the gold standard; however, this is a highly invasive procedure. M2BPGi is a non-invasive new serological glycobiomarker for liver fibrosis.11–13 In this study, a history of CVD, duration of diabetes, severity of microangiopathy, systolic blood pressure, HDL-cholesterol, and BMI were associated with the serum levels of M2BPGi. These results were similar to those of previous studies.42–44 In addition, a recent study revealed that metabolic parameters are associated with an increase of M2BPGi.45 Furthermore, serum levels of M2BPGi are higher in patients with chronic heart failure.46
In this study, we showed that the cut-off points of diabetic nephropathy, retinopathy, and macroangiopathy were 0.95, 0.91, and 0.78, respectively. These cut-off points were lower than that of chronic hepatitis (M2BPGi≥1.00).11 M2BPGi, which is easy to measure in clinical practice, could be an indicator to prevent future diabetic microangiopathy or macroangiopathy, and we should pay attention to people with high M2BPGi and improve their metabolic parameters.
The current study has some limitations. First, the study design was cross-sectional. Thus, the causal relationship between the M2BPGi levels and diabetic microangiopathy and macroangiopathy is unclear. Additional prospective studies are needed to establish the association between M2BPGi and the progression or improvement of diabetic microangiopathy or macroangiopathy. Second, we did not perform liver biopsies; thus, we were unable to compare M2BPGi levels with histology data. Third, we did not have liver histology and fibrosis information, nor data on the presence of a hepatitis virus. Such data are important for assessing the degree of liver steatosis and fibrosis and causes of liver diseases. Last, the study population was comprised of only Japanese people; therefore, it is not clear whether the findings of this study can be applied to other ethnic groups.
Despite these limitations, this study reveals, for the first time, the relationship between M2BPGi levels and diabetic microangiopathy and macroangiopathy in people with type 2 diabetes. This study also shows that M2BPGi is independently associated with an increased risk of albuminuria.
Acknowledgments
We would like to thank Editage (www.editage.com) for English language editing.
References
Footnotes
Contributors YH designed the study, researched, analyzed and interpretation data, and wrote manuscript. MH designed the study, researched the data, and contributed to discussion. AK and RS researched and analyzed data and contributed to discussion. NK researched the data and contributed to discussion. MF designed the study, interpreted the data, and contributed to discussion. All authors approved the final version of the manuscript and agree to be accountable for all aspects of the work in ensuring that questions related to the accuracy or integrity of any part of the work are appropriately investigated and resolved.
Funding The authors have not declared a specific grant for this research from any funding agency in the public, commercial or not-for-profit sectors.
Competing interests YH received grant support from Asahi Kasei Pharma and honoraria from Mitsubishi Tanabe Pharma Corp and Novo Nordisk Pharma Ltd. MH received grant support from Asahi Kasei Pharma, payment for development of educational presentations from MSD K.K., Mitsubishi Tanabe Pharma Corp, Kowa Co. Ltd. and Sumitomo Dainippon Pharma Co. Ltd., and royalties from US 10,238,714 B2. MF received research supports and payment for development of educational presentation from AstraZeneca plc., Astellas Pharma Inc., Nippon Boehringer Ingelheim Co. Ltd., Daiichi Sankyo Co. Ltd., Eli Lilly Japan K.K., Kyowa Hakko Kirin Co. Ltd., Kissei Pharmaceutical Co. Ltd., MSD K.K., Sumitomo Dainippon Pharma Co. Ltd., Kowa Co. Ltd., Mitsubishi Tanabe Pharma Corp, Novo Nordisk Pharma Ltd., Sanwa Kagaku Kenkyusho Co. Ltd., Sanofi K.K., Ono Pharma Co. Ltd., Taisho Pharma Co. Ltd., Bayer Yakuhin, Ltd., Mochida Pharma Co. Ltd., Johnson & Johnson k.k. Medical Co., Nippon Chemiphar Co. Ltd., Terumo Corp, Teijin Pharma Ltd., and Takeda Pharma Co. Ltd.
Patient consent for publication Not required.
Ethics approval The Ethics Committee of Kyoto Prefectural University of Medicine permitted this study (No. RBMR-E-466–5).
Provenance and peer review Not commissioned; externally peer reviewed.
Data availability statement Data are available on reasonable request. The datasets used and/or analyzed during the current study are available from the corresponding author on reasonable request.