Article Text

Abstract
Introduction Grip strength has been associated with chronic diseases and mortality. However, current evidence of the association between grip strength and incident type 2 diabetes mellitus (T2DM) is controversial. The aim of this study was to investigate the associations of absolute and relative grip strength with incident T2DM and whether these associations differ by sociodemographic, lifestyle and adiposity-related factors.
Research design and methods This was a prospective cohort study of 166 894 participants in the UK Biobank (mean age 56.5 years, 54.4% women). The outcome was T2DM incidence and the exposure was grip strength, expressed in absolute (kg) and relative (kg per kg of body weight) values. The association between grip strength and T2DM incidence was investigated using Cox-proportional regression.
Results The median follow-up was 5.3 years (IQR: 4.7–6.1). During this time, 3713 participants developed T2DM. Lower grip strength was associated with a higher risk of T2DM in both sexes. Those in the lowest quintile of absolute grip strength had a 50% higher risk in men (HR: 1.50 (95% CI: 1.30 to 1.73)) and 25% higher risk in women (HR: 1.25 (95% CI: 1.06 to 1.47)) compared with those in the highest quintile. For relative grip strength, risk of diabetes was more than double for men (HR: 2.22 (95% CI: 1.84 to 2.67)) and 96% higher for women (HR: 1.96 (95% CI: 1.52 to 2.53)) in the lowest compared with highest quintiles.
Conclusions Grip strength is associated with a higher risk of T2DM incidence in both men and women independent of important confounding factors including age, deprivation, adiposity and lifestyle. However, the associations were stronger when grip strength is expressed relative to body weight, which could reflect the importance of muscle quality.
- diabetes mellitus
- type 2
- muscles
- epidemiology
- longitudinal studies
Data availability statement
Data are available upon reasonable request. Data can be obtained upon request to UK Biobank.
This is an open access article distributed in accordance with the Creative Commons Attribution Non Commercial (CC BY-NC 4.0) license, which permits others to distribute, remix, adapt, build upon this work non-commercially, and license their derivative works on different terms, provided the original work is properly cited, appropriate credit is given, any changes made indicated, and the use is non-commercial. See: http://creativecommons.org/licenses/by-nc/4.0/.
Statistics from Altmetric.com
Significance of this study
What is already known about this subject?
Type 2 diabetes mellitus (T2DM) incidence has increased worldwide.
Lower grip strength has been associated with a higher risk of T2DM and other chronic diseases.
What are the new findings?
The association of grip strength with incident T2DM differed if grip strength was expressed in absolute or relative terms.
A 1 SD lower relative grip strength was associated with a 12% and 20% higher T2DM risk in women and men, respectively.
How might these results change the focus of research or clinical practice?
Assessing grip strength is a simple and cheap method that could be used in clinical practice to identify people who have muscle weakness and therefore have a high risk of developing T2DM.
Introduction
Type 2 diabetes mellitus (T2DM) is a common but complex disease which is associated with elevated cardiovascular risk.1 Identifying predictors for the development of T2DM as well as modifiable risk factors is, therefore, of great interest. Several lifestyle factors such as cardiorespiratory fitness,2 physical activity3 and muscle strength2 4 5 have been shown to be associated with T2DM incidence and involved in the aetiology of the disease.
Grip strength is an easy, low-cost measurement that has strong clinical and prognostic value for chronic diseases and mortality.6 7 Low levels of grip strength have been associated with a higher risk of cardiovascular diseases (CVDs), respiratory disease, cancer, and premature mortality in middle age and older adults.7–9 Although there is increasing evidence regarding the association between grip strength and T2DM from prospective studies, current evidence is controversial and has some major limitations.2 5 10–13 A recent meta-analysis conducted by Tarp et al,2 which included 13 prospective studies (n=1 713 468 participants), reported that a 1 SD higher absolute grip strength was associated with a 13% lower risk of T2DM. This study also highlighted the high heterogeneity between existing studies, differences in the number of confounding factors accounted for and a lack of sensitivity analyses to reduce the possible effect of reverse causation. In addition, this meta-analysis was based on summary statistics and not on individual participant’s data, which limit its capacity to account for confounder factors in a harmonized manner across different studies.
This study will address these limitations by using data from the UK Biobank, a large prospective cohort study. The aim of this study, therefore, is to investigate the associations between grip strength, expressed in absolute and relative units, and incident T2DM and to explore whether these associations differ by key sociodemographic, lifestyle and adiposity-related factors.
Research design and methods
Study design
At baseline, the UK Biobank recruited >502 000 participants between 2006 and 2010 (5.5% response rate, men and women were aged 37–73 years) from the general population.14 Participants attended 1 of 22 assessment centers across England, Wales, and Scotland.15 16 At the assessment centers, participants completed an electronically signed consent, a touch screen questionnaire and physical measurements such as hand grip measurement, and collected biological samples, including blood, urine, and saliva, as previously described.15 16 Analyses for the current study were conducted in 166 894 participants of the UK Biobank cohort, who had available records from primary care, the exposure (grip strength) and covariates. Participants with prevalent diabetes and undiagnosed diabetes (n=29 765), as well as those with prevalent CVD and cancer (n=67 776) at the baseline assessment, were excluded from the study (online supplemental figure 1).
Supplemental material
Outcome
Incident T2DM was derived from linkage to primary care data in UK Biobank. Records were extracted for 45% of the UK Biobank cohort (228 495 participants). The end of coverage (extract date) was May 2017 for Scotland, September 2017 for Wales and August 2017 for England. Detailed linkage procedures are available at http://biobankndphoxacuk/showcase/showcase/docs/primary_care_datapdf. Incident T2DM was defined as primary care diagnosis with ICD-10 (International Classification of Diseases, 10th revision) code E11. ICD codes were converted to read codes using UK Biobank’s look-up table. All participants with T2DM from primary care data and who were diagnosed before their UK Biobank baseline assessment visit were excluded from the analyses.
Exposure
Grip strength was measured using a Jamar J00105 hydraulic hand dynamometer. Isometric grip force was assessed from single 3 s maximal grip efforts of the right and left sides with participants seated upright with their elbow by their side flexed at 90° so that their forearm was facing forward and resting on an armrest. The dynamometer was adjusted to the participant’s hand size. Moreover, if participants could not perform the grip strength test due to existing health issues, then these data were excluded from the analyses. The average value recorded from the right and left hand was expressed in absolute (kilograms) and relative units (kilogram of grip strength divided by kilogram of body weight) and used for subsequent analyses.7 8 17
Covariates
Sex was self-reported at baseline, age was calculated from date of birth and baseline assessment; ethnicity was self-reported at baseline and was categorized as white, South Asian, mixed, Chinese, or other. Deprivation index, an area-based measure of socioeconomic status, was derived from the postal code of residence by using the Townsend deprivation score.18 Education was self-reported at baseline.
Anthropometric measurements were obtained by trained personnel following standard operating procedures and using calibrated equipment.19 Weight was measured, without shoes and outdoor clothing, using the Tanita BC 418 body composition analyzer. Height was measured, without shoes, using the wall-mounted SECA 240 height measure. Body mass index (BMI) was calculated from weight (in kilograms) divided by square of height (in meters). The WHO’s criteria were used to classify BMI into categories of underweight (<18.5 kg/m2), normal weight (18.5–24.9 kg/m2), overweight (25–29.9 kg/m2) and obese (≥30 kg/m2).20 Waist circumference (WC) was measured midway between lowest rib margin and the iliac crest, in a horizontal plane, using a non-elastic SECA 200 tape measure. A WC >88 cm for women and >102 cm for men were used to define central obesity. Further details can be found in the UK Biobank protocol.19
Smoking status was categorized into never, former, and current. Fruit and vegetable, red meat, and processed meat intake was recorded by using a touch screen questionnaire asking the reported frequency of consumption at baseline. Alcohol intake was self-reported and categorized into daily/almost daily, three to four times a week, once or twice a week, one to three times a month, special occasions only and never. Sedentary behavior was self-reported, and a discretionary screen time variable was derived to combine TV viewing and leisure personal computer screen time in hours per day.21 Physical activity was based on the International Physical Activity Questionnaire short form,21 with participants reporting the frequency and duration of walking, moderate and vigorous activity undertaken in a typical week. Total physical activity was computed as the sum of walking, moderate and vigorous activity, measured as metabolic equivalent task (MET, hours/week). Total physical activity <600 MET-min/week was defined as being physically inactive. Sleep duration was self-reported and categorized as short sleep <7 hours/day, normal sleep 7–9 hours/day and long sleep >9 hours/day.
Prevalent diseases that were medically diagnosed were self-reported at baseline. Additional details about these measurements can be found in the UK Biobank online protocol.19
Statistical analysis
Cox-proportional hazard models were used to investigate the associations between grip strength (in absolute and relative units) and incident T2DM with follow-up as the timeline variable. The results are reported as HRs together with 95% CIs. The analyses were conducted using a 2-year landmark period and excluded all participants with prevalent type 1 and type 2 diabetes mellitus, unknown T2DM, CVD and cancer at baseline (n=30 592).
Grip strength was treated as a continuous variable and calculated HRs per 5 kg lower grip strength and 0.05 kg/kg lower relative grip strength, for men and women separately. In addition, both absolute and relative grip strength were standardized and expressed as 1 SD lower grip strength. HRs were also calculated for age-specific and sex-specific quintiles of absolute and relative grip strength, with participants in the highest quintile of grip strength used as the reference group (cut-off points are presented in online supplemental table 1).
Moderator analyses were conducted to investigate whether the association between grip strength and T2DM differed by moderating factors. Therefore, Cox-regression analyses using 5 kg and 0.05 kg/kg grip strength as exposures were stratified by age (≤55 vs >55 years), deprivation (below and above the median), ethnicity (white, South Asian and black participants), BMI (normal weight vs obesity), central obesity (normal vs central obesity), and physical activity (active vs inactive). An interaction term between grip strength and the moderator was fitted into the model to test whether the association between grip strength and T2DM incidence differed by these factors.
Rate advancement periods (RAPs) were used to estimate the number of additional chronological years that would be required to yield the equivalent risk rate of T2DM incidence among individuals in the lowest quintile for grip strength compared with the highest quintile. The coefficient of incidence for those individuals in the lowest quintile for grip strength referent to individuals in the highest quintile was divided by the coefficient for incidence associated with each yearly increase in age, as described elsewhere.22
Four models were conducted with an increasing number of covariates: model 0 (minimally adjusted) included age, ethnicity, deprivation index, and education. Model 1 was adjusted as in model 0 but also included smoking, fruit and vegetable intake, red meat intake, processed meat intake, alcohol intake, total sedentary time and sleep time. Model 2 (sensitivity analyses) was adjusted as in model 1 but also included BMI to investigate whether the association of grip strength and T2DM was independent of overall adiposity. Similarly, model 3 was adjusted for model 1 but BMI was replaced for WC to investigate whether the associations were independent of central adiposity. The Pearson correlation of absolute and relative grip strength with BMI was 0.044 and −0.414, respectively. Therefore, collinearity assumptions were not violated when relative grip strength was adjusted for BMI or WC in the models.
The proportional hazard assumption was checked by tests based on Schoenfeld residuals. Statistical analyses were performed using the statistical software STATA V.16 (StataCorp). Significance was accepted at p<0.05.
Results
The analyses were conducted in 166 894 (73 100 men and 93 794 women) participants with full data available for T2DM incidence, grip strength and covariables. The median follow-up period was 5.4 years (IQR: 4.7–6.1) after excluding the first 2 years in the landmark analysis. Over the follow-up, 3713 participants developed T2DM (2073 men and 1640 women).
The primary cohort characteristics by grip strength quintiles are presented in table 1. In summary, participants with the highest levels of grip strength were more likely to be individuals with low deprivation, from a white or black ethnic background, those with college or university degree, overweight, previous smokers and normal sleepers (7–9 hours/day). Those in the highest quintile of grip strength also reported a higher fruit and vegetable intake, and total physical activity, but also had a higher systolic blood pressure when compared with the lowest grip strength quintile. Cohort characteristics by sex are presented in online supplemental tables 2 and 3.
Cohort characteristics by quintiles of grip strength
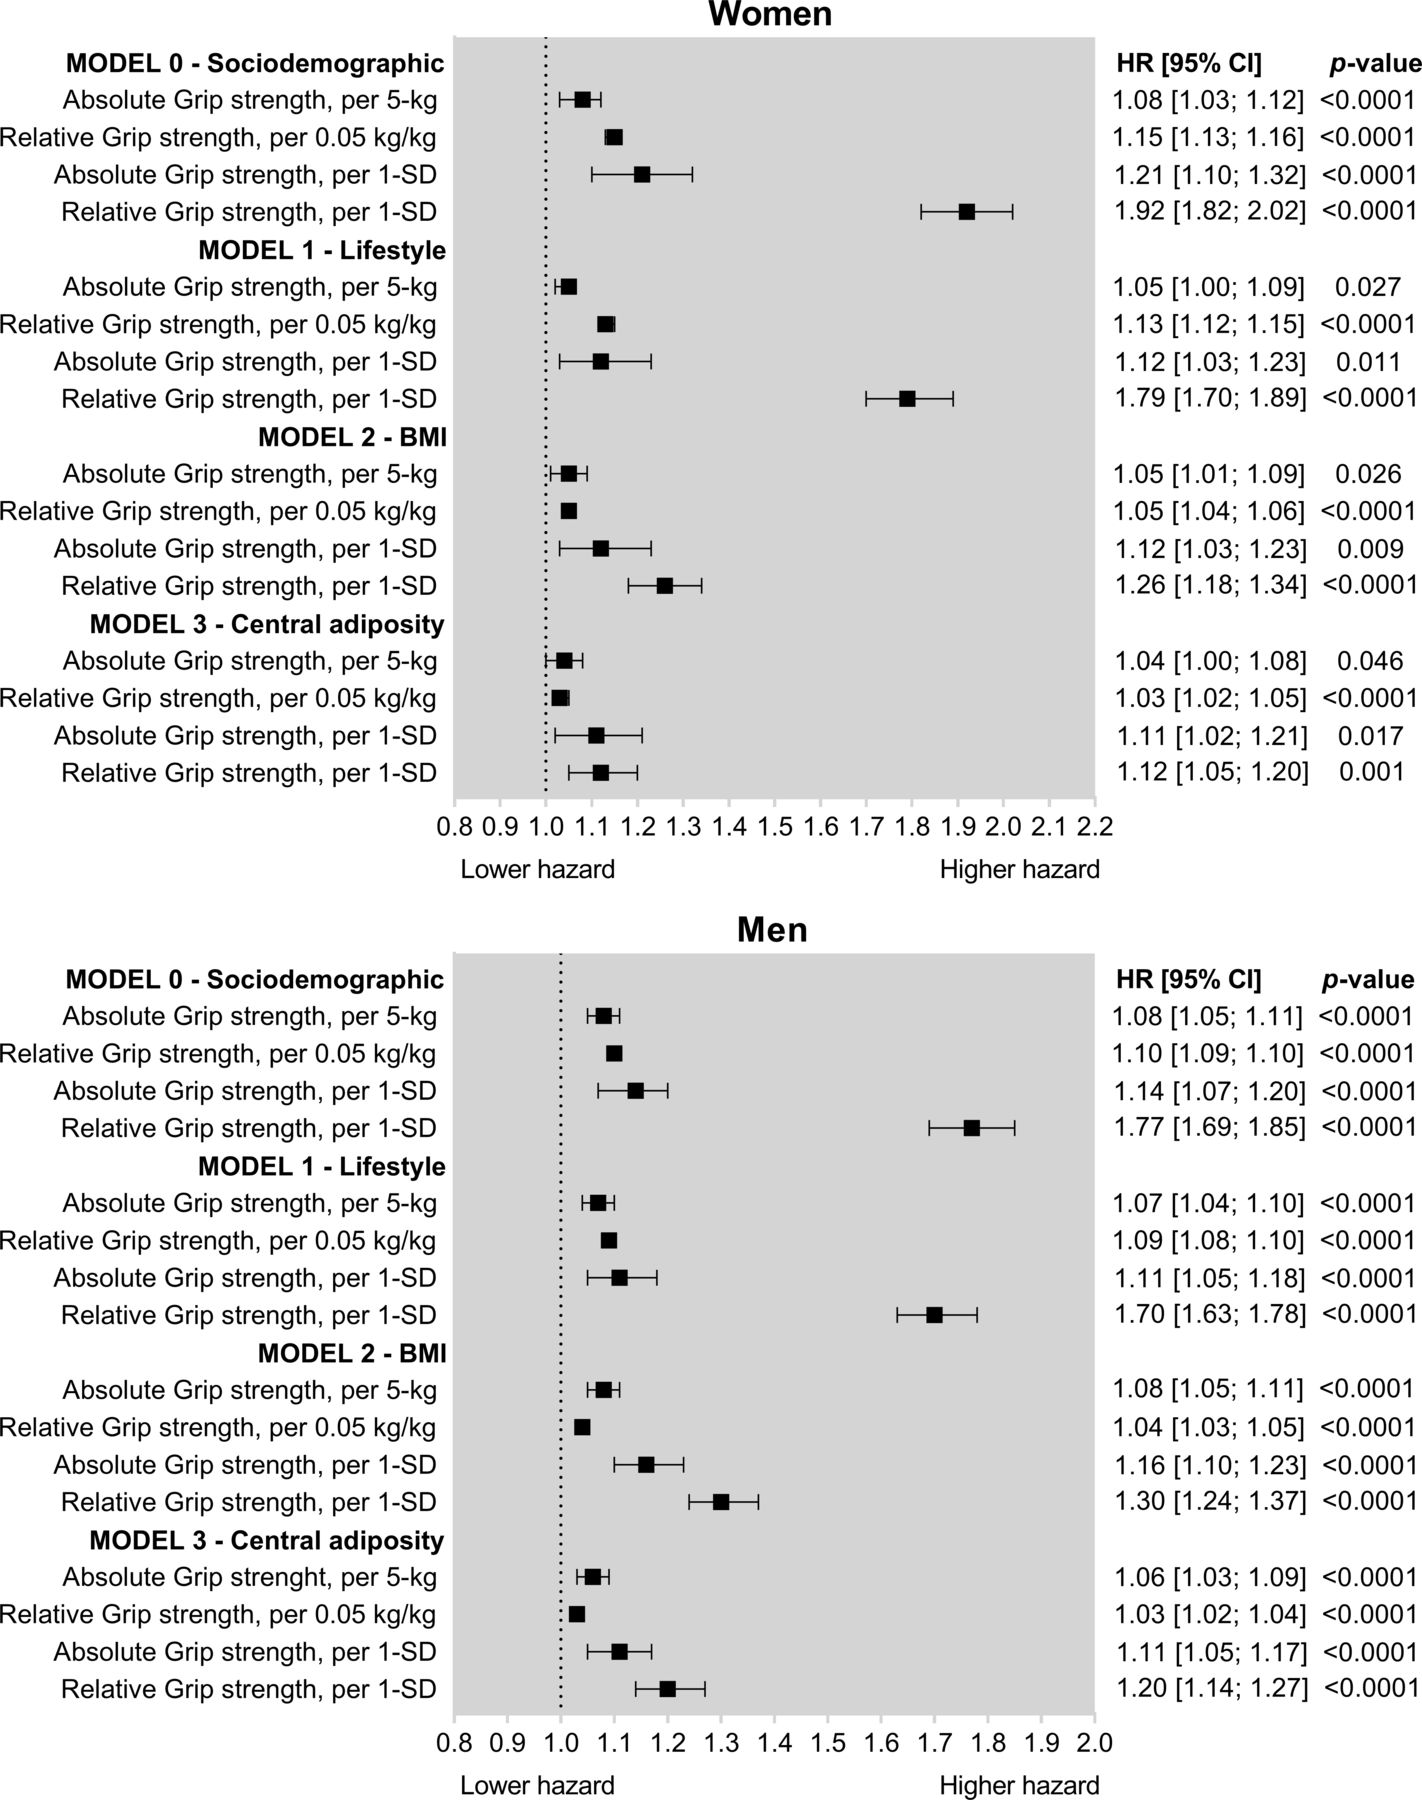
As shown in figure 1, lower grip strength was associated with a higher risk of incident T2DM for men and women with the associations stronger when grip strength was expressed in relative units (kg per kg of body weight). In the minimally adjusted model (model 0), 5 kg lower grip strength was associated with an 8% higher T2DM risk for both men and women and a 0.05 kg/kg lower relative grip strength was associated with a 10% and 15% higher risk of T2DM for men and women, respectively (figure 1). The magnitude and direction of the associations were similar when the analyses were adjusted for lifestyle factors (model 1). However, when the analyses were further adjusted for BMI or WC, the associations were attenuated, although remained statistically significant. The risk of T2DM for the fully adjusted model (model 3) was 4% and 6% higher per 5 kg lower grip strength in women and men, respectively, and per 0.05 kg/kg lower relative grip strength the risk of T2DM was 3% higher for both men and women (figure 1).

Associations between grip strength and type 2 diabetes mellitus incidence in women and men. Data are presented as HR and 95% CI. HRs were estimated for absolute units (per 5 kg lower grip strength), relative units (0.05 kg/kg of body weight), and per 1 SD lower grip strength. Model 0 was adjusted for age, deprivation, ethnicity and education; model 1 was adjusted for all covariates included in model 0 plus lifestyle variables (smoking, fruit and vegetable intake, red meat intake, processed meat intake, alcohol intake, total sedentary time and sleep time); and model 2 was adjusted for all covariates included in models 0 and 1 plus BMI categories. Model 3 was like model 2 but BMI was replaced for waist circumference. All analyses were conducted using 2-year landmark analyses and excluding participants with comorbidities at baseline (type 1 and type 2 diabetes mellitus, unknown diabetes, cardiovascular diseases and cancer). For absolute grip strength, 1 SD was equivalent to 6.15 and 8.70 kg for women and men, respectively. For relative grip strength, 1 SD was equivalent to 0.10 and 0.11 kg per kg of body weight for women and men, respectively. BMI, body mass index.
When associations were investigated per 1 SD lower grip strength, the risk observed in the minimally adjusted model was higher for relative grip strength (77% and 92% per 1 SD lower grip for men and women, respectively) compared with absolute grip strength (14% and 21% per 1 SD lower grip for men and women, respectively). However, when the analyses were fully adjusted (model 3, adjusted by WC instead of BMI), differences in T2DM risk betweeen absolute and relative grip strength were smaller. A 1 SD lower absolute grip strength was associated with an 11% higher risk for both men and women; and a 1 SD lower relative grip strength was associated with a 12% and 20% higher T2DM risk in women and men, respectively (figure 1).
The associations between age-specific and sex-specific quintiles of absolute and relative grip strength are presented in figure 2. For the minimally adjusted models (model 0), there were clear differences in T2DM risk between absolute and relative quintiles of grip strength. One quintile lower absolute grip strength was associated with an 8% and 7% higher risk of T2DM in men and women, respectively. However, the T2DM risk per 1 quintile lower relative grip strength was 50% and 61% higher for men and women, respectively (figure 2). The magnitude of associations remained similar when analyses were adjusted for lifestyle factors (model 1) but was considerably attenuated when the analyses were adjusted for BMI or WC (models 2 and 3). For the fully adjusted model (model 3), the diabetes risk per 1 quintile lower absolute grip strength was 4% and 7% higher for women and men, respectively. However, the risk per 1 quintile lower relative grip strength was 11% and 15% higher in women and men, respectively.

Association of age-specific and sex-specific quintiles of grip strength with type 2 diabetes mellitus incidence for men and women. Data are presented as HR and 95% CI. HRs were estimated for absolute (expressed in kg) and relative (expressed per kg of grip per kg of body weight) quintiles of grip strength. The reference group was those in the highest quintile for grip strength. Model 0 was adjusted for age, deprivation, ethnicity and education; model 1 was adjusted for all covariates included in model 0 plus lifestyle variables (smoking, fruit and vegetable intake, red meat intake, processed meat intake, alcohol intake, total sedentary time and sleep time); and model 2 was adjusted for all covariates included in models 0 and 1 plus BMI categories. Model 3 was like model 2 but BMI was replaced for waist circumference. All analyses were conducted using 2-year landmark analyses and excluding participants with comorbidities at baseline (type 1 and type 2 diabetes mellitus, unknown diabetes, cardiovascular diseases and cancer). BMI, body mass index.
The RAP analysis revealed that individuals with the lowest grip strength (quintile 1) experience the same diabetes incidence as those among the highest fifth for grip strength who were 23.0 years (95% CI: 20.7 to 27.5) and 34.5 years (95% CI: 35.2 to 34.0) older, for women and men, respectively. The RAP estimates for each quintile of relative grip strength compared with those in the highest fifth of grip are presented in online supplemental table 4.
Figure 3 shows the associations between grip strength and diabetes risk stratified by sociodemographic, lifestyle and adiposity levels. For absolute grip strength, 1 SD lower grip strength was associated with a 24% higher risk in individuals ≤55 years compared with a 13% higher risk of diabetes observed in individuals aged >55 years (p-interaction=0.033). No significant differences were observed for any other moderators when absolute grip strength was used as the exposure. However, the risk of T2DM per 1 SD lower relative grip strength was different by age groups and ethnicity (figure 3). T2DM risk was 39% higher per 1 SD lower relative grip strength in individuals aged <55 years compared with a 23% higher risk observed in individuals aged >55 years (p-interaction <0.0001). The association of relative grip strength and T2DM also differed by ethnicity (p-interaction=0.005). White European participants had the highest T2DM risk (29% per 1 SD lower relative grip strength) compared with South Asians (16%), however, no associations were observed for individuals of a black ethnic background (figure 3).

Association of grip strength with type 2 diabetes mellitus incidence by sociodemographics, lifestyle and adiposity. Data are presented as HRs and 95% CI per 1 SD lower grip strength expressed in absolute and relative units. Analyses were adjusted for sex, age, deprivation, ethnicity, education, lifestyle variables (smoking, fruit and vegetable intake, red meat intake, processed meat intake, alcohol intake, total sedentary time and sleep time) and BMI except when the covariate was used as the moderator in the analyses. 1 SD grip strength was equivalent to 11.0 kg for absolute grip and to 0.12 kg per kg of body weight for relative grip strength. BMI, body mass index.
For adiposity, higher T2DM risk was observed for individuals with normal weight (19%) versus their obese counterparts who had an 8% higher T2DM risk per 1 SD lower absolute grip strength. Similar results were observed for central obesity per 1 SD increment on absolute grip strength, those with normal WC had a 22% higher T2DM risk compared with 10% observed for those centrally obese (figure 3). However, when grip strength was expressed in relative terms, no differences were observed within normal weight and obese individuals (figure 3).
Discussion
The main finding of this study is that lower grip strength was associated with a higher incidence of T2DM in both men and women, independent of anthropometric measurements, diet, and measures of physical activity. However, the association differed if grip strength was expressed in absolute or relative, that is in relation to body weight, terms. These findings have important public health relevance as grip strength is easy to use, quick to conduct, cheap23 and it is the simplest measurement of muscle function possible in clinical practice.7 24 Lower grip strength was found to have a stronger dose–response association with risk of T2DM when expressed relative to body weight, whereas for absolute grip strength only those in the lower fifth were at higher risk. Therefore, relative grip strength may be a practical method to identify people who have muscle weakness, who are at high risk of developing T2DM.25
Our findings partially agree with existing evidence regarding the association of muscle strength and T2DM risk.2 11–13 26 A recent meta-analysis conducted in 39 233 incident T2DM cases and 1 713 468 participants without diabetes from 13 studies reported that 1 SD higher absolute grip strength was associated with a 24% lower risk of T2DM when the analyses were not adjusted for adiposity (mainly BMI), however, the association was attenuated but remained significant when the analyses were adjusted for adiposity (13% lower risk of T2DM per 1 SD higher grip strength).2 This study also observed that the magnitude of the associations was higher when grip strength was normalized by body weight (relative grip strength), similar to the finding observed in our study. However, some of the limitations highlighted by this meta-analysis were the high heterogeneity within studies as well as the lack of approaches to reduce the effect of reverse causation.2 Furthermore, this meta-analysis also reported that not all studies included reported a protective effect, with some of them reporting a detrimental association.5 27
This agrees with other international studies such as the PURE, which was undertaken across 17 countries including 139 691 adults of whom 2939 (2.1%) developed T2DM over a median of 4.0 years of follow-up, reported no significant association between grip strength and T2DM, although a trend was evident (HR: 1.03 per 5 kg lower grip strength (95% CI: 0.99 to 1.06)).12 This borderline association could be explained by the diversity of the PURE cohort, as grip strength was substantially different between low-income (30.2 kg), middle-income (37.3 kg) and high-income (38.1 kg) countries, especially for men. Moreover, the analyses conducted by the PURE Study did not stratify by sex, which is surprising due to the large differences in grip strength between men and women.12 Another study conducted in the Michigan site of the Study of Women’s Health Study, which included 424 participants (60% black, 40% white participants) and who were followed up for 16 years, reported that a 0.1 unit increment in relative grip strength (kg of grip strength divided by kg of body weight) was associated with a 19% lower risk of incident T2DM after adjustment for age, race/ethnicity, economic strain, smoking, menopause status, hormone use, physical activity and waist–hip ratio. This study also reported that when the associations were stratified by ethnicity, for each 0.1 increment in relative grip strength there was a 54% lower hazard of incident T2DM among white but not black women.13 This agrees with our findings where grip strength was associated with incident T2DM in white but not black participants. However, it is also likely that the lack of association is explained by the low number of participants of black ethnicity included in our study (n=1775). Therefore, future studies with longer follow-up and a larger representation of non-white ethnic groups are needed.
The current study corroborates some of the findings reported from previous studies11–13 and extends them by being able to explore these associations stratified by sex in a large prospective cohort study. Moreover, this study also provides novel evidence on whether the association between grip strength and incident T2DM differs by sociodemographic and lifestyle factors. Previous studies have reported the magnitude of associations between some risk factors such as adiposity and grip strength with diabetes risk differs by ethnic groups.4 28 29 Although some of the mechanisms suggested for adiposity are linked to higher levels of ectopic fat in non-white ethnic groups, especially South Asians, the mechanism for grip strength has not been elucidated yet. The association between low grip strength and risk of diabetes was stronger in individuals aged <55 years, those who were normal weight, as measured by BMI, and white people. The higher risk of diabetes observed in individuals aged <55 years could be attributable to health-related factors, as below the age of 55 years the decline in grip strength is relatively modest, with this decline becomes more rapid after 55 years. Having a low grip strength at age <55 years is, therefore, likely to be indicative of future poor health outcomes and is thus could explain why a stronger association between diabetes and grip strength was observed in individuals aged <55 years. Risk differences among normal weight and obese individuals were only observed for absolute grip strength but not for relative strength, suggesting that the ratio between strength and body mass plays a role, as we know that individuals with higher body weight tend to have higher levels of grip strength compared with those who have lower body weight. Therefore, although individuals could be classified as normal weight, their low levels of strength put them at higher risk of diabetes. However, the association between grip strength and T2DM did not differ by sex, deprivation or physical activity levels. This is particularly of interest as people with lower socioeconomic status were also more vulnerable to risk factors.30
These findings have important clinical implications. Previous studies have suggested that grip strength is a strong predictor of cardiovascular risk and premature mortality.7 31 However, evidence regarding the prediction ability of grip strength for diabetes is limited. A recent study conducted in 5108 participants aged 20–80 years from the National Health and Nutrition Examination Survey has derived new grip strength cut-off points that could be used as a screening tool for diabetes risk in apparently healthy adults.25 However, future studies are needed to formally assess whether grip strength improves the prediction ability of the current risk score for T2DM. Moreover, this study has provided evidence that diabetes incidence rates for those with the lowest levels of relative grip strength are equivalent to someone in the highest quintile of grip strength but who were 23.0 and 34.5 years older, for women and men, respectively.
Strengths and limitations
The strengths of the present study include the large number of participants, which allow us to explore the associations between grip strength and T2DM risk as well as investigate potential interactions with other key sociodemographic and lifestyle-related factors. An extensive list of confounder factors in comparison with previous studies was also considered. Grip strength has a low cost and would, therefore, be relatively simple to implement into clinical practice. However, the present study is not exempt from limitations. The UK Biobank is not representative of the general population of the UK, including sociodemographic, physical, lifestyle and health-related characteristics of the general population. Although the evidence showed healthy volunteer selection bias, exposure–disease risk estimate should be generalized to the broader population.32 33 Reverse causation may still be possible even though a 2-year landmark analysis was conducted and individuals with chronic diseases at baseline were excluded. While our study cannot prove causality due to the observation nature of it, existing evidence from a Mendelian randomization study has reported a potential causal link of grip strength (genetically predicted) with insulin concentrations and insulin resistance.34
Conclusions
This study provides evidence that low grip strength is associated with a higher risk of incident T2DM in both men and women, independent of major confounding factors. Therefore, grip strength may be a practical approach to identify people who are at high risk of developing T2DM. However, further work is needed to define how to use grip strength in this manner.
Data availability statement
Data are available upon reasonable request. Data can be obtained upon request to UK Biobank.
Ethics statements
Ethics approval
The UK Biobank Study was approved by the North West Multi-Centre Research Ethics Committee (Ref 11/NW/0382 on June 17, 2011) and all participants provided written informed consent to participate in the UK Biobank Study. The study protocol is available online. This research has been conducted using the UK Biobank resource under application number 7155.
Acknowledgments
We are grateful to UK Biobank participants. This research has been conducted using the UK Biobank resource under application number 7155.
References
Supplementary materials
Supplementary Data
This web only file has been produced by the BMJ Publishing Group from an electronic file supplied by the author(s) and has not been edited for content.
Footnotes
FKH, SRG and CC-M are joint senior authors.
Twitter @carloscelism@
FKH, SRG and CC-M contributed equally.
Contributors JB, FKH, SRG, and CC-M contributed to the study conception and design, advised on all statistical aspects, and interpreted the data. JB, FKH, SRG, and CC-M performed the statistical analyses. JB, FKH, SRG, and CC-M drafted the manuscript. JB, SP-S, FP-R, GF, PW, JPP, NS, JMRG, FKH, SRG, and CC-M reviewed the manuscript and approved the final version to be published. JB, FKH, SRG, and CC-M are the guarantors of this work and, as such, had full access to all the data in the study and take responsibility for the integrity of the data and the accuracy of the data analysis.
Funding The authors have not declared a specific grant for this research from any funding agency in the public, commercial or not-for-profit sectors.
Competing interests None declared.
Provenance and peer review Not commissioned; externally peer reviewed.
Supplemental material This content has been supplied by the author(s). It has not been vetted by BMJ Publishing Group Limited (BMJ) and may not have been peer-reviewed. Any opinions or recommendations discussed are solely those of the author(s) and are not endorsed by BMJ. BMJ disclaims all liability and responsibility arising from any reliance placed on the content. Where the content includes any translated material, BMJ does not warrant the accuracy and reliability of the translations (including but not limited to local regulations, clinical guidelines, terminology, drug names and drug dosages), and is not responsible for any error and/or omissions arising from translation and adaptation or otherwise.