Article Text

Abstract
Introduction Enlarged adipose tissue is characterized by infiltration of activated immune cells and increased expression of chemokines recruiting these cells including C-C motif ligand 19 (CCL19), although the role of adipose CCL19 is still inconclusive.
Research design and methods Adipocyte-specific Ccl19 knock-in (KI) mice were generated, and the mice were fed either a normal diet or 40% or 60% fat diet (FD) to investigate the effects of CCL19 on the induction of inflammation and lipid metabolism.
Results Ccl19KI mice exhibited increased inflammatory signs in adipose tissue and enlarged subcutaneous white and brown adipose tissue than those of wild-type (WT) mice. The adipose tissue of Ccl19KI mice was characterized by increased extracellular signal-regulated kinase 1/2 and decreased AMP-activated protein kinase α phosphorylation. The protein expression of peroxisome proliferator-activated receptor γ coactivator 1α and uncoupling protein 1 was significantly reduced in brown adipose tissue of Ccl19KI mice compared with that in WT mice. The most remarkable changes between genotypes were observed in mice fed a 40% FD.
Conclusion A 40% FD enhanced the effects of CCL19 overexpression, and these mice could be a suitable model to study metabolic disorders in overweight Asians.
- adipokines
- inflammation
- obesity
Data availability statement
Data are available in a public, open access repository. All data relevant to the study are included in the article or uploaded as supplemental information.
This is an open access article distributed in accordance with the Creative Commons Attribution Non Commercial (CC BY-NC 4.0) license, which permits others to distribute, remix, adapt, build upon this work non-commercially, and license their derivative works on different terms, provided the original work is properly cited, appropriate credit is given, any changes made indicated, and the use is non-commercial. See: http://creativecommons.org/licenses/by-nc/4.0/.
Statistics from Altmetric.com
Significance of this study
What is already known about this subject?
A chemokine, C-C motif ligand 19 (CCL19) is highly expressed in inflamed adipose tissue.
Several publications have reported that CC-chemokine receptor 7 (CCR7), a receptor for CCL19, deficient mice are protected against high-fat diet-induced obesity and insulin resistance, while others did not.
What are the new findings?
Novel adipose-specific ‘Gain of function’ study revealed that CCL19/CCR7 pathway actually induced inflammatory signs and weight gain, and this effect was most prominent on 40% high-fat diet feeding.
Adipocyte CCL19 inhibited AMP-activated protein kinase α through activating extracellular signal-regulated kinase 1/2, resulting in impaired lipid metabolism and energy regulation.
How might these results change the focus of research or clinical practice?
Adipocyte-specific Ccl19 knock-in mice fed a 40% fat diet could be regarded as a suitable model representing early or mild pathological conditions of metabolic disease, and/or as overweighed subjects susceptible to metabolic disorders, such as in Asian populations.
The results may also suggest the potential for developing new therapeutic strategies for metabolic diseases by targeting CCL19.
Introduction
Adipose tissue secretes multiple biologically active molecules such as hormones and cytokines (known as adipokines). Normal adipocytes secrete anti-inflammatory adipokines to attenuate inflammation and play essential roles in controlling whole body metabolism.1 2 Pathophysiological features of overweight and/or obesity are adipose tissue inflammation and infiltration of activated immune cells, such as macrophages.1 In adiposity, the ability of adipocytes to function as endocrine cells is affected. These results in the increased production of inflammatory cytokines and chemokines.1–3 We previously reported that co-culture of adipocytes and endotoxin-stimulated macrophages significantly increase the expression of C-C motif ligand 19 (CCL19), and the expression of this chemokine was one of the highest among all chemokines produced from adipocytes examined to date.4 CCL19 is highly expressed in stromal cells located in the T cell region of the lymphatic endothelium and lymph nodes and recruits mature dendritic cells to the lymphatic endothelium.5 The receptor for CCL19, CC-chemokine receptor 7 (CCR7), is mainly expressed in mature dendritic cells, T cells, and proinflammatory macrophages.6 Cell signaling mediated via CCR7 regulates survival, chemotaxis, and actin dynamics.7 Our previous findings showed that CCR7-deficient mice were protected against high-fat diet (HFD)-induced obesity and insulin resistance.8 Thus, CCL19/CCR7 signaling may affect not only the induction of inflammation-induced insulin resistance but also energy metabolism.
The chemokine CCL21 is another known ligand for CCR7. CCL19 and CCL21 display a low sequence homology limited to 32% identity. The structural differences between these ligands can cause subsequent differences in cellular responses following CCR7 binding.9 10 Accordingly, it is difficult to determine whether an observed phenomenon is related to complete loss of CCR7-mediated signaling induced by adipose-derived CCL19.
Several publications by other groups have reported that CCR7-null mice are protected against HFD-induced insulin resistance.11 12 Regarding the weight gain, several studies have reported that CCR7-null mice do not gain weight on HFD compared with wild-type (WT) mice.11 Whereas, different studies have reported that CCR7-null and WT mice similarly gain weight on HFD.12 13 These results indicate that the mechanism inducing inflammation-driven insulin resistance and energy metabolism, which could potentially be influenced by adipose tissue inflammation, differs. Nevertheless, epidemiological studies have shown that serum CCL19 levels are elevated in individuals with obesity.14 Furthermore, adipose tissue CCL19 expression correlates with body mass index (BMI), HbA1c, C reactive protein, homeostasis model assessment of insulin resistance (HOMA-IR), interleukin (IL)-12, and CCL5.15 These results suggest that the expression of CCL19 in adipose tissue may play important roles in the pathophysiology of obesity-related metabolic disorders. To elucidate the roles of CCL19 in adipose inflammation, one could use mice with congenital deficiencies in both CCL19 and CCL21, also known as plt mice.16 However, although plt mice have delayed initial cellular responses on immunization, they exhibit enhanced immune responses.17 Furthermore, because there are 11 reported pseudogenes located near Ccl19, adipocyte-specific homologous recombination is challenging.
CCR7-mediated signals suppress AMP-activated protein kinase (AMPK) activation through extracellular signal-regulated kinase (ERK) 1/2 in dendritic cells.18 Inhibition of the ERK pathway improves insulin resistance via AMPK activation in skeletal muscle.19 In adipose tissue, AMPK is involved in lipid metabolism and thermogenesis.20 21 AMPKα-Thr172 phosphorylation is required for AMPK activation.22 Moreover, AMPK also regulates mitochondrial biogenesis by activating peroxisome proliferator-activated receptor γ coactivator 1α (PGC1α).23 PGC1α is a critical transcriptional activator that regulates the number of genes involved in various metabolic pathways, such as fatty acid synthesis, oxidation, and gluconeogenesis. Furthermore, PGC1α stimulates uncoupling protein 1 (UCP1) expression and increases the number of mitochondria and mitochondrial oxidative capacity.24 25 Suppression of adipose PGC1α results in systemic insulin resistance and obesity-associated inflammation.26 However, the role of adipocyte-derived CCL19 in energy metabolism is largely unknown.
To investigate the effects of CCL19 on the induction of inflammation and energy metabolism, a ‘gain-of-function’ study is an alternative approach to a ‘loss-of-function’ study. Therefore, in this study, we generated adipose-specific Ccl19 knock-in (KI) mice. To further examine the effects of adipose tissue CCL19 on both glucose and lipid metabolism, we fed the mice a 40% or 60% fat diet (40% FD, 60% FD) and compared them with those fed a normal diet (ND) containing 13.6% fat per calorie. The 40% FD resembles the westernized Asian diet. Our findings revealed the novel roles of adipocyte CCL19, which not only influences adipose tissue inflammation but also affects lipid metabolism, potentially contributing to weight gain.
Research design and methods
Cell culture
Bone marrow cells were collected after gradient centrifugation of bone marrow cells from both femur and tibia in 8-week-old to 10-weekold mice and then cultured in Roswell Park Memorial Institute (RPMI) 1640 medium supplemented with 10% fetal bobine serum (FBS), 1% penicillin/streptomycin, and 20 ng/mL granulocyte macrophage colony-stimulating factor (GM-CSF) for 7 days for differentiation into bone marrow-derived dendritic cells (BMDCs).27 Murine 3T3-L1 preadipocytes (American Type Culture Collection, Manassas, Virginia, USA) were differentiated into adipocytes using differentiation medium containing 4 µg/mL dexamethasone, 0.5 mM 3-isobutyl-1-methylxanthine, 200 nM insulin, and 10% FBS for 48 hours, as previously.28 Cells were fed Dulbecco’s Modified Eagle’s Medium (DMEM) supplemented with 10% FBS and 1 µM insulin every other day and used as mature adipocytes on day 12 after the induction of differentiation.
Flow cytometry analysis
For flow cytometry analysis, mouse BMDCs were seeded in a 6-well plate at a density of 0.5×10⁶ cells/well. Treated cells were centrifuged at 300g for 5 min and washed with stain buffer (BD Pharmingen, San Diego, California, USA). Prior to the surface staining, Fc-block was performed using mouse TruStain FcX (BioLegend) for 5 min at room temperature. Subsequently, cells were stained with anti-mouse antibodies (PE-CD11c, FITC-A/I-E, and APC-CD197, BioLegend). Isotype controls were used to confirm antibody specificity. Cells were incubated in the dark for 30 min at 4°C and analyzed using a BD FACSVerse flow cytometer (BD Biosciences, San Diego, California, USA). Dead cells were excluded based on their forward and side scatter or uptake of 7-aminoactinomycin D (Immunostep, Salamanca, Spain). The data were analyzed using FlowJo (BD Biosciences) software.
Animals and diets
C57BL/6 mice were purchased from The Jackson Laboratory (Bar Harbor, Maine, USA). Male Ccl19KI mice and their male WT littermates were fed an ND (13.6% fat content) (CRF-1, Oriental Yeast, Tokyo, Japan) from the age of 4 weeks. In the experiments using HFD, mice were fed a 40% FD or 60% FD (HFD-40, HFD-60, Oriental Yeast) for 8 weeks. Mouse tissue samples were collected following intraperitoneal injection of a mixed anesthetic (0.3 mg/kg medetomidine, 4.0 mg/kg midazolam, and 5.0 mg/kg). Inguinal and anterior subcutaneous white adipose tissues were collected and weighed as subcutaneous adipose tissue (SAT). Epididymal and retroperitoneal white adipose tissues were collected and weighed as visceral adipose tissue (VAT). Inguinal and epididymal adipose tissue was used as white adipose tissue in the expression analysis. Regarding the brown adipose tissue (BAT), interscapular adipose tissue was weighed and used in the expression analysis. All mice were housed under climate-controlled conditions with a 12-hour light/dark cycle and with food and water ad libitum.
Generation of Ccl19KI mice
Mice in which Ccl19 gene was knocked into Adipoq gene locus (Ccl19KI mice) were generated at Laboratory Animal Resource Center, University of Tsukuba. Ccl19KI mice were generated by CRISPR/Cas9-mediated homologous recombination in mouse zygotes without disrupting the endogenous Adipoq gene in the same way as described previously (online supplemental figure 1).29 For PCR screening, DNA was extracted from founder (F0) mice tail samples. Primers for genotyping were Ccl19 Adipoq F: 5′-gacaaggccgttctcttcac-3′, Ccl19 Adipoq R: 5′-cccccataccaaatgtgatt-3′, and rGpA screening Fw: 5′-atgccctggctcacaaatac-3′. F0 mice were crossed with WT C57BL/6J mice to generate F1 mice and subjected to PCR analysis and western blotting to check transgene expression and CCL19 protein expression in adipose tissue.
Supplemental material
Palmitic acid injection into mice
Palmitic acid (PA) was solubilized in 0.1 N sodium hydroxide and combined with 10% fatty acid-free bovine serum albumin (BSA). Mice were injected with 500 µL solution of 3 mM PA or BSA vehicle control intraperitoneally, referring to the method already reported.30 31 Twelve hours after the administration, samples were collected.
GTTs and ITTs
For glucose tolerance tests (GTTs), mice were injected glucose (2 g/kg body weight) intraperitoneally after 16 hours of fasting at 15 weeks of age. For insulin tolerance tests (ITTs), mice were injected insulin (0.75 U/kg body weight) intraperitoneally after 6 hours of fasting at 16 weeks of age. Blood was collected 15, 30, 60, 90, and 120 min after the injection. Blood glucose concentrations were determined with a glucometer (Medisafe, Terumo, Tokyo, Japan).
Quantitative real-time PCR
Total RNA was extracted from the cells and tissues homogenized in ISOGEN II (Nippon Gene, Tokyo, Japan). The RNA quantity and purity were assessed using a NanoDrop (Thermo Fisher Scientific, Waltham, Massachusetts, USA). Reverse transcription was performed using Prime Script RT Master Mix (Takara Bio, Otsu, Japan). The protocol for the reverse transcription cycle was 42°C for 30 min and 95°C for 2 min. RT-PCR was performed using KAPA SYBRFAST qPCR Kit (Nippon Genetics, Tokyo, Japan) and StepOnePlus Real-Time PCR System (Applied Biosystems, Foster City, California, USA). PCR was carried out in two steps, the first at 95°C for 5 s and the second at 60°C for 30 s, which were then repeated 40 times. Relative mRNA genes were normalized to the Gapdh mRNA level and relative expression levels were calculated using the ΔΔCt method. Primers are listed in online supplemental table 1.
Histological analysis
Tissue samples were fixed in 4% paraformaldehyde solution. The paraffin-embedded sections were stained with hematoxylin and eosin by standard procedures for histological analysis or stained for CCR7, CD11c, and F4/80 protein by immunohistochemistry. For immunohistochemistry, anti-CCR7 (1:150; MyBioSource, San Diego, California, USA), anti-CD11c (1:350; Cell signaling Technology, Beverly, Massachusetts, USA), and anti-F4/80 (1:500; Abcam, Cambridge, UK) antibodies were used. Adipocyte and droplet sizes were measured using a microscope (BZ-9000, Keyence BZ-X Analyzer).
Immunofluorescence staining
Immunofluorescence staining was performed as described previously.32 Briefly, paraffin-embedded tissues of mice samples were cut into 3 µm sections and they were dewaxed in xylene and rehydrated in graded ethanol solutions. Antigen retrieval was performed with citrate buffer (6 pH) for 10 minutes at 95°C. Sections rinsed in PBS for 5 min. Non-specific labeling was blocked by incubation with 1% BSA at room temperature for 30 min. Sections were then incubated with anti-CD11c (1:200; Cell signaling Technology) and anti-F4/80 (1:200; Abcam) primary antibodies at 4°C overnight. Subsequently, Alexa Fluor 488 goat anti-rabbit IgG (1:200; Abcam) and Alexa Fluor 647 goat anti-rat IgG (1:200; Abcam) were used as secondary antibodies for 2 hours in the dark at room temperature. The nucleus was stained using SlowFade Diamond Antifade Mountant with DAPI (Life Technologies, Waltham, Massachusetts, USA). The samples were visualized by Keyence BZ-9000. All images were analyzed by Keyence BZ-X Analyzer software.
Western blot analysis
Western blot was performed as described previously.33 Briefly, equal amounts of protein were resolved by SDS-PAGE and transferred to polyvinylidene difluoride membranes. The membranes were incubated overnight at 4°C with specific antibodies: anti-ERK1/2 (Cell Signaling Technology), anti-phospho-ERK1/2 (Thr202/Tyr204) (Cell Signaling Technology), anti-AMPKα (Cell Signaling Technology), phospho-AMPKα (Thr172) (Cell Signaling Technology), anti-β-actin (Cell Signaling Technology), anti-PGC1α (Santa Cruz Biotechnology, Dallas, Texas, USA), anti-UCP1 (Abcam), anti-CCL19 (R&D Systems, Minneapolis, Minnesota, USA), and anti-CCR7 (MyBioSource). After incubation with secondary antibodies (HRP-conjugated anti-rabbit and anti-mouse, Cell Signaling Technology), immunoreactive proteins were visualized using enhanced chemiluminescence (Chemi-Lumi One Super, Nacalai Tesque Kyoto, Japan) and signals were analyzed using ImageQuant LAS4000 (GE Healthcare, Chalfont, UK). Blot bands were quantified by densitometry using Image J software (National Institute of Health, Bethesda, Massachusetts, USA).
Enzyme-linked immunosorbent assay
Serum levels of insulin were measured with Mouse Insulin ELISA Kit (Morinaga Institute of Biological Science, Yokohama, Japan, detection range: 0.156–10 ng/mL). The intra-assay and inter-assay coefficient of variations (CVs) were 9% and 10%, respectively. Serum free fatty acid (FFA) levels were measured using Free Fatty Acid Assay Kit (Cell Biolabs, San Diego, California, USA; detection range: 7.81–500 µM). The intra-assay and inter-assay CVs were 6% and 8%, respectively. Serum adiponectin levels were measured using ELISA kit (Mouse/Rat High Molecular Weight Adiponectin ELISA Kit, Shibayagi, Gunma, Japan, detection range: 3.13–200 ng/mL). The intra-assay and inter-assay CVs were 7% and 8%, respectively. Serum CCL19 levels were measured with MIP-3 beta Mouse ELISA Kit (Thermo Fisher Scientific; detection range: 4.1–1000 pg/mL). The intra-assay and inter-assay CVs were 7% and 9%, respectively. These assays were performed according to the manufacturer’s instructions. Absorbances were determined using a microplate reader (Multiskan FC, Thermo Fisher Scientific).
Statistical analysis
Data are presented as mean±SD. Statistical comparisons of data from two groups were performed using Student’s t-test. Statistical analyses for comparing three or more groups were performed using one-way analysis of variance followed by Tukey’s post hoc test using JMP Pro 15 (SAS Institute Japan, Tokyo, Japan). Values of p<0.05 were considered statistically significant.
Results
Palmitic acid treatment increased the number of CCR7-positive cells and activated proinflammatory signaling in vitro and in vivo
We first examined whether any inflammatory stimulation or saturated fatty acids upregulated CCR7 expression. Among PA, endotoxin, and tumor necrosis factor α (TNFα), PA significantly upregulated Ccr7 mRNA expression in mouse BMDCs (figure 1A), as previously reported.12 27 Flow cytometry analysis revealed that PA stimulation increased the proportion of MHCII+CD11c+CCR7+ BMDCs (figure 1B). Therefore, we next investigated the effects of PA on CCR7 expression in vivo. In the experiments involving PA administration to mice, the serum FFA concentration was designed to mimic the FFA concentration in individuals with obesity.34 Serum FFA concentrations were significantly higher in PA-treated mice than in mice treated with vehicle (figure 1C). Furthermore, PA increased the expression of CCR7 (figure 1D and E), Monocyte chemotactic protein 1 (Mcp1), Tnfα, Il12, and Cd11c in inguinal white adipose tissue (iWAT) (figure 1F) and epididymal white adipose tissue (eWAT) (figure 1G) of C57BL/6 mice compared with those in vehicle-treated mice. Overall, HFD feeding increased the number of CCR7-positive cells and activated proinflammatory signals in mouse adipose depots.

Effects of palmitic acid (PA) on CCR7 expression and proinflammatory signaling in adipose tissue of C57BL/6 mice. (A, B) Effects of PA on CCR7 expression in BMDCs. (A) Ccr7 mRNA expression level following 6-hour stimulation with PA (100 µM), E. coli LPS (100 ng/mL), and rmTNFα (100 ng/mL) in BMDCs. Fold changes in the expressions of each gene relative to Gapdh were determined by RT-PCR (n=3). (B) Flow cytometry analysis of CCR7 expression in CD11c+MHCII+ BMDCs treated with vehicle (BSA) or vehicle+PA for 24 hours. (C–G) Effects of PA on CCR7 expression in adipose tissue of C57BL/6 mice. All mice were fed with a normal diet (ND) after weaning. Tissue and blood samples were harvested 12 hours after a single intraperitoneal injection of PA or vehicle (BSA). (C) Serum FFA concentration was measured by ELISA as described in ‘Research design and methods’ section. (D) Immunohistochemical analysis of CCR7 expression. Positive area appears brown color (black arrows). Images were representative from three samples of each group. Scale bar, 100 µm for 40× magnification. (E) Quantification of CCR7-positive area of immunohistochemical analysis. (F, G) Relative expression level of proinflammatory-related genes in iWAT (F) and eWAT (G) was determined by RT-PCR. Data are expressed as fold changes in the expressions of each gene relative to Gapdh. n=3–4 per group. Data are expressed as mean (SD). *p<0.05, **p<0.01, ***p<0.001. BMDCs, bone marrow-derived dendritic cells; BSA, bovine serum albumin; CCR7, CC-chemokine receptor 7; eWAT, epididymal white adipose tissue; FFA, free fatty acid; iWAT, inguinal white adipose tissue; LPS, lipopolysaccharide; TNF-α, tumor necrosis factor α.
Ccl19KI mice had significant enlargement of adipose tissues and 40% FD feeding-induced insulin resistance
Next, we generated adipocyte-specific CCR7 ligand CCL19 overexpressing (Ccl19KI) mice (figure 2A, online supplemental figure 1) to investigate the roles of the adipocyte CCL19/CCR7 signaling in insulin resistance and other metabolic disorders. The experiment was conducted from the standpoint of ‘gain of function’, and the mice were fed HFDs with different percentages of fat. Food intake did not vary between genotypes regardless of diet (figure 2C). Serum CCL19 concentrations were 6-fold to 10-fold higher in Ccl19KI mice than in WT mice in all test groups (figure 2B). This confirmed that CCL19 protein produced in adipocytes was released into the circulation.

Characteristics of adipocyte-specific CCL19-overexpressing (Ccl19KI) mice. (A, B) CCL19 protein expression in adipose tissues and serum CCL19 concentration in Ccl19KI mice. (A) Western blot analysis of CCL19 expression in inguinal white adipose tissue (iWAT), epididymal white adipose tissue (eWAT), interscapular brown adipose tissue (BAT), and liver. (B–O) The effects of different proportion of fat-containing diet feeding on mice phenotypes. All mice were fed with a normal diet (ND) up to 7 weeks after weaning. From 7 weeks of age, mice were fed an ND, a 40%, or a 60% fat diet (40% FD, 60% FD) for 8 weeks. (B) Serum CCL19 concentration was measured by ELISA as described. (C) Mean daily food intake was recorded by subtracting the amounts of food left in the cage from the daily amounts given. (D–G) Changes in body weight (D–F) and tissue weight at 15 weeks (G). (H) Serum FFA concentration was measured as described. (I, J) Fasting blood glucose (I) and insulin (J) levels in each test group. (K–P) Glucose tolerance tests (GTTs) and insulin tolerance tests (ITTs) were performed in each group as described in ‘Research design and methods’ section. n=5–8 per group. Data are expressed as mean (SD). *p<0.05, **p<0.01, ***p<0.001. AUC, area under the curve; CCL19, C-C motif ligand 19; KI, knock-in; SAT, subcutaneous adipose tissue; VAT, vascular adipose tissue; WT, wild type.
Although there were no significant differences in total body weight between ND-fed WT and Ccl19KI mice, the SAT was significantly increased in Ccl19KI mice (figure 2D,G). In the 40% FD group, Ccl19KI mice gained significantly more total body weight, as well as SAT and VAT than WT mice did (figure 2E,G). In the 60% FD group, Ccl19KI mice were significantly increased than WT mice for the first 3 weeks. However, no differences were observed after 11 weeks of age (figure 2F). Neither the liver (figure 2G) nor spleen (data not shown) differed in weight between WT and Ccl19KI mice, regardless of diet. Ccl19KI mice showed a significant increase in serum FFA concentration compared with that of WT mice regardless of diet (figure 2H). There were no significant differences in adiponectin expression and serum adiponectin levels between WT and Ccl19KI mice in each diet group. As expected, in 60% FD groups, adiponectin expression levels in BAT and serum adiponectin levels were significantly reduced when compared with those of ND-fed mice (online supplemental figure 3).
There were no significant differences in the fasting blood glucose levels between WT and Ccl19KI mice regardless of diet (figure 2I). In the 40% FD group, fasting insulin levels in Ccl19KI mice were significantly higher than in WT mice (figure 2J). Compared with WT mice fed an identical diet, Ccl19KI mice fed a 40% FD (figure 2M) or 60% FD (figure 2O) had impaired glucose tolerance, with approximately 1.3-fold increase in the area under the curve. ITTs showed that insulin sensitivity was significantly impaired in Ccl19KI mice fed a 40% FD compared with that in WT mice (figure 2N). In the 40% FD group, the HOMA-IR of Ccl19KI mice was significantly higher than that of WT mice, while in the other diet groups there observed no significant differences between Ccl19KI mice and WT mice (online supplemental figure 5). Overall, the results suggested that CCL19 overexpression caused enlargement of adipose tissue, increased serum FFA concentrations, and enhanced the risk of insulin resistance. Notably, these phenotypical changes were only observed in Ccl19KI mice fed a 40%FD.
Adipocyte CCL19 overexpression increased adipocyte size in mice fed a 40% FD
Next, the morphology of each adipose tissue was examined. The average size of inguinal adipocytes and lipid droplets in BAT was significantly larger in the ND Ccl19KI mice than in the WT mice (figure 3A, B and D, and online supplemental figure 2A). Ccl19KI mice fed a 40% FD had approximately 1.7 and 1.9 times larger inguinal adipocytes and lipid droplets in BAT, respectively, than WT mice (figure 3A, B and D). Conversely, no significant differences were observed between genotypes for mice fed a 60% FD (figure 3A–D).

Effects of CCL19 overexpression on adipocyte size. All mice were fed with a normal diet (ND) up to 7 weeks after weaning. From 7 weeks of age, mice were fed an ND, a 40%, or a 60% fat diet (40% FD, 60% FD) for 8 weeks. (A) Representative images of H&E-stained adipose tissue sections. Scale bar, 100 µm for 40× magnification. (B, C) Average adipocyte sizes of iWAT (B) and eWAT (C) were measured in four randomly chosen microscopic areas from three animals per group using a microscope. (D) Average lipid droplet sizes of bat were measured in four randomly chosen microscopic areas from three animals per group using a microscope. Note that the differences in adipocyte size and lipid droplet size between WT and Ccl19KI mice were most pronounced in groups fed a 40% FD. Data are expressed as mean (SD). *p<0.05, ***p<0.001. BAT, brown adipose tissue; CCL19, C-C motif ligand 19; eWAT, epididymal white adipose tissue; iWAT, inguinal white adipose tissue; WT, wild type.
Ccl19KI mice had increased infiltration of CCR7-positive, CD11c-positive, and F4/80-positive cells in adipose tissues
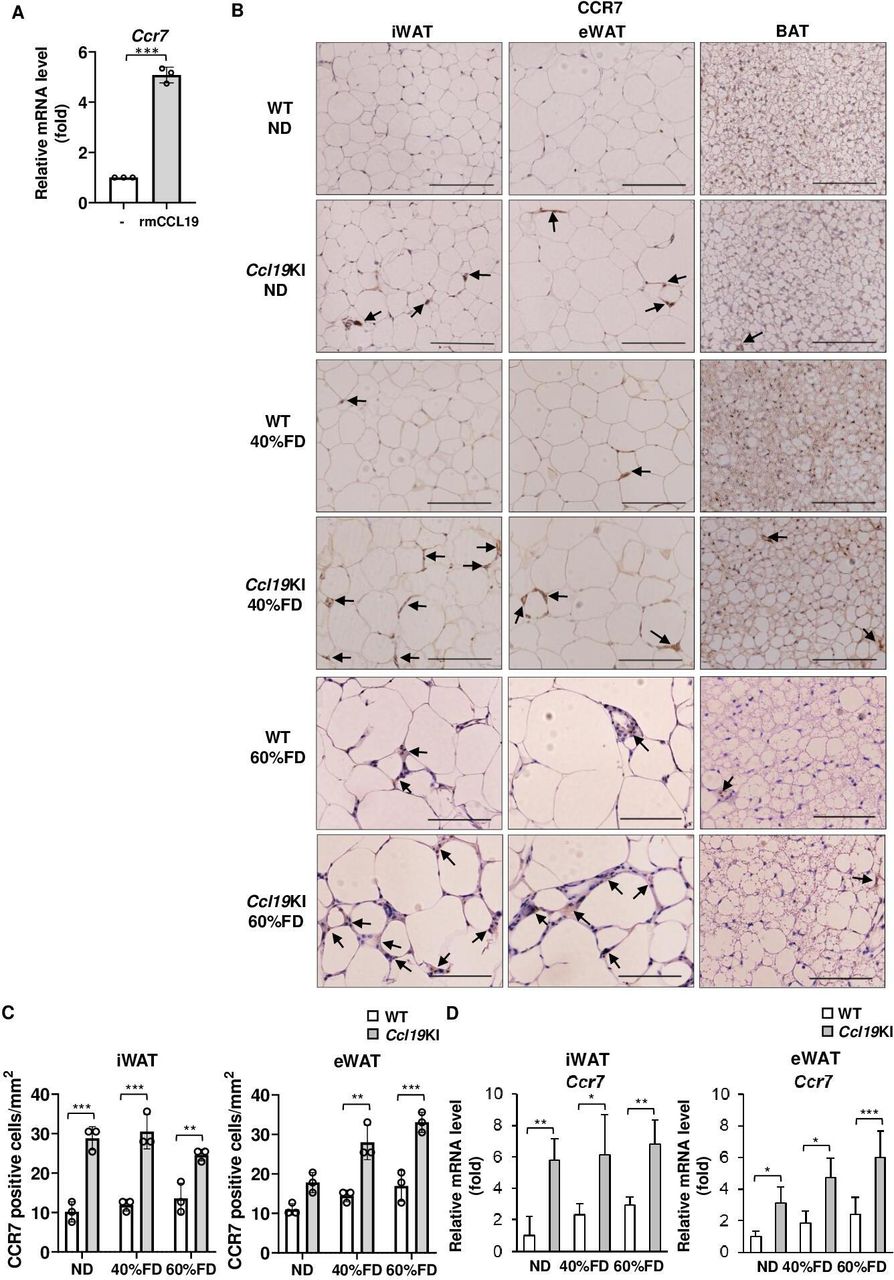
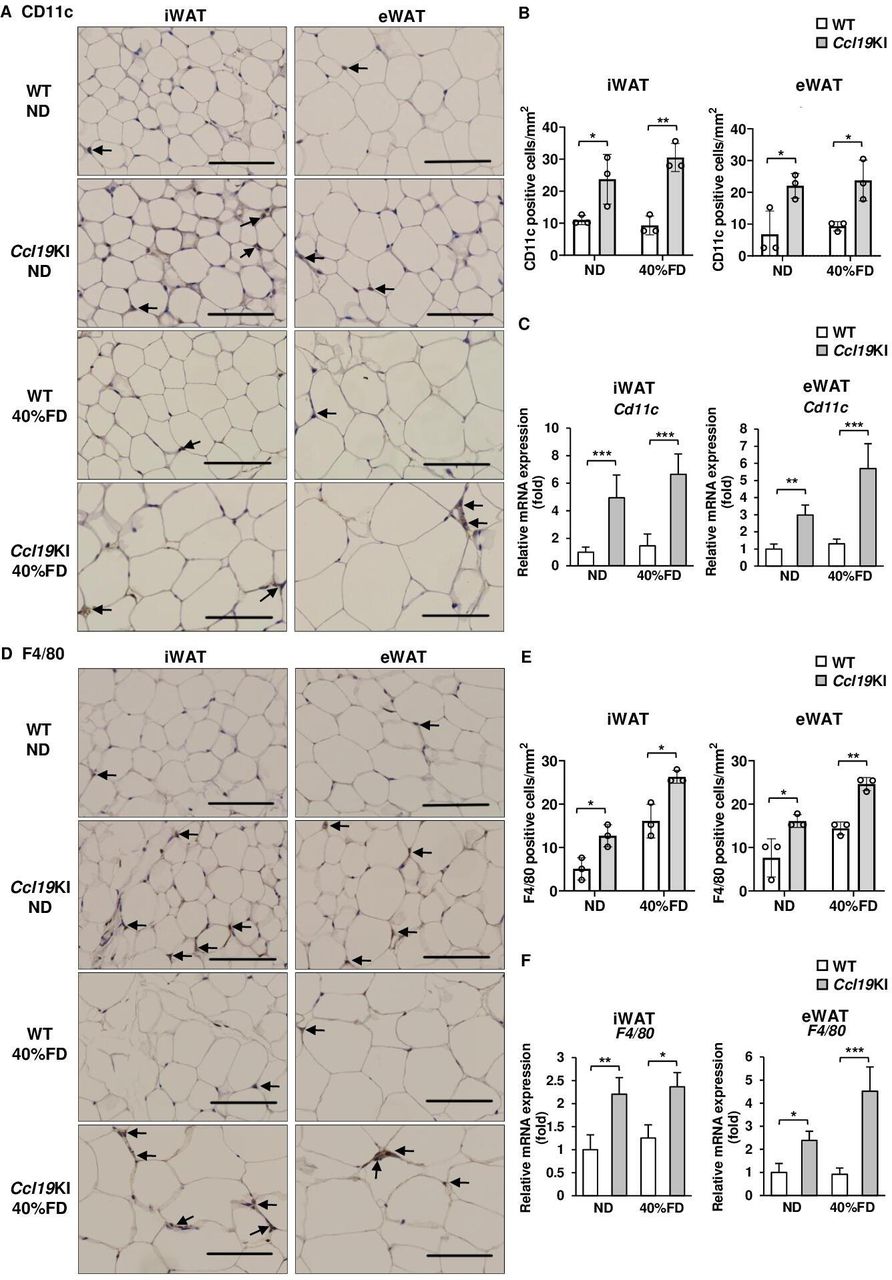
Besides PA, rmCCL19 also upregulated Ccr7 mRNA expression in mouse BMDCs (figure 4A). Therefore, we next investigated CCR7 expression in adipose tissues of Ccl19KI mice. The iWAT and eWAT of Ccl19KI mice had increased infiltration of CCR7-expressing cells regardless of diet (figure 4B,C). ND-fed WT mice had almost no CCR7-positive cells in their adipose tissues. However, the number of CCR7-positive cells increased on fed a 60% FD (figure 4B,C). The expression of Ccr7 was also significantly increased in iWAT and eWAT of Ccl19KI mice compared with that in WT mice in all diet groups (figure 4D). We next investigated the expression of CD11c, mainly expressed on dendritic cells and proinflammatory M1 macrophages, and the macrophage marker F4/80, to determine infiltration into adipose tissues. CD11c-positive and F4/80-positive cell infiltration was increased in the iWAT and eWAT, respectively, of Ccl19KI mice compared with that in WT mice (figure 5A, B, D and E). The expression of Cd11c and F4/80 was also increased significantly in the iWAT and eWAT of Ccl19KI mice compared with that in WT mice (figure 5C,F). Localization of CD11c and F4/80 in the iWAT and eWAT was analyzed by immunofluorescence staining. It was shown that CD11c+F4/80neg-low cells, CD11cneg-lowF4/80+ cells, and CD11c+F4/80+ cells were increased in Ccl19KI mice in both ND and 40% FD groups compared with WT mice (online supplemental figure 4). Here, many CD11c+F4/80neg-low cells (mature DCs) were observed in iWAT and eWAT of 40% FD-fed Ccl19KI mice. Overall, these results suggested that high expression of CCL19 induced CD11c-positive dendritic cell and macrophage infiltration into adipose tissues.

Infiltration of CCR7-positive cells in the adipose tissue of Ccl19KI and WT mice fed with each diet. (A) Expression level of Ccr7 in BMDCs treated with 10 ng/mL recombinant mouse (rm) CCL19 for 6 hours. Ccr7 mRNA levels were determined by RT-PCR. n=3 per group. Data are expressed as fold changes in the expressions of each gene relative to Gapdh. B–D) All mice were fed with a normal diet (ND) up to 7 weeks after weaning. From 7 weeks of age, mice were fed an ND, a 40%, or a 60% fat diet (40% FD, 60% FD) for 8 weeks. Images of immunohistochemical staining for CCR7 of adipose tissue are shown. Positive area appears brown color (black arrows). Images were representative from three samples of each group. Scale bar, 100 µm for 40× magnification. (C) Quantification of CCR7-positive cells of immunohistochemical staining (n=3 per group, with three random fields per animal). (D) Relative mRNA expression level of Ccr7 in iWAT and eWAT of WT and Ccl19KI mice was measured by RT-PCR. Data are expressed as fold changes in the expressions of each gene relative to Gapdh (n=3–5). Data are expressed as mean (SD). *p<0.05, **p<0.01, ***p<0.001. BAT, brown adipose tissue; BMDCs, bone marrow-derived dendritic cells; CCL19, C-C motif ligand 19; CCR7, CC-chemokine receptor 7; eWAT, epididymal white adipose tissue; iWAT, inguinal white adipose tissue; WT, wild type.

Expression of CD11c and F4/80 in the adipose tissue of WT and Ccl19KI mice fed with each diet. All mice were fed with a normal diet (ND) up to 7 weeks after weaning. From 7 weeks of age, mice were fed an ND, a 40%, or a 60% fat diet (40% FD, 60% FD) for 8 weeks. (A, D) Images of immunohistochemical staining for CD11c (A) and F4/80 (D) of iWAT and eWAT are shown. Positive area appears brown color (black arrows). Images were representative from three samples of each group. Scale bar, 100 µm for 40× magnification. (B, E) Quantification of CD11c (B) and F4/80 (E) positive cells of immunohistochemical staining (n=3 per group, with three random fields per animal). (C, F) Relative mRNA expression level of Cd11c (C) and F4/80 (F) in iWAT and eWAT of WT and Ccl19KI mice was measured by RT-PCR. Data are expressed as fold changes in the expressions of each gene relative to Gapdh (n=3–5). Data are expressed as mean (SD). *p<0.05, **p<0.01, ***p<0.001. CCL19, C-C motif ligand 19; eWAT, epididymal white adipose tissue; iWAT, inguinal white adipose tissue; KI, knock-in; WT, wild type.
Proinflammatory signals were upregulated in the iWAT and eWAT of Ccl19KI mice, and PA administration further enhanced these effects
We next examined the gene expression of inflammatory cytokines associated with insulin resistance. The expression of Mcp1 and Tnfα was significantly increased in iWAT and eWAT of Ccl19KI mice compared with that in WT mice (figure 6A,B). As shown in figure 1, PA promoted the expression of CCR7 and activated inflammatory signaling in the iWAT and eWAT in C57BL/6 mice. Serum FFA concentrations were significantly higher in Ccl19KI mice than in WT mice (figure 2H). Thereafter, we examined whether exogenous administration further elevated serum PA concentrations in these mice. PA administration further increased serum FFA concentrations in both genotypes, although the increase was more profound in the Ccl19KI mice than in WT mice (figure 6D). PA-treated Ccl19KI mice exhibited higher expression of CCR7 (figure 6C,E) and mRNA levels of Mcp1, Tnfα, and Cd11c in the iWAT and eWAT than those in WT mice. To summarize, proinflammatory signals were increased in the iWAT and eWAT of Ccl19KI mice, and PA administration further enhanced the expression of these signaling molecules.

Expression of proinflammatory-related gene in iWAT and eWAT of Ccl19KI mice, and the effects of PA injection on these gene expression. All mice were fed with a normal diet (ND) after weaning. (A, B) Relative mRNA expression level of Mcp1 and Tnfα in iWAT (A) and eWAT (B) of WT and Ccl19KI mice was measured by RT-PCR. Data are expressed as fold changes in the expressions of each gene relative to Gapdh (n=3–5). (C–G) Tissue and blood samples of WT and Ccl19KI mice were collected 12 hours after a single intraperitoneal injection of palmitic acid (PA). (C) Serum FFA concentration was measured by the method as described. (D) Images of immunohistochemical staining for CCR7 of adipose tissue. Positive area appears brown color. Images were representative from three samples of each group. Scale bar, 100 µm for 40× magnification. (E) Quantification of CCR7-positive cells of immunohistochemical staining (n=3 per group, with three random fields per animal). (F, G) Relative expression level of proinflammatory-related genes in iWAT (F) and eWAT (G) was determined by RT-PCR. Data are expressed as fold changes in the expressions of each gene relative to Gapdh (n=3–5). Note PA injection further enhanced the effects of CCL19. n=3 to 5 per group. Data are expressed as mean (SD). *p<0.05, **p<0.01, ***p<0.001. BSA, bovine serum albumin; CCL19, C-C motif ligand 19; CCR7, CC-chemokine receptor 7; eWAT, epididymal white adipose tissue; FFA, free fatty acid; iWAT, inguinal white adipose tissue; KI, knock-in; TNF-α, tumor necrosis factor α; WT, wild type.
Ccl19KI mice exhibited inhibition of AMPKα and activation of ERK1/2 in adipose tissue and impaired regulation of lipid metabolism
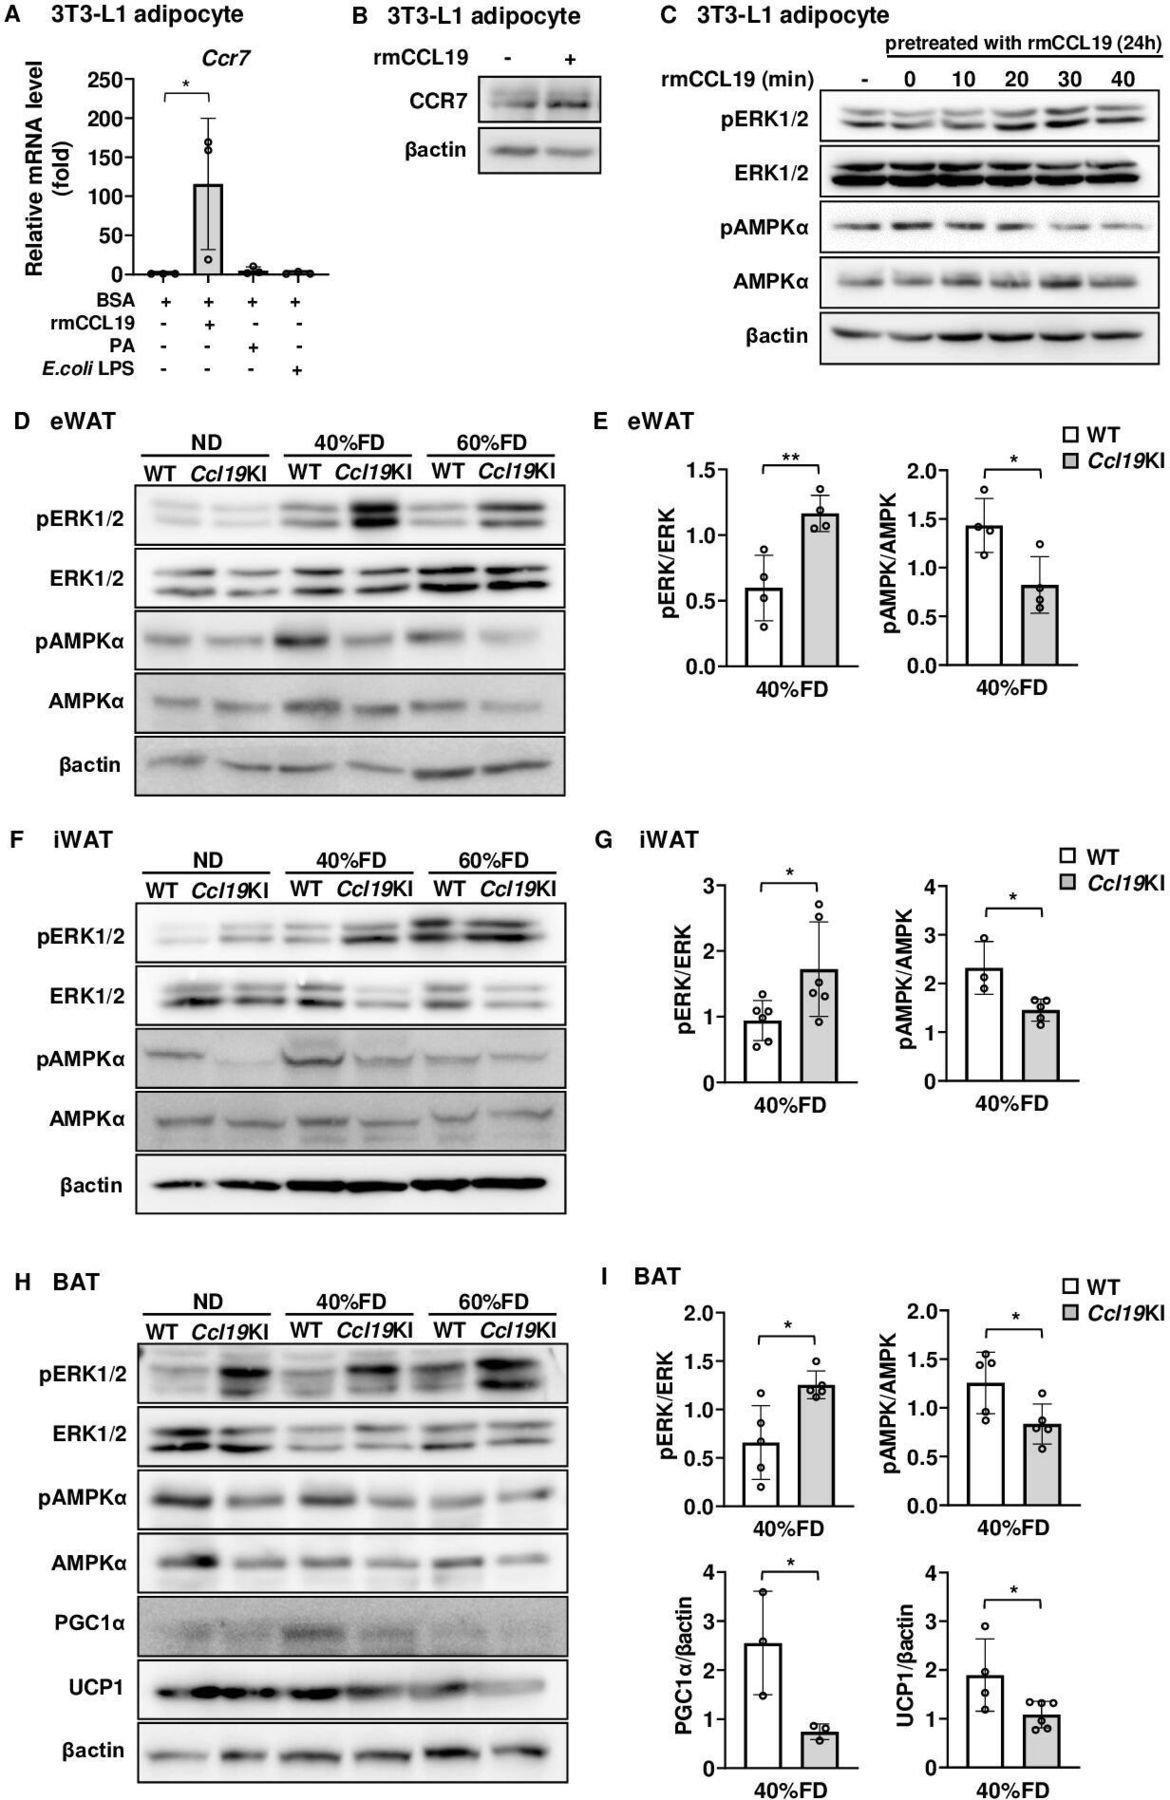
As shown in figure 4, CCL19 upregulated Ccr7 mRNA in BMDCs. Thus, we next evaluated whether CCL19 also upregulated CCR7 expression in adipocytes. CCL19 stimulation significantly increased CCR7 expression in 3T3-L1 adipocytes at both the gene and protein levels (figure 7A,B). Furthermore, stimulation of 3T3-L1 adipocytes with CCL19 increased the amount of phospho-ERK1/2 and decreased the level of phospho-AMPKα in these cells (figure 7C). Ccl19KI mice exhibited enlarged SAT and BAT than those of WT mice (figures 2D–G and 3). Increased expression of CCL19 in adipocytes may affect fat accumulation and energy expenditure. As shown in figure 7C, ERK1/2 and AMPKα phosphorylation levels were driven in a reciprocal way in CCL19-stimulated 3T3-L1 adipocytes.

Effects of CCL19 on thermogenesis-related molecular activation in vitro and in vivo. (A) Ccr7 mRNA expression level 12 hours after stimulation with rmCCL19 (10 ng/mL), PA (100 µM), or E. coli LPS (100 ng/mL) in differentiated 3T3-L1 adipocytes was determined by RT-PCR. Data are expressed as fold changes in the expressions of each gene relative to Gapdh (n=3). (B, C) Differentiated 3T3-L1 adipocytes were treated with 10 ng/mL rmCCL19 for 24 hours. (B) The protein expression level of CCR7 was measured by immunoblotting using the corresponding antibodies as described in ‘Research design and methods’ section. Representative blots are shown. (C) Cells were re-stimulated with rmCCL19 for indicated times. The protein expression levels of ERK1/2, AMPKα, the phospho-ERK1/2 (Thr202/Tyr204), and phospho-AMPKα (Thr172) were measured by immunoblotting using the corresponding antibodies as described in ‘Research design and methods’ section. Representative blots are shown. (D, F, H) All mice were fed with a normal diet (ND) up to 7 weeks after weaning. From 7 weeks of age, mice were fed an ND, a 40%, or a 60% fat diet (40% FD, 60% FD) for 8 weeks. The protein expression levels of ERK1/2, AMPKα, PGC1α, and UCP1, and the phosphorylation of ERK1/2 (Thr202/Tyr204) and AMPKα (Thr172) were measured by immunoblotting using the corresponding antibodies as described in ‘Research design and methods’ section. Representative blots are shown (D, eWAT; F, iWAT; H, BAT). (E, G, I) Quantitative data of each corresponding western blots images from three independent experiments are presented as bar graphs (E, eWAT; G, iWAT; I, BAT). Note Ccl19KI mice exhibited impaired regulation of lipid metabolism by inhibition of AMPKα through activation of ERK1/2 in adipose tissue. The effects of CCL19 overexpression were especially pronounced in a group fed a 40% FD. Data are expressed as mean (SD). *p<0.05, **p<0.01. AMPKα, AMP-activated protein kinase α; BAT, brown adipose tissue; BSA, bovine serum albumin; CCL19, C-C motif ligand 19; CCR7, CC-chemokine receptor 7; ERK1/2, extracellular signal-regulated kinase 1/2; eWAT, epididymal white adipose tissue; iWAT, inguinal white adipose tissue; KI, knock-in; LPS, lipopolysaccharide; PA, palmitic acid; PGC1α, peroxisome proliferator-activated receptor γ coactivator 1α; UCP1, uncoupling protein 1; WT, wild type.
Based on this, we next examined the effects of CCL19 overexpression on the activation of ERK1/2 and AMPKα in the adipose tissues of these mice. Additionally, we also examined protein expression levels of PGC1α and UCP1 in BAT, which contribute to energy expenditure and thermogenesis. The phosphorylation levels of ERK1/2 and AMPKα were increased and decreased, respectively, in Ccl19KI mice compared with that in WT mice (figure 7D,I). These changes were mostly observed in the 40% FD group (figure 7E, G and I). The protein expression levels of PGC1α and UCP1 were reduced in the BAT of Ccl19KI mice compared with those in WT mice. This reduction was particularly observed with 40% FD (figure 7H,I). Taken together, Ccl19KI mice showed inhibition of AMPKα through activation of ERK1/2. Also, Ccl19KI mice showed impaired regulation of lipid metabolism and energy expenditure.
Discussion
In this study, we found that enhancement of the CCL19/CCR7 signaling pathway in adipose tissue increased adipose tissue inflammation. Furthermore, we found that high expression of adipose CCL19 suppressed AMPKα through activation of ERK1/2 and increased fat accumulation in the SAT and BAT. Lastly, we also demonstrated that 40% FD feeding further enhanced the effects of CCL19/CCR7 signaling, fat accumulation, and insulin resistance.
Hypertrophied adipose tissue becomes a major source of proinflammatory molecules such as MCP1 and TNFα. The expression of Mcp1 and Tnfα was significantly increased in iWAT and eWAT of Ccl19KI mice compared with that in WT mice (figure 6A,B). MCP1 is a potent chemotactic factor that promotes monocytes and macrophages recruitment into adipose tissue. Most of the TNFα secreted from adipose tissue derives from immune cells. One mechanism by which adipose-derived TNFα promotes insulin resistance in the liver and skeletal muscle is by directly activating hormone-sensitive lipase, thereby increasing FFA release from adipocytes.1–3 Previous publications have shown that ERK activation is promoted in adipose tissues of individuals with obesity and diabetes and in mouse models. Additionally, lipolysis is induced in hypertrophic adipocytes in an ERK signaling-dependent manner.35 36 Ccl19KI mice had significantly higher serum FFA concentrations than WT mice, regardless of diet (figure 2H). This may be due to the activation of ERK1/2 via the CCL19/CCR7 pathway promoting lipolysis in the adipocytes of Ccl19KI mice. Furthermore, CCL19 stimulation increased CCR7 expression in BMDCs and adipocytes (figures 4A, 7A,B). Therefore, we can speculate that CCR7-positive cells are increased in peripheral blood of Ccl19KI mice. PA administration also significantly increased CCR7 expression in adipose tissue (figure 1D,E), suggesting that FFAs and CCL19 synergistically increased the proportion of CCR7-expressing cells in Ccl19KI mice. Additionally, in Ccl19KI mice, the number of CD11c+ cells (figure 5A–C) and F4/80+ cells (figure 5D–F) in iWAT and eWAT significantly increased compared with those in WT mice. In adipose tissue of individuals with obesity, HFD feeding may increase the number of CCR7-positive cells and activated proinflammatory signals. Previous studies using mice with loss-of-function or knock-out of TLR4 indicated that FFAs activated TLR4 to induce proinflammatory cytokine expression in macrophages and adipocytes, thereby suppressing insulin signaling.37 38 Higher concentrations of serum FFAs increased inflammation in adipose tissue via TLR4, inducing insulin resistance in Ccl19KI mice fed an HFD.
There are two types of thermogenic adipocytes in rodents and humans: the classic brown adipocytes and beige adipocytes. Beige adipocytes are largely found in subcutaneous (anterior and inguinal) WAT,39 and their biogenesis is induced in response to external stimuli, such as cold exposure, exercise, and treatment with β3-adrenoreceptor (β3-AR) agonists.40 AMPK deletion in adipocytes results in cold intolerance and reduced thermogenesis in response to β3-AR stimulation.41 AMPK activity in adipose tissue is diminished in humans and rodents with obesity and insulin resistance.42–45 Furthermore, activation of adipocyte AMPK improves obesity-induced insulin resistance.46
Ccl19KI mice showed a significant elevation in serum FFAs, possibly due to ERK1/2 activation, even in non-obese mice. Furthermore, dysregulation of fatty acid metabolism and thermogenesis may have occurred via AMPKα suppression, and the effects of CCL19/CCR7 signaling differed based on the adipose tissue, with greater increases fat accumulation in SAT and BAT than in VAT. We previously reported that CCR7-deficient mice had increased UCP1 expression in BAT and were protected from diet-induced obesity.47 Our current findings that CCR7 ligand high expression model showed suppression of AMPK activation in BAT and attenuation of expression of PGC1α and UCP1 are not likely to contradict with previous results in CCR7-deficient mice. However, these results are not sufficient to show that suppression of UCP1 is due to inhibition of AMPKα. Previous studies have shown that proinflammatory cytokines can suppress UCP1 and other BAT-specific gene expression.48 49 Therefore, multiple pathways may have been involved in the attenuation of UCP1 expression in Ccl19KI mice.
In addition to the role of AMPK in adipocytes, AMPK in macrophages acts as an anti-inflammatory molecule and thus induces inhibitory effects on obesity-induced insulin resistance.20 50 51 The inhibition of AMPKα activation observed in iWAT and BAT of Ccl19KI mice may involve both the autocrine action of CCL19 in adipocytes and the paracrine action of CCL19 on CCR7-positive cells recruited into adipose tissues. Therefore, the suppression of AMPKα activation decreased the regulation of fatty acid metabolism and thermogenesis in adipocytes and promoted inflammatory signals in CCR7-positive immune cells such as macrophages, in adipose tissues.
Interestingly, our results demonstrated that diet-induced mild and severe obesity showed distinct sensitivity against CCL19 overexpression. Phenotype differences between Ccl19KI and WT mice were mostly observed in the 40% FD group. The association between the systemic effects through local inflammation such as periodontitis and the degree of obesity has been reported. We previously reported that Japanese patients with type 2 diabetes accompanied by severe periodontal disease, local inflammatory disease, with BMI around 25 kg/m2 showed slightly increased systemic inflammation as assessed by high-sensitivity CRP (hs-CRP) (hs-CRP levels over 500 ng/mL), and periodontal treatment toward such patients significantly decreased hs-CRP levels and remission of inflammation resulted in improved HbA1c. In contrast, the subjects with low hs-CRP levels (<500 ng/mL) were characterized by lower BMI with about 23 kg/m2, and, thus, the BMI was significantly lower in low hs-CRP group than that in the group with hs-CRP levels of 500 ng/mL or more.52 Therefore, we speculate these Japanese population with low BMI correspond to normal diet-fed mice, while the subjects with slightly increased CRP as well as slightly increased BMI corresponded to 40% FD-fed mice. In USA, other groups have suggested that periodontal disease has a significant impact on systemic inflammation in patients with normal BMI, but not in patients with a BMI around 35 kg/m2 and these authors also demonstrated and discussed that morbid obesity completely masked the inflammation caused by periodontal disease.53 54 Taken together, all these studies suggest that systemic influences of local inflammation may be enhanced by mild obesity, but masked mainly by severe obesity. Thus, we speculate that the effects of CCL19/CCR7 activation in adipose tissue are enhanced by mild obesity (corresponds to 40% FD group), but masked by severe obesity (corresponds to 60% FD group), in which diverse other molecules intricately interacted. From these points, Ccl19KI mice fed a 40% FD could be classified as a model representing early or mild pathological conditions of metabolic disease. Although obesity is less common in Asian populations, such as Japanese and Koreans, than in Western countries, the likelihood of developing diabetes does not differ between the two populations. Asians, including Japanese, are characterized by relatively lower basal insulin secretion capacity and are thought to be more susceptible to low-grade inflammation. Therefore, the combination of both mild inflammation and the slightly fat-rich state caused by more westernized diet could easily increase the likelihood of suffering from impaired glucose tolerance. Currently, for screening type 2 diabetes, a BMI of 25 kg/m2 or higher is usually recommended, but there is also a suggestion that the BMI of <25 kg/m2 and ≥23 kg/m2 may be more suitable for Asian Americans including Japanese Americans.55 From these points, we considered that 40% FD-fed mice with high expression of CCL19 in the adipose tissue could be a model for Asians accompanied by low-grade inflammation under more westernized lifestyle. Moreover, this model could represent subjects with mild obese conditions and susceptible to metabolic disorders.
To summarize, our results revealed that activation of the CCL19/CCR7 pathway in adipose tissue induced inflammation and that adipocyte CCL19 inhibited AMPKα through activating ERK1/2, resulting in impaired lipid metabolism and energy regulation. In addition, a 40% FD enhanced these pathological changes and induced insulin resistance and weight gain. Our findings suggested the potential for developing new therapeutic strategies for metabolic diseases by targeting CCL19.
Data availability statement
Data are available in a public, open access repository. All data relevant to the study are included in the article or uploaded as supplemental information.
Ethics statements
Ethics approval
All animal procedures were approved by the Institutional Animal Care and Use Committee of the University of Kyushu (A19-112-0, 29-44). All procedures of generation of Ccl19KI mice were approved by the Institutional Animal Care and Use Committee of the University of Tsukuba (TG16-68).
Acknowledgments
We appreciate the technical assistance from The Research Support Center, Research Center for Human Disease Modeling, Kyushu University Graduate School of Medical Sciences.
References
Supplementary materials
Supplementary Data
This web only file has been produced by the BMJ Publishing Group from an electronic file supplied by the author(s) and has not been edited for content.
Footnotes
Contributors MH, MI, and YN performed experiments. MH and MI analyzed the data. MI and FN designed the study, interpreted data, and wrote the manuscript. MH, MI, TShinjo, AY, TSano, TF, TSanui, TA, and FN contributed to the discussion. MH and MI are the guarantor of this work and, as such, had full access to all the data in the study and takes responsibility for the integrity of the data and the accuracy of the data analysis.
Funding This work was supported by JSPS KAKENHI Grant Numbers JP16H05555 and JP19K10152.
Competing interests None declared.
Provenance and peer review Not commissioned; externally peer reviewed.
Supplemental material This content has been supplied by the author(s). It has not been vetted by BMJ Publishing Group Limited (BMJ) and may not have been peer-reviewed. Any opinions or recommendations discussed are solely those of the author(s) and are not endorsed by BMJ. BMJ disclaims all liability and responsibility arising from any reliance placed on the content. Where the content includes any translated material, BMJ does not warrant the accuracy and reliability of the translations (including but not limited to local regulations, clinical guidelines, terminology, drug names and drug dosages), and is not responsible for any error and/or omissions arising from translation and adaptation or otherwise.