Article Text

Abstract
Introduction Blood oxygen saturation is low compared with healthy controls (CONs) in the supine body position in individuals with type 1 diabetes (T1D) and has been associated with complications. Since most of daily life occurs in the upright position, it is of interest if this also applies in the standing body position. In addition, tissue oxygenation in other anatomical sites could show different patterns in T1D. Therefore, we investigated blood, arm and forehead oxygen levels in the supine and standing body positions in individuals with T1D (n=129) and CONs (n=55).
Research design and methods Blood oxygen saturation was measured with pulse oximetry. Arm and forehead mixed tissue oxygen levels were measured with near-infrared spectroscopy sensors applied on the skin.
Results Data are presented as least squares means±SEM and differences (95% CIs). Overall blood oxygen saturation was lower in T1D (CON: 97.6%±0.2%; T1D: 97.0%±0.1%; difference: −0.5% (95% CI −0.9% to −0.0%); p=0.034). In all participants, blood oxygen saturation increased after standing up (supine: 97.1%±0.1%; standing: 97.6%±0.2%; difference: +0.6% (95% CI 0.4% to 0.8%); p<0.001). However, the increase was smaller in T1D compared with CON (CON supine: 97.3%±0.2%; CON standing: 98.0%±0.2%; T1D supine: 96.9%±0.2%; T1D standing: 97.2%±0.1%; difference between groups in the change: −0.4% (95% CI −0.6% to −0.2%); p<0.001). Arm oxygen saturation decreased in both groups after standing and more in those with T1D. Forehead oxygen saturation decreased in both groups after standing and there were no differences between the changes when comparing the groups.
Conclusion Compared with CON, individuals with T1D exhibit possible detrimental patterns of tissue oxygen adaptation to standing, with preserved adaptation of forehead oxygenation. Further studies are needed to explore the consequences of these differences.
- hypoxia
- diabetic neuropathies
- diabetes mellitus
- type 1
- albuminuria
Data availability statement
Individual, de-identified participant data are not freely available because of the risk of patient re-identification, but interested parties can request access to de-identified participant data or anonymised study reports through submission of a request for access to the corresponding author, provided that the necessary data protection agency and ethical committee approvals are provided in compliance with relevant legislation.
This is an open access article distributed in accordance with the Creative Commons Attribution Non Commercial (CC BY-NC 4.0) license, which permits others to distribute, remix, adapt, build upon this work non-commercially, and license their derivative works on different terms, provided the original work is properly cited, appropriate credit is given, any changes made indicated, and the use is non-commercial. See: http://creativecommons.org/licenses/by-nc/4.0/.
Statistics from Altmetric.com
Significance of this study
What is already known about this subject?
Individuals with type 1 diabetes (T1D) have a low blood oxygen saturation in the supine body position but it is unknown if the same difference is present in the standing body position.
What are the new findings?
We confirmed that blood oxygenation is lower in T1D compared to healthy controls (CONs) in the supine position. Furthermore, we observed a more significantly reduced blood oxygenation in the standing position compared to CONs.
We observed a more significant drop from the supine to the standing position in the arm oxygen saturation in T1D and forehead oxygen saturation dropped similarly from the supine to the standing position between groups.
How might these results change the focus of research or clinical practice?
Detrimental patterns of blood oxygen adaptation in diabetes could play an important role in the pathogenesis of diabetic complications, and our findings could lead to new treatments targeting low blood oxygen levels to prevent or treat diabetic complications.
Introduction
Individuals with short duration of type 1 diabetes (T1D) have a low blood oxygenation compared with healthy controls (CONs) as measured with pulse oximetry.1 2 The difference was subclinical, corresponding to only 0.7%, but considering the dissociation curve of hemoglobin, even a small difference in the arterial blood oxygen saturation within the normoxic range implies a large difference in the oxygen partial pressure of the arterial blood.3 A low blood oxygen saturation in T1D has been observed only in the supine body position. Since most of daily life occurs while standing, it is important to assess whether this difference can be confirmed in the standing body position. If not, then it might not be as clinically important as previously assumed.
Several studies investigating postural changes in oxygenation in healthy individuals were found, but the number of studies in T1D was low. In healthy individuals, blood oxygenation was observed to increase from the supine to the upright sitting body position.4 5 The transcutaneous oxygen tension in the foot also increases from the supine to the upright sitting body position in CONs, but even more so in persons with type 2 diabetes.6 7 The upper arm skin oxygenation (biceps muscle) was observed in CONs to decrease from the supine to the upright body position using a tilt table.8 Finally, cerebral oxygenation measured with near-infrared spectroscopy of the skin has been observed in CONs to decrease when changing position from the supine or the sitting position to the standing position.9 We found no studies in T1D investigating postural changes in blood or tissue (cerebral, arm, leg, and foot) oxygenation.
This exploratory study was based on five research questions. The main hypotheses were (1) that individuals with T1D exhibit lower oxygen saturation in the blood than CONs and (2) to the same extent in both the supine and the standing body position. Exploratory hypotheses were (3) that oxygenation levels were also lower in T1D in the arm and forehead, (4) to the same extent in both body positions and finally (5) that low oxygen levels were associated with diabetes risk factors such as albuminuria. We aimed to test our hypotheses with an acute study design in individuals with T1D compared with healthy individuals without diabetes.
Methods
Study population
Data used in the present study were derived from two different studies. The Rubinaut study was carried out in Copenhagen in 2017 and investigated the effects of increasing blood oxygen saturation on autonomic function in 54 individuals with T1D.10 Participants were >18 years of age and with a diagnosis of T1D (WHO criteria). Main exclusion criteria were the presence of (1) non-diabetic kidney disease and (2) end-stage renal disease (estimated glomerular filtration rate<15 mL/min/1.73 m2), dialysis or kidney transplantation. All participants in the Rubinaut study gave informed consent before participating. From the FinnDiane cohort, 95 individuals with T1D and 55 CONs participated in a similar study, also investigating the effects of increasing blood oxygen saturation on autonomic function.11 All participants were between 18 and 35 years old at the time of inclusion. T1D was diagnosed based on a measure of C-peptide in plasma of <0.03 nmol/L and initiation of permanent insulin treatment within 1 year after the diagnosis of diabetes. The main exclusion criteria were clinical signs of cardiovascular disease. All participants with T1D had normal serum creatinine, indicating preserved kidney function.
In both studies, measurements of orthostatic blood pressure (one supine and three standing) were performed, while continuous oxygen saturation levels were measured. Continuous data (one datapoint per second) on oxygen levels during the 6 min of examination per participant were collected and analyzed post hoc in the current study.
Clinical characteristics
HbA1c was measured by high-performance liquid chromatography in Rubinaut, and by an immunoturbidimetric immunoassay (Medix Biochemica, Kauniainen, Finland) in the FinnDiane cohort. Plasma creatinine was measured by an enzymatic method (Hitachi 912, Roche Diagnostics, Mannheim, Germany). The urinary albumin:creatinine ratio (UACR) was measured by an enzymatic immunoassay in three consecutive morning urine samples. Three measurements of brachial blood pressure were obtained after 5 min in sitting position with an oscillometric blood pressure monitor (um201; A&D Medical, Tokyo). Height and weight were measured, and Body Mass Index was calculated as weight (kg)/height (m).2 A detailed medical history was obtained from all participants and cross-referenced with electronic hospital records. Current smoking was defined as one or more cigarettes/cigars/pipes a day.
Experimental protocol
The participants were permitted a light meal 2 hours before the testing but were requested to take no medication and to abstain from tobacco from midnight the day before the visit and were also asked to refrain from strenuous exercise 24 hours prior to the examination. Testing was performed in a quiet, temperature-controlled room at 20°C–26°C, between 8:00 and 14:00 hours. The experimental protocol included simultaneous measurement of oxygenation in the peripheral blood (left hand index finger), the tissue of the left forearm (sensor size: 1.5 cm×4 cm, volar side, starting 2 cm distally for caput radii, ending 6 cm distally from caput radii, direction parallel with the radial bone) and the left part of the forehead (sensor size: 1.5 cm×4 cm, placed 2 cm superior of the left eyebrow, direction horizontal), first for 1 min in the supine position and consecutively for 5 min in the standing position. The position of the arm was not controlled or measured during the experiment, but participants were instructed in lying and standing with the arms relaxed and alongside the body and not to move during measurements, except when changing body position. Participants were instructed in changing body position from supine to standing in approximately 1–2 s. Peripheral blood oxygen saturation was measured with pulse oximetry (Cosmo; Novametrix, Wallingford, Connecticut, USA), and tissue oxygenation was measured with near-infrared spectroscopy skin sensors on the arm and forehead used in a previous study.12 This battery-operated, portable near-infrared spectroscopy device has an emitter section consisting of two wavelengths (750 and 850 nm) generated by a single two-wave LED (Roithner, Vienna, Austria). The receiver section consists of two infrared sensors, each containing a transimpedance amplifier, positioned 35 and 38 mm from the emitting LED. The spatially resolved spectroscopy method were used for obtaining the relative concentration of oxygenated hemoglobin and deoxygenated hemoglobin.13 The sensitivity and precision of this device in the arm and forehead was validated against a commercially available device (NIRO 300 Hamamatsu, Japan) (paper submitted for publication). Signals were simultaneously acquired on a laptop, using a battery-operated analogue-to-digital converter with a 12-bit precision at a sampling rate of 400 Hz per channel connected via Bluetooth to a laptop (Software: DataloggerControl-205-BT). The baroreflex sensitivity is defined as the extent to which the heart rate changes when blood pressure changes and is considered a sensitive measure of cardiovascular autonomic function.14 Baroreflex sensitivity was determined from spontaneous fluctuations in the ECG-derived time elapsed between two successive R-waves of the QRS signal (RR interval) and systolic blood pressure. Previous studies have shown a poor correlation between different methods of measuring baroreflex sensitivity15 so we used an average of seven different tests for calculating baroreflex sensitivity. This approach has previously been described in detail.11 16 In short, the seven tests include the positive and negative sequence methods,17 the alpha coefficient in the low-frequency and high-frequency bands and its average,18 the transfer function technique19 and finally, the SD method.16 The average of these tests is a continuous variable with the unit ms/mm Hg.
Statistical analysis
Clinical characteristics of participants are presented as n (%), mean±SD or if skewed distributions, as medians with IQR (quartile 1–quartile 3). χ test and Fisher’s exact test were used for categorical data, and Student’s t-tests were used for quantitative data. Means for each minute passed were calculated by taking a simple average of the 60 consecutive measurements from each time period. The first minute was in the supine position and the remaining five were in the standing position. This resulted in one mean oxygen saturation per outcome in the supine position and five mean oxygen saturations per outcome in the standing position. To test group differences, a linear mixed-effects model was fitted with oxygen saturation as outcome and T1D=yes/no as exposure, adjusted for sex, age and smoking (model 1), with a participant-specific random intercept to account for the correlation of repeated measures within participants. To investigate the influence of body position on outcomes, the same model was used, but with a binary exposure variable for standing (yes/no). This approach was chosen to increase statistical power and interpretability of the results. To compare the effect of standing between T1D and CONs, the same model was used, but with the interaction term: T1D×standing as exposure. A second level of confounder adjustment was also tested by further adjusting for Body Mass Index, heart rate, systolic blood pressure, HbA1c, hemoglobin and baroreflex sensitivity (model 2). The analyses of changes in oxygen saturation from the supine to the standing body positions were adjusted for baroreflex sensitivity to adjust for differences in cardiovascular autonomic function between participants. Results are presented as estimated mean differences with 95% CIs and p values. Estimates are on original scale. For arm oxygen saturation levels, normality of model residuals could not be obtained. Thus, for this outcome, oxygen levels were compared at each timepoint using t-tests. To reduce the false discovery rate, p values from linear mixed-effects models and t-tests were corrected for multiple testing using the Benjamini-Hochberg procedure.20 Corrected p values are reported as ‘p-BH’. To test which variables were associated with low oxygenation in T1D, a subanalysis only in participants with T1D was performed: a linear mixed-effects model with two confounder levels was fitted, first with oxygen saturation as outcome and age as exposure, adjusted for sex, smoking and standing=yes/no (model 1), and with further adjustment for diabetes duration, albuminuria=normoalbuminuria/microalbuminuria/macroalbuminuria and the UACR (model 2).
Results
Clinical characteristics
Twenty participants were excluded from analysis due to missing data or poor data quality (malfunction of the equipment at the time of measurement), significant artifacts in the raw data (eg, signal noise due to movement) or lack of patient compliance during measurements. Fifty-five CONs and 129 subjects with T1D were included in the analyses. Participants with T1D had a mean±SD diabetes duration of 26±11 years, a mean HbA1c of 64±12 mmol/mol. In the T1D group, 100 (77%) had normoalbuminuria; 5 (4%) had microalbuminuria; and 24 (19%) had macroalbuminuria (table 1).
Participant characteristics by diabetes status
Comparing the groups, participants with T1D had a higher heart rate (CONs: 59±8 beats/min vs T1D: 65±12 beats/min, p=0.001), systolic blood pressure (CONs: 125±14 mm Hg vs T1D: 132±17 mm Hg, p=0.008), diastolic blood pressure (CONs: 62±9 mm Hg vs T1D: 78±9 mm Hg, p<0.001) and Body Mass Index (CONs: 25.1±3.6 kg/m2 vs T1D: 26.7±4.4 kg/m2, p=0.027) and a lower blood hemoglobin and baroreflex sensitivity than CONs. Age, gender distribution and smoking status were not significantly different between groups (table 1). Baseline characteristics for the separate cohorts from the Rubinaut and FinnDiane studies can be seen in the online supplemental table S1). Orthostatic blood pressure measurements measured in the two studies can be seen in the online supplemental table S2.
Supplemental material
Oxygen saturation levels
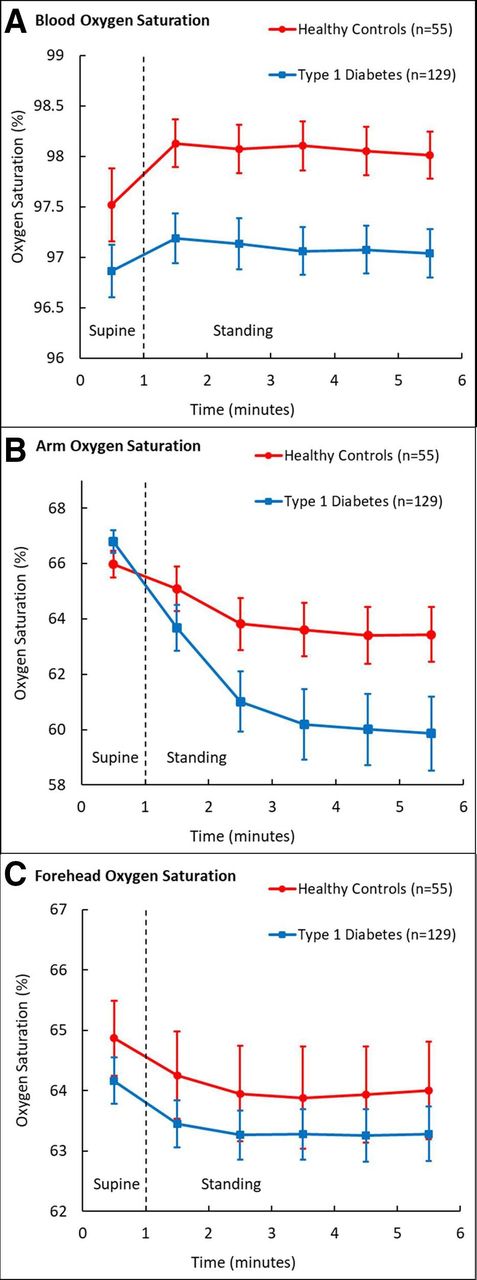
For an overview of oxygen saturation levels, see figure 1, and for details, see table 2. Least squares means±SEM in blood oxygen saturation were 97.0%±0.1% for CONs and 97.6%±0.2% for T1D, corresponding to a difference of −0.5% (95% CI −0.9% to −0.0%, p=0.034, p-BH=0.041), but the significance was lost after full adjustment in model 2. Blood oxygen saturation was 97.1%±0.1% for the supine position and 97.6%±0.1% for the standing position, corresponding to a difference of +0.6% (95% CI 0.4% to 0.8%, p<0.001, p-BH<0.001), and the difference was still significant after full adjustment. The increase in blood oxygen saturation after standing up was significantly smaller in T1D (CONs supine: 97.3%±0.2%, CONs standing: 98.0%±0.2%, T1D supine: 96.9±0.2, T1D standing: 97.2%±0.1%) corresponding to a difference between CONs and T1D in the change from supine to standing of −0.4% (95% CI −0.6% to −0.2%, p<0.001, p-BH<0.001). The difference was still significant after full adjustment in model 2 (table 2).
Mean (95% CI) oxygen saturation levels in the supine and standing body positions. (A) Blood oxygen saturation. (B) Arm oxygen saturation. (C) Forehead oxygen saturation.
Linear mixed effects models on outcomes
The arm oxygen saturation in supine position was higher in the T1D group than in the CONs (p=0.022, p-BH=0.026), but all standing arm oxygen saturation levels were lower in the T1D group (p<0.05, p-BH<0.05) (table 3).
Student’s t-test on outcomes
Although the forehead oxygen saturation was numerically lower in T1D, it was not significant in model 1 (−0.7% (95% CI −1.6% to 0.2%), p=0.149 (p-BH=0.224)) (table 2). After full adjustment in model 2, the difference was still insignificant (−1.5% (95% CI −3.0% to 0.1%), p=0.058 (p-BH=0.116)). Forehead oxygen saturation changed after standing up by −0.9% (95% CI −1.2% to −0.7%) and the difference kept significance after full adjustment in model 2. There was no difference between T1D and CONs between the changes in forehead oxygenation from supine to standing (table 2).
Subanalyses
All results presented in the following are from subanalyses performed only in participants with T1D (n=129). Low blood oxygen saturation was associated with high age, adjusted for sex, smoking and body position (model 1) (p<0.001), and remained significant after further adjustment for diabetes duration, albuminuria status and UACR (model 2) (p<0.001). Macroalbuminuria (with normoalbuminuria as reference) was associated with lower blood oxygen saturation (−0.9% (95% CI −1.7% to –0.2%), p=0.018), adjusted for age, sex, smoking, body-position, diabetes duration and UACR. High arm oxygen saturation was associated with high age, adjusted for sex, smoking and body position (model 1) (p<0.001), with loss of significance after further adjustment for diabetes duration, albuminuria status and UACR (model 2) (p=0.062). Female sex was associated with higher arm oxygen saturation in model 1 (p<0.001) and after full adjustment in model 2 (p=0.013).
Discussion
The blood oxygen saturation was lower in T1D compared with CONs, and more significantly reduced in the standing position. The blood oxygen saturation increased after standing, but less in T1D than in CONs. Individuals with T1D might therefore have impaired physiological adaptations in blood oxygenation after standing. Arm and forehead oxygen saturation were not lower in T1D in the supine position, but arm oxygen saturation was lower in the standing position. Arm oxygen saturation decreased when standing and more in T1D than in CONs. Forehead oxygen saturation decreased after standing and to the same extent in both groups. The blood oxygen saturation was lowest in the subjects with macroalbuminuria, indicating a possible link with microvascular dysfunction.
Low blood oxygen saturation in T1D
A low blood oxygen saturation measured with pulse oximetry in the peripheral blood has been demonstrated in the supine position in individuals with T1D, but these studies did not account for changes in body position or included any individuals with macroalbuminuria.1 2 The difference between T1D and CONs was similar in magnitude to what we observed in the present study. In type 2 diabetes, there is to our knowledge, only one study on the matter, showing no evidence of a low blood oxygen saturation.21 There are several possible explanations why the peripheral blood oxygen saturation might be lower in T1D:
The supply of oxygen could be altered by an impaired breathing efficiency due to generalised autonomic dysfunction as seen in the T1D group in our study with a low baroreflex sensivity.
The transport of oxygen from the lungs to the blood could be impaired. Patients with diabetes have a reduced pulmonary diffusion capacity, and this is associated with a long diabetes duration.22 23 A reduced pulmonary diffusion capacity in diabetes could be caused by pulmonary microvascular damage, which is supported by our finding that macroalbuminuria was associated with low blood oxygen saturation. In addition, glycosylation of the basal membrane is suggested to impair pulmonary oxygen diffusion, and this could also play a role in T1D.24
The transport of oxygen from the blood to the peripheral tissue could be altered by cardiovascular adaptations in T1D such as atherosclerosis or an impaired microcirculation.25 26 This question should be adressed in future studies.
Postural changes in oxygenation
The blood oxygen saturation increased with standing but the oxygen saturations in the arm and forehead both decreased. These changes are in accordance with previous studies in CONs, even though blood oxygenation in these studies were investigated the upright sitting position and not the standing position, and the arm oxygenation study was in the upper arm (skin above the biceps muscle) and not the forearm.4 5 8 9 We speculate that the physiological mechanisms behind this response with opposite directions of the changes in oxygenation might be a combination of the following: (1) increased ventilation, increasing the blood oxygen saturation, induced by a sympathetic response; (2) a redistribution and centralization of blood flow to the vital organs and active muscles in the lower body, decreasing the arm skeletal muscle tissue oxygenation; and (3) gravity redistributing blood to the lower body, thus decreasing the forehead oxygen saturation and theoretically also increasing the oxygenation in the feet as previously shown.6 7
Participants with T1D had an impaired blood oxygen response to standing. This phenomenon could be caused by a combination of a reduced pulmonary diffusion capacity and autonomic dysfunction with sympathetic overactivity and reduced chemoreflex sensitivity.27 28 Of note, the T1D group had lower baroreflex sensitivity, showing autonomic dysfunction.
The arm oxygen saturation decreased more in response to standing in participants with T1D than in CONs. This might be a result of autonomic dysregulation with a sympathetic overdrive. Forehead oxygen saturation decreased to a similar extent in both groups. This indicates a preserved cerebral autoregulation in the T1D group. It should be noted that these speculations are merely suggestions and there are indeed still many questions remaining to be answered in future studies.
Cardiovascular parameters
The heart rate, blood pressure and Body Mass Index were higher in the T1D group compared with CONs and baroreflex sensitivity was lower. These findings were as expected.29–31
Methodology
Pulse oximetry is a validated method, considered reliable for estimating arterial oxygen saturation at levels above 90% and can also be considered a reliable indicator of generalized blood oxygen saturation.32 Near-infrared spectroscopy is a well-established methodology that applies similar principles as pulse oximetry.13 33 We aimed to assess tissue oxygenation in an area with important autoregulation, the brain, and in one without, the skeletal muscle of the forearm. We chose the forearm for practical reasons, but it would also be interesting to investigate, for example, the foot as already done in type 2 diabetes.6 7 In the forearm, covering an area of approximately 1.5 cm×4 cm and with a measuring depth of approximately 2 cm, the region of interest contained skin, fat, skeletal muscle and small circulatory vessels (capillaries, venoles, and veins). We believe that skeletal muscle tissue is primarily reflected in this measurement. In the forehead, the region of interest contained skin, fat, bone, small vessels and superficial brain tissue. With a measuring depth of 2 cm, we believe that brain tissue is primarily reflected. However, as the anatomical sites both contain mixed tissue, the near-infrared spectroscopy results should be interpreted as exploratory estimates of oxygenation at the peripheral anatomical sites of the forehead and forearm and not as exact measures of skeletal muscle and brain tissue oxygenation.
Impact
The impact of low blood oxygen saturation on diabetes and its complications are still at a very early stage, but studies investigating the role of hypoxia in diabetes are emerging.34 Some studies suggest that tissue hypoxia may be a central pathogenic factor in the development of diabetic kidney disease.35–37 Indeed, renal hypoxia has been observed in type 2 diabetes with kidney disease,38 and reduced renal cortical oxygenation has been found to predict a decline in renal function in persons with chronic kidney disease.39 In addition, in T1D, it has been observed that inducing hypoxemia impairs cardiovascular autonomic function40 and that inducing hyperoxemia improves cardiovascular autonomic function,10 11 41 indicating a possible causal relationship between blood oxygenation and cardiovascular autonomic function. Thus, dysregulated or impaired oxygen levels might play a crucial role in the pathogenesis of diabetic complications such as diabetic kidney disease or cardiovascular autonomic neuropathy, and exploring the mechanisms behind might reveal important knowledge that could lead to an improved understanding of diabetic complications and the development of new interventions to prevent or treat diabetic complications by targeting low oxygen levels.
Future studies
Low oxygen levels might be involved in the pathogenesis of microvascular diabetic complications such as cardiovascular autonomic neuropathy and diabetic nephropathy and studies investigating the effects of interventions improving blood and tissue oxygenation are needed. In the field of diabetic nephropathy, sodium–glucose cotransporter two inhibitors in individuals with type 2 diabetes have been shown to slow the progression of diabetic kidney disease and to reduce the risk of kidney failure.42 43 The mechanisms of these renoprotective effects are still unknown, but they could be linked with alleviation of renal cortical hypoxia by reducing kidney oxygen consumption as proposed by Nespoux and Vallon.44 This question will be addressed by our group in an ongoing study, the Astronaut Study (NCT04193566), investigating the acute effects of sodium–glucose cotransporter 2 inhibition on kidney oxygenation in T1D evaluated by MRI. Inducing hyperoxia by nasal inhalation of pure oxygen improves cardiovascular autonomic function in T1D10 but has detrimental effects on a range of clinical parameters including blood pressure and arterial function.45 Thus, it might not be a suitable therapeutic intervention to alleviate low blood oxygen saturation. In contrast, inducing hyperoxia by slow breathing exercises also improves cardiovascular autonomic function but without the detrimental effects on blood pressure and arterial function.1 Only the acute effects of slow breathing exercises have been investigated so far and it would be interesting to investigate chronic effects of slow breathing exercises in T1D. In this context, alleviation of a low blood oxygen saturation might explain some of the positive effects seen with physical exercise in diabetes.46
Strengths and limitations
The T1D group consisted of 77% with normoalbuminuria, 4% with microalbuminuria and 19% with macroalbuminuria. Thus, this study population might not be representative for a general T1D population. For comparison, in the intensive care arm of the The Diabetes Control and Complications Trial/Epidemiology of Diabetes Interventions and Complications (DCCT/EDIC) cohort where participants had a similar age and diabetes duration, 81% had normoalbuminuria, but 16% had microalbuminuria and 3% had macroalbuminuria.47 An important limitation is that the data were analyzed regardless of time after standing up. We did this for reasons of statistical power and interpretability of the models. Another limitation to the study is that minute-to-minute changes in blood pressure and tissue blood flow were not measured and thus the full physiological response could not be considered when interpreting the data. It is a limitation that the position of the arm was not controlled although it was standardized. Individual differences in arm length were not adjusted for and could have influenced the results due to differences in hydrostatic pressure. It should be noted that the individual speed of standing up is a possible confounder as it was not measured, controlled or adjusted for. Different placement of the near infrared spectroscopy probes between participants could have altered the response. When evaluating change in oxygenation after change in position, the changes were stable after 1 min (figure 1) except for measurements at the arm. The time to change was not considered in these analyses, and we cannot exclude that the time to change differed between individuals or groups. A limitation is the risk of survival bias in the T1D group, especially in participants with macroalbuminuria. It is a weakness that the mixed-effects model residuals could not be assumed normally distributed for the arm oxygen saturation and that instead, t-tests had to be used for comparison at each timepoint. Location and observer were not the same for all participants, as some participated in the Copenhagen study and some participated in the Helsinki study. Equipment and software used were the same in both studies, however. The near-infrared spectroscopy device used has not been validated and our findings should be interpreted with this in mind. A strength is that measurements were performed under standardized conditions including fasting, abstinence from alcohol, smoking and strenuous physical activity. Another strength is the simple design and the simple methods used, making the results easier to reproduce in future research.
Conclusion
We confirmed that blood oxygenation is reduced in T1D in the supine position and extended this finding to a more significant lower blood oxygenation in the standing position compared with CONs. Furthermore, the oxygen levels and effects of standing were different between T1D and CONs in the blood, arm and forehead. This suggests detrimental patterns of blood and tissue oxygen adaptation to standing in T1D, which could be important for the development of long-term complications in the kidneys and nervous system. Further studies are needed to explore the consequences of these differences and whether the low blood oxygen saturation in T1D can be alleviated by intervention.
Supplemental material
Data availability statement
Individual, de-identified participant data are not freely available because of the risk of patient re-identification, but interested parties can request access to de-identified participant data or anonymised study reports through submission of a request for access to the corresponding author, provided that the necessary data protection agency and ethical committee approvals are provided in compliance with relevant legislation.
Ethics statements
Ethics approval
This study was approved by Videnskabsetisk komité Region Hovedstaden H-16015796 and the ethics committee of the Hospital District of Helsinki and Uusimaa (review number HUS3313-2018-3). The Rubinaut study complied with the Declaration of Helsinki and the research protocol was approved by the regional ethical committee (review number 56 623).
The FinnDiane study complied with the Declaration of Helsinki and the research protocol was approved by the ethics committee of the Hospital District of Helsinki and Uusimaa (review number HUS3313-2018-3). All participants in the FinnDiane study gave informed consent.
Acknowledgments
The authors thank all participants and acknowledge the work of laboratory technicians at Steno Diabetes Center Copenhagen and the Folkhälsan Institute in Helsinki. A special thanks to study laboratory technicians M L D Halkjaer, T Nielsen, D Riis, T R Juhl, and J A Hermann.
References
Supplementary materials
Supplementary Data
This web only file has been produced by the BMJ Publishing Group from an electronic file supplied by the author(s) and has not been edited for content.
Footnotes
Presented at Presented at Annual Meeting of the Danish Society of Endocrinology, January 2020, Nyborg, Denmark; Neurodiab, September 2019, Sitges, Spain; European Association for the Study of Diabetes. September 2019, Barcelona, Spain.
Contributors JCL drafted the manuscript. JCL, KKBC, CSH, LJD, MB, P-HG, MF-M, LB and PR analysed and interpreted the research. JCL, CSH, MB, P-HG, MF-M, LB and PR conceived and designed the research. JCL, KKBC, CSH and LJD performed the statistical analysis. JCL and MB did measurements. CSH, P-HG, MF-M, LB and PR supervised the study. PR obtained the funding. All authors contributed to the interpretation of the results, reviewed and edited the manuscript and approved the final version of the manuscript. JCL is the guarantor of this work and, as such, had full access to all the data in the study and takes responsibility for the integrity of the data and the accuracy of the data analysis.
Funding The authors acknowledge the support from the Novo Nordisk Foundation (grant number NNFOC0013659): PROTON: Personalizing Treatment of Diabetic Nephropathy. Internal funding was provided by Steno Diabetes Center Copenhagen.
Competing interests PR has received honoraria to Steno Diabetes Center Copenhagen for consultancy from AstraZeneca, Astellas, Bayer, Boehringer Ingelheim, Gilead, Novo Nordisk, Merck, Mundipharma, Sanofi, Vifor, and research support from Astra Zeneca and Novo Nordisk. P-HG has received lecture honoraria from Astellas, AstraZeneca, Boehringer Ingelheim, Eli Lilly, Elo Water, Genzyme, Medscape, MSD, Mundipharma, Novartis, Novo Nordisk, PeerVoice, Sanofi and Sciarc, and is an advisory board member of AbbVie, Astellas, AstraZeneca, Bayer, Boehringer Ingelheim, Eli Lilly, Medscape, MSD, Mundipharma, Novo Nordisk and Sanofi.
Provenance and peer review Not commissioned; externally peer reviewed.
Supplemental material This content has been supplied by the author(s). It has not been vetted by BMJ Publishing Group Limited (BMJ) and may not have been peer-reviewed. Any opinions or recommendations discussed are solely those of the author(s) and are not endorsed by BMJ. BMJ disclaims all liability and responsibility arising from any reliance placed on the content. Where the content includes any translated material, BMJ does not warrant the accuracy and reliability of the translations (including but not limited to local regulations, clinical guidelines, terminology, drug names and drug dosages), and is not responsible for any error and/or omissions arising from translation and adaptation or otherwise.