Article Text

Abstract
Introduction Heart failure (HF) is a major contributor to cardiovascular morbidity and mortality in people with diabetes. In this study, we estimated trends in the incidence of HF inpatient admissions and emergency department (ED) visits by diabetes status.
Research design and methods Population-based age-standardized HF rates in adults with and without diabetes were estimated from the 2006–2017 National Inpatient Sample, Nationwide ED Sample and year-matched National Health Interview Survey, and stratified by age and sex. Trends were assessed using Joinpoint.
Results HF inpatient admissions did not change in adults with diabetes between 2006 and 2013 (from 53.9 to 50.4 per 1000 persons; annual percent change (APC): −0.3 (95% CI −2.5 to 1.9) but increased from 50.4 to 62.3 between 2013 and 2017 (APC: 4.8 (95% CI 0.3 to 9.6)). In adults without diabetes, inpatient admissions initially declined (from 14.8 in 2006 to 12.9 in 2014; APC −2.3 (95% CI −3.2 to –1.2)) and then plateaued. Patterns were similar in men and women, but relative increases were greatest in young adults with diabetes. HF-related ED visits increased overall, in men and women, and in all age groups, but increases were greater in adults with (vs without) diabetes.
Conclusions Causes of increased HF rates in hospital settings are unknown, and more detailed data are needed to investigate the aetiology and determine prevention strategies, particularly among adults with diabetes and especially young adults with diabetes.
- epidemiology
- heart failure
- hospitalization
- diabetes mellitus
- type 2
Data availability statement
Data are available in a public, open access repository. The data that support the findings of this study are publicly available from the National Center for Health Statistics and the Agency for Healthcare Research and Quality. All data are deidentified.
This is an open access article distributed in accordance with the Creative Commons Attribution Non Commercial (CC BY-NC 4.0) license, which permits others to distribute, remix, adapt, build upon this work non-commercially, and license their derivative works on different terms, provided the original work is properly cited, appropriate credit is given, any changes made indicated, and the use is non-commercial. See: http://creativecommons.org/licenses/by-nc/4.0/.
Statistics from Altmetric.com
Significance of this study
What is already known about this subject?
Heart failure (HF) is a major contributor to cardiovascular morbidity and mortality in people with diabetes.
Whether HF-related hospitalizations among adults with versus without diabetes has changed over time remains unknown.
What are the new findings?
Rates of HF-related inpatient admissions and ED visits are three to five times higher in adults with versus without diabetes, and this excess risk has increased over time.
Though absolute rates remain lowest in the youngest age groups, the greatest relative increases in HF-related inpatient admissions and ED visits were observed in young adults with diabetes.
Increases in HF-related utilization among adults with diabetes was observed in both inpatient and ED settings, suggesting broader underlying causes rather than a shift in treatment setting.
How might these results change the focus of research or clinical practice?
Combined with current evidence from clinical trials, findings of this study support the use of intensive and focused prevention and management of diabetes, including the use of SGL2 inhibitors, to reduce the incidence of HF hospitalizations in people with diabetes.
Future research should focus on the drivers of increases in HF hospitalizations, especially among young people with diabetes.
Introduction
People with diabetes are at increased risk for cardiovascular disease (CVD) and associated complications.1 Although diabetes has become an increasingly common disease, estimated to affect 463 million people worldwide2 and more than 34 million in the USA,3 CVD and related mortality in people with diabetes has fallen dramatically in most high-income countries since the 1980s likely due to advances in treatment and better management of risk factors.4 5 However, the reported declines in CVD among people with diabetes (both incidence and mortality) often do not include heart failure (HF) as an outcome, despite increasing recognition that HF is a major contributor to CVD morbidity, mortality and healthcare costs in people with diabetes.1 6–11
In a 2015 paper, Shah et al9 demonstrated that HF is more likely to be an initial manifestation of CVD in people with type 2 diabetes compared with myocardial infarction, stroke and coronary disease. Despite the relative importance of HF in diabetes, few studies have comprehensively examined whether rates of HF in people with diabetes (vs without diabetes) has changed over time. In the USA, one recent study demonstrated that HF inpatient admissions, defined as the primary reason for hospital admission, increased 3.6% per year between 2013 and 2015 following a period of decline.12 However, to understand the underlying drivers of changes in HF rates and develop subsequent interventions, a comparison with people without diabetes is needed. Such comparisons in atherosclerotic CVD (eg, myocardial infarction and coronary artery disease) have led to narrowing the gap by reducing the excess risk in diabetes populations.13 14 Furthermore, a more comprehensive approach to understanding the overall HF burden is necessary to inform healthcare planning and resource allocation. This includes consideration of multiple settings in which HF care is likely to occur, as well as consideration of HF as both a primary and contributory cause for hospitalization.
Using nationally representative USA data, we estimated secular trends in the incidence of HF-related inpatient admissions and ED visits among adults with diabetes versus adults without diabetes between 2006 and 2017.
Methodology
The National Inpatient Sample (NIS) and the Nationwide Emergency Department Sample (NEDS)
We analyzed annual data (2006–2017) from the Agency for Healthcare Research and Quality’s NIS and NEDS.15 NIS and NEDS, the largest all-payer inpatient and ED databases in the USA, includes 7 million and 30 million unweighted annual visits, respectively.15 Both data sets approximate a 20% stratified sample of discharges and can be weighted to provide nationally representative estimates. Rehabilitation and long-term acute care hospitals are excluded from NIS. Both NIS and NEDS include International Classification of Diseases Clinical Modification (ICD-CM) diagnostic codes as well as patient demographics, hospital characteristics, payment sources, patient disposition and total charges. Both NIS and NEDS data represent hospital discharges, not individual persons, and therefore our analysis does not account for multiple admissions per person.
A hospitalization was considered to be related to HF if at least one ICD-9-CM diagnosis code 428.x between January 2000 and September 2015, or ICD-10-CM diagnosis code I50.x between October 2015 and December 2017, appeared in NIS or NEDS data. This approach is aimed to better capture the overall burden of HF by including HF listed as the primary or contributory cause of the hospitalization. In a sensitivity analysis, we defined HF as the primary cause of hospital admission in NIS and NEDS between January 2006 and September 2015. This analysis was restricted to September 2015 and earlier due to known coding changes implemented in October 2015 that impacted the likelihood of HF being listed as the primary cause of hospital admissions in later years.16 The 2015 population data (from National Health Interview Survey (NHIS)) were weighted by 0.75 to reflect that only three-quarters of the numerator data was used.17 To avoid double-counting, we excluded ED visits where the disposition was admission to the hospital because these HF events were accounted for in the inpatient data. Each HF-related admission was considered to be related to diabetes if any of the listed diagnoses also included a diabetes code (ICD-9-CM: 250 .x, 357.2, 366.41; ICD-10-CM: E10, E11 and E13). Comorbidities, adapted from the Charlson Comorbidity Index, among hospitalized patients with HF and with or without diabetes were defined using ICD-9-CM and ICD-10-CM, as appropriate (see online supplemental table 1).
Supplemental material
The National Health Interview Survey
Using annual data (2006–2017) from the NHIS, we estimated the number of persons aged ≥18 years with and without diabetes.18 The NHIS is a household-based survey of the health of the civilian, non-institutionalized USA population.18 We defined adults with diabetes if the sample adult responded yes to the question, ‘other than during pregnancy, have you ever been told by a doctor or other health professional that you have diabetes or sugar diabetes?’. This survey does not distinguish between diabetes types; but given that type 2 diabetes accounts for 90%–95% of all diabetes cases,19 we consider the results of this study to be generalizable to people with diagnosed type 2 diabetes. Data from the NHIS were weighted to make estimates representative of the demographic characteristics of the US civilian non-institutionalized population.
Statistical analysis
We reported the crude weighted number of patients with HF at the start (2006), middle (2011) and end (2017) of the study period, stratified by diabetes status, and age group, sex, location (urban, micropolitan and rural), household income (quartiles), USA region (northeast, midwest, south and west) and comorbidities for both NIS and NEDS. The weighted results estimate the number of inpatient admissions and non-admission ED visits in the USA due to HF.
Annual rates were calculated as the number of HF hospitalizations with and without diabetes (as determined from NIS and NEDS), divided by the number of persons with and without diabetes (as determined from NHIS). We reported age-standardized rates of HF per 1000 adults with diabetes and per 1000 adults without diabetes. Age (grouped into 18–44, 45–64, 65–74 and ≥75 years) and sex-specific rates were also calculated. Rates were age standardized using the 2000 USA standard population. Excess risk between diabetes and non-diabetes populations was estimated as rate ratios (RRs). We used SAS-callable SUDAAN (RTI International) to account for the complex sampling design in NIS, NEDS and NHIS, and the Taylor series linearization was used to estimate the variance of the ratio of the numerator and denominator. The delta method was used to compute SEs and 95% CIs for rates and RRs accounting for the weighted design of NIS, NEDS and NHIS.20
In 2012, the NIS sampling design was changed, which has implications for trend analyses. Per NIS guidelines, we used NIS-provided trend weights for the years preceding 2012 and the discharge weights beginning in 2012 to make the discharge outcome consistent with the new sampling design.21
Joinpoint regression was used to examine trends over time.22 This software uses permutation tests to identify points where linear trends change significantly in either direction or magnitude and calculates an annual percentage change (APC) for each time period identified. A maximum of two joinpoints were specified. A p value of <0.05 was established as statistical significance.
Results
Characteristics of adults with HF in inpatient (NIS) and ED (NEDS) settings in 2006, 2011 and 2017, and by diabetes status, are described in table 1. In brief, among HF-related inpatient admissions and ED visits between 2006 and 2017, there was an increase in the proportion of men, middle-age adults (aged 45–64 and 65–74 years), adults residing in urban settings, adults reporting low-income households and adults living in the West. This was broadly true for people with and without diabetes. In addition, the proportion of HF hospitalizations, both in ED and inpatient settings, with comorbidities increased in people with and without diabetes with a few exceptions: HF-related hospitalizations with cerebrovascular disease and severe renal disease decreased over time in people with and without diabetes, and the proportion of HF-related hospitalizations with peptic ulcer disease, HIV, malignancy or metastatic solid tumor did not change over time in people with or without diabetes. The increasing proportion of most comorbidities was, generally, higher in people with as compared without diabetes.
Characteristics of adults with HF in inpatient (NIS) and ED (NEDS) settings, by diabetes status,* 2006, 2011 and 2017
National Inpatient Sample
In 2017, rates of HF-related inpatient admissions were more than five times as high in adults with versus without diabetes (RR: 5.1 (95% CI 4.7 to 5.5)), a significant increase from 3.6 (95% CI 3.3 to 4.0) in 2006 (table 2). Overall, between 2006 and 2013, rates of HF-related inpatient admissions did not change among adults with diabetes, and then increased sharply between 2013 and 2017 from 50.4 to 62.3 per 1000 persons (APC: 4.8 (95% CI 0.3 to 9.6) (figure 1A and table 2). Among adults without diabetes, the opposite was observed: between 2006 and 2014, rates declined from 14.8 to 11.7 (APC −2.3 (95% CI –3.2 to –1.2) and plateaued thereafter. Similar patterns were observed in both men and women.
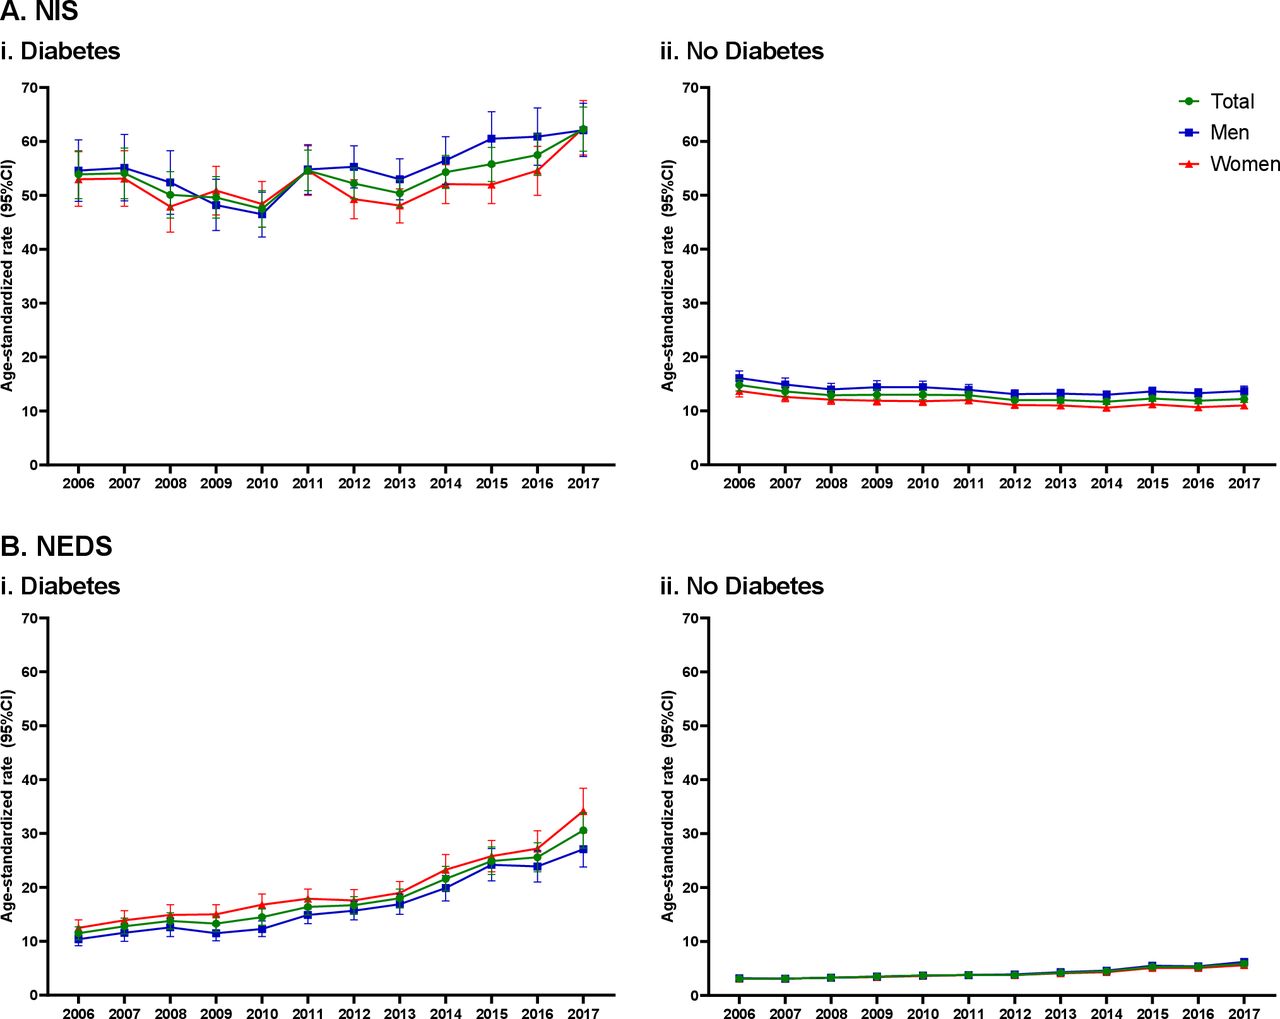
Age-standardized inpatient admission (NIS (A)) and ED visit (NEDS (B)) rates for HF in people with (i) versus without diabetes (ii) in the USA between 2006 and 2017. HF, heart failure; NEDS, Nationwide Emergency Department Sample; NIS, National Inpatient Sample.
Age-standardized inpatient admission rates and rate ratios (RRs)* for HF in adults with versus without diabetes in the USA between 2006 and 2017
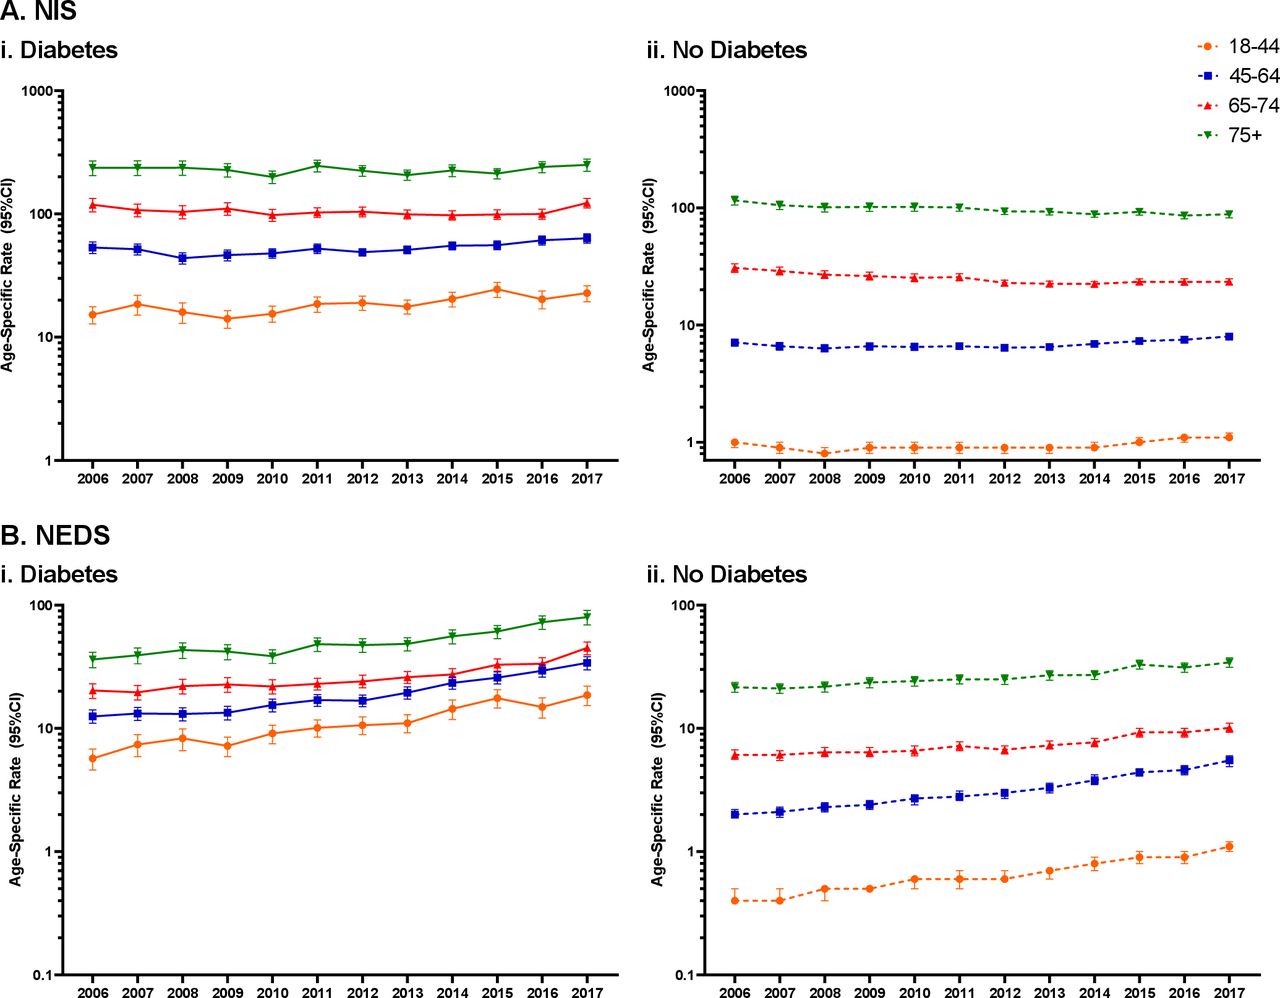
By age, differences were noted (figure 2A and table 2). First, the excess risk associated with diabetes decreased with increasing age. For example, the 2017 RR was 20.2 (95% CI 16.9 to 23.5) versus 2.8 (95% CI 2.5 to 3.2) for those aged 18–44 and ≥75 years, respectively. Second, in adults aged 18–44 years with and without diabetes, rates of HF-related inpatient admissions increased similarly such that there was no significant change in the excess risk associated with diabetes over time. Third, among adults aged 45–64 and 65–74 years with and without diabetes, HF rates increased after a period of decline and the excess risk associated with diabetes increased. Last, among adults aged ≥75 years, rates of HF-related inpatient admissions declined throughout the study period in adults without, but not with, diabetes and the excess risk associated with diabetes increased (from RR of 2.0 to 2.8; APC 2.4 (95% CI 0.6 to 4.2)).
Age-specific inpatient admission (NIS (A)) and ED visit (NEDS (B)) rates for HF in people with (i) versus without diabetes (ii) in the USA between 2006 and 2017. HF, heart failure; NEDS, Nationwide Emergency Department Sample; NIS, National Inpatient Sample.
Nationwide Emergency Department Sample
In 2017, rates of HF-related ED visits were more than five times as high in adults with versus without diabetes (RR: 5.2 (95% CI 4.5 to 5.9)), a significant increase from 3.7 (95% CI 3.2 to 4.1) in 2006 (table 3). Overall, between 2006 and 2017, rates of HF-related ED visits increased in adults with (from 11.5 to 43.6 per 1000 persons) and without (from 3.1 to 5.9 per 1000 persons) diabetes (figure 1B and table 3). However, the rate of increase was greater in adults with diabetes, leading to an increase in the excess risk of HF-related ED visits associated with diabetes over.
Age-standardized ED visit rates and rate ratios (RRs)* for HF in adults with versus without diabetes in the USA between 2006 and 2017
Increases in HF-related ED visits were observed across all age groups and in adults with and without diabetes (figure 2B and table 3). For all age groups, excluding 65–74 years, the excess risk associated with diabetes did not significantly change over time, indicating increasing rates of HF ED visits were similar in adults with and without diabetes. However, among adults aged 65–74 years, the HF rate increase was greater in adults with diabetes, leading to an increase in the excess risk associated with diabetes over time (from RR of 3.3 to 4.4; APC 2.0 (95% CI 0.7 to 3.3)).
Sensitivity analyses
In a sensitivity analysis, we examined trends in HF inpatient admissions and ED visits between 2006 and 2015 where HF was defined as the primary reason for the admission (online supplemental tables 2 and 3). Overall, in 2015 rates of primary inpatient HF admissions and HF ED visits were 4.7 (95% CI 4.4 to 5.1) and 3.2 (95% CI 2.8 to 3.5) times as high in adults with versus without diabetes, respectively.
Though absolute rates were substantially lower when HF was defined as the primary (vs any) reason for admission, inpatient patterns were similar insofar as the excess risk associated with diabetes, particularly among younger adults, increased over time (online supplemental table 2). This was driven by continued declines in HF rates among people without diabetes throughout the study period, while HF rates among people with diabetes plateaued from approximately 2010 onwards. For HF-related ED visits defined as the primary cause, the excess risk associated with diabetes also increased over time driven by increases in HF rates among people with, but not without, diabetes in the latter study period (online supplemental table 3).
Discussion
In this study, we provide the first comprehensive summary of trends of HF-related inpatient admissions and non-admitted ED visits in the USA among adults with and without diabetes and note several important findings. First, rates of HF-related inpatient admissions and ED visits were three to five times higher in adults with versus without diabetes, and this excess risk has increased over time. Second, while absolute rates remained lowest in the youngest age groups, the greatest relative increases in HF-related inpatient admissions and ED visits were observed in young adults with diabetes. Third, increases in HF-related utilization among adults with diabetes was observed in both inpatient and ED settings, suggesting broader underlying causes rather than a shift in treatment setting.
Our results are consistent with the few studies that have reported changes in HF incidence over time. In the USA, a NIS-based study reported a 3.6% annual decline in HF inpatient admissions among adults ≥35 years with diabetes between 1998 and 2014.13 This decline was likely driven by significant decreases in the earlier period (ie, 1998–2006) and explains why we, in contrast, observed a non-significant decline in HF-related inpatient admissions from 2006 to 2013. Another study, also using the NIS, reported an overall 38.9% decline in primary HF admissions in people with diabetes between 1995 and 2015.12 This decline also appeared to be driven by reductions in the earlier study period as non-significant increases were observed between 2013 and 2015.12 In Spain, a significant 5.4% annual increase in HF hospitalizations was observed between 1997 and 2010 in patients with diabetes, broadly similar to findings in the current study.23 However, the NIS-based studies and the Spanish study did not compare changes in HF incidence in people with versus without diabetes. This comparison is necessary to understand whether diabetes is an underlying cause of changing HF rates and to develop targeted interventions to reduce the HF burden in this subpopulation. Only one other study has compared rates of HF hospitalizations in people with versus without diabetes. In Sweden, a 29% decrease in HF hospitalization rates, defined as primary of contributory cause, among persons with type 2 diabetes was observed between 1999 and 2013, and this decline was greater than what was observed for people without type 2 diabetes.24 Unfortunately, data beyond 2013 were not available, and thus, it remains to be elucidated whether the recent increase in HF hospitalizations seen in our US data is also occurring in other populations and settings.
The increasing rates of HF among people with diabetes, especially young adults with diabetes, are consistent with a recent resurgence of other diabetes-related complications in the USA.25 Between 2010 and 2015, national data show increases in lower extremity amputations (LEAs)26 and hyperglycaemic crises among adults with diabetes,27 while long-term declines in end-stage renal disease, acute myocardial infarction (AMI) and stroke have stalled.25 These trends appear to be driven by increases in young (aged 18–44 years) and middle-aged (aged 45–64 years) adults, among whom the risk of hyperglycaemic crisis, AMI, stroke and LEAs each increased by more than 25% between 2010 and 2015.25 We add to this growing body of literature that increases in HF also disproportionally affect young people with diabetes at or around the same time. There are several possible reasons to explain this observed increase. First, we have observed a changing profile of newly identified diabetes cases that are more obese and may have more poorly managed risk factors (eg, blood pressure and lipids) as compared with earlier years, particularly among younger adults.4 Second, a longer average duration of diabetes may be leading to a shift in risk of complications. Third, the younger age group may include a larger relative proportion of type 1 diabetes who may be at increased risk for HF. However, accumulating evidence suggests that diabetes complication rates may be higher in young adults with type 2 diabetes as compared with type 1 diabetes.28 Fourth, changes in healthcare policy such as the introduction of high-deductible health plans have led to reductions in early preventive care in people with diabetes.29 30 Fourth, increased costs of insulin and other diabetes medications may have led patients to cut back on treatment to minimize costs, thus exposing them to increased risk for complications including HF.31 Last, in 2012, the US Centers for Medicare and Medicaid Services implemented the Hospital Readmissions Reduction Program, which financially penalized hospitals with high 30-day readmission rates for HF.32 The role of this policy in influencing HF trends in the current study is unclear as NIS and NEDS do not identify hospital readmission. Overall, it is most likely that a combination of these factors explains the increases in HF-related ED visits and hospitalization among US adults with diabetes.
The results of this study offer important implications for public health and healthcare practice. First, in this study, we show that diabetes is associated with an almost fivefold increased risk for HF-related inpatient and non-admission ED visits. The continued increase in the prevalence of diabetes is likely to increase the number of people with HF in the future and will have important implications for both outpatient and hospital burdens, pharmacotherapies and resource allocation. Second, we hypothesize that increasing risk for HF may lead to an increase in subsequent HF-related mortality with some early evidence to support this hypothesis. For example, Cheng et al33 reported an increase in HF-related mortality among young US adults with diabetes between 1988 and 2015, despite mortality rates for several other CVDs declining in that time, and an Australian study reported no change in HF-related mortality despite declines for other CVD outcomes.34 Third, improved awareness by healthcare providers that diabetes is an important risk factor for HF might stimulate more intensive and focused prevention and management opportunities. For example, post hoc analysis of the Steno-2 trial in Denmark demonstrated a reduction in HF hospitalizations among patients with diabetes receiving intensive (vs conventional) therapy.35 Furthermore, emerging trial data of sodium-glucose cotransporters 2 (SGLT2) inhibitors show promising findings for HF. For example, randomized trials of SGLT2 inhibitors (vs placebo) have shown a pooled 31% reduction in HF hospitalizations in type 2 diabetes patients at high risk of CVD,36 as well as improved outcomes among those with existing diabetes and HF.37 Real-world studies, such as CVD-REAL (Comparative Effectiveness of Cardiovascular Outcomes in New Users of SGLT-2 Inhibitors), have also demonstrated the positive effects of SGLT-2 inhibitors in HF prevention in patients with type 2 diabetes, irrespective of atherosclerotic disease status.38 39
This is the largest study to explore rates of HF over time in USA adults with and without diabetes in two nationally representative patient datasets. Nonetheless, there are limitations to be considered. First, NIS and NEDS represent hospital discharges, not individual persons and therefore may include multiple hospital stays for some persons. This may lead to an increase in population-based rates, especially in certain subpopulations at higher risk for recurrence, including those with diabetes.40 However, the primary objective of this study was to examine changes in HF admissions over time in people with versus without diabetes. To that end, and in the absence of contrary data, we assume that the risk of readmission in people with versus without diabetes remained constant during the study period and readmissions are, therefore, unlikely to impact our key conclusions. Second, because of the inability to differentiate diabetes type in the NHIS survey data, we were not able to report trends in HF by diabetes type. Therefore, all types of diabetes are included in the current analysis with the assumption that the vast majority (~90%–95%) have type 2 diabetes.41 In addition, the NHIS is self-reported and does not include undiagnosed diabetes and thus likely underestimates the number of people with diabetes in the population. Furthermore, the underlying characteristics of people with diagnosed diabetes could be changing over time. However, there have not been adequate data or studies to characterize such changes. Third, a shift from ICD-9-CM to ICD-10-CM in October 2015 may have affected our observed rates. However, observed changes in trends occurred before this period, and therefore, it is unlikely that this coding shift influenced the overall patterns that we observed in this study. Furthermore, coding changes do not explain differential increases in people with versus without diabetes and in younger versus older adults. Fourth, admissions for hypertensive heart disease with HF were not included in the current analysis. Fifth, NIS and NEDS do not report HF stages and we were unable to explore differential impacts of diabetes on HF stages, though this is an important future direction. Sixth, location (urban/rural) and poverty status, although available in NHIS, were not categorized in the same way in NEDS and NIS, so these factors were excluded from rate calculations. In addition, the race/ethnicity variable in NIS was incomplete prior to 2012, and so trends were not calculated by race/ethnicity. Finally, this is a descriptive observational study designed to assess the relative burden of HF hospitalizations in people with versus without diabetes over time. Future studies with more appropriate datasets (ie, with individual level data) are needed to tease out the underlying mechanisms with which diabetes leads to an increase in HF hospitalization, particularly among young adults.
Conclusions
In this nationally representative study, we show that: (1) rates of HF-related inpatient admissions increased in adults with, but not without, diabetes and (2) rates of HF-related ED visits increased in adults with and without diabetes, but absolute and relative increases were greater in adults with diabetes; and (3) the greatest relative increases in HF-related inpatient admissions and non-admission ED visits was seen among young adults with diabetes. More detailed and subnational data analyses may help to investigate the aetiology and determine clinical and public health strategies to address these growing burdens.
Data availability statement
Data are available in a public, open access repository. The data that support the findings of this study are publicly available from the National Center for Health Statistics and the Agency for Healthcare Research and Quality. All data are deidentified.
Ethics statements
Patient consent for publication
Ethics approval
The NHIS, NIS and NEDS databases are publicly available and do not contain direct personal identifiers and are therefore exempt from review by the institutional review boards of the Centers for Disease Control and Prevention and Emory University.
Acknowledgments
The authors would like to thank the women and men who participated in the National Health Interview Survey (NHIS), as well as all the staff involved at the NCHS and HCUP for study design, data collection and data dissemination.
References
Supplementary materials
Supplementary Data
This web only file has been produced by the BMJ Publishing Group from an electronic file supplied by the author(s) and has not been edited for content.
Footnotes
Contributors JLH designed the study, conducted the analyses, interpreted the results and wrote the manuscript. SRB and IH conducted the analysis, contributed to interpretation and reviewed the manuscript. LS provided clinical input, contributed to interpretation and reviewed the manuscript. RJ, REP and MKA contributed to interpretation and reviewed the manuscript. KMVN conceptualized the manuscript, contributed to interpretation and reviewed the manuscript. JLH is the guarantor of this work and takes responsibility for the integrity of the data and final responsibility for the decision to submit for publication.
Funding Research reported in this publication was supported by the National Institute of Diabetes and Digestive and Kidney Diseases of the National Institutes of Health under Award Number P30DK111024 and the National Institute on Minority Health and Health Disparities grant U01MD010611. The findings and conclusions in this report are those of the authors and do not necessarily represent the official position of the Centers for Disease Control and Prevention or the National Institutes of Health.
Competing interests None declared.
Provenance and peer review Not commissioned; externally peer reviewed.
Supplemental material This content has been supplied by the author(s). It has not been vetted by BMJ Publishing Group Limited (BMJ) and may not have been peer-reviewed. Any opinions or recommendations discussed are solely those of the author(s) and are not endorsed by BMJ. BMJ disclaims all liability and responsibility arising from any reliance placed on the content. Where the content includes any translated material, BMJ does not warrant the accuracy and reliability of the translations (including but not limited to local regulations, clinical guidelines, terminology, drug names and drug dosages), and is not responsible for any error and/or omissions arising from translation and adaptation or otherwise.