Article Text

Abstract
Introduction Gestational diabetes mellitus (GDM), a common pregnancy disorder, increases the risk of fetal overgrowth and later metabolic morbidity in the offspring. The placenta likely mediates these sequelae, but the exact mechanisms remain elusive. Mitochondrial dynamics refers to the joining and division of these organelles, in attempts to maintain cellular homeostasis in stress conditions or alterations in oxygen and fuel availability. These remodeling processes are critical to optimize mitochondrial function, and their disturbances characterize diabetes and obesity.
Methods and results Herein we show that placental mitochondrial dynamics are tilted toward fusion in GDM, as evidenced by transmission electron microscopy and changes in the expression of key mechanochemical enzymes such as OPA1 and active phosphorylated DRP1. In vitro experiments using choriocarcinoma JEG-3 cells demonstrated that increased exposure to insulin, which typifies GDM, promotes mitochondrial fusion. As placental ceramide induces mitochondrial fission in pre-eclampsia, we also examined ceramide content in GDM and control placentae and observed a reduction in placental ceramide enrichment in GDM, likely due to an insulin-dependent increase in ceramide-degrading ASAH1 expression.
Conclusions Placental mitochondrial fusion is enhanced in GDM, possibly as a compensatory response to maternal and fetal metabolic derangements. Alterations in placental insulin exposure and sphingolipid metabolism are among potential contributing factors. Overall, our results suggest that GDM has profound impacts on placental mitochondrial dynamics and metabolism, with plausible implications for the short-term and long-term health of the offspring.
- placenta
- GDM
- mitochondria
This is an open access article distributed in accordance with the Creative Commons Attribution Non Commercial (CC BY-NC 4.0) license, which permits others to distribute, remix, adapt, build upon this work non-commercially, and license their derivative works on different terms, provided the original work is properly cited, appropriate credit is given, any changes made indicated, and the use is non-commercial. See: http://creativecommons.org/licenses/by-nc/4.0/.
Statistics from Altmetric.com
Significance of this study
What is already known about this subject?
Alterations in mitochondrial dynamics characterize obesity and cardiometabolic conditions; however these have not been examined in the placentae of women with gestational diabetes mellitus (GDM).
What are the new findings?
Placental mitochondrial dynamics are tilted toward fusion in GDM, possibly driven by abnormal maternal and/or fetal insulin levels.
Insulin-mediated upregulation of ASAH1 leading to reduced placental ceramide may contribute to the increased mitochondrial fusion in GDM.
How might these results change the focus of research or clinical practice?
The observed changes in placental mitochondrial dynamics in GDM likely reflect deranged placental metabolism, with plausible implications for the short-term and long-term health of the offspring.
Variations in placental mitochondrial metabolic flexibility may contribute to the heterogeneity and unpredictability of adverse pregnancy outcomes in diabetes.
Future studies should examine a) whether changes in placental mitochondrial dynamics in GDM correlate with changes in trophoblast cell metabolism and feto-maternal insulin levels in vivo, and b) whether feto-maternal insulin levels affect placental sphingolipid homeostasis.
Introduction
Gestational diabetes mellitus (GDM) is a heterogeneous disorder of maternal glucose metabolism, less severe than overt diabetes.1 Variable degrees of maternal prepregnancy insulin resistance and underlying defects in insulin secretion, superimposed on the metabolic ‘stress test’ of pregnancy, are central to its pathogenesis.2 The environmental and genetic risk factors of GDM overlap significantly with those of type 2 diabetes,3 and women with prior GDM carry a sevenfold increased risk of developing type 2 diabetes after pregnancy.4 In utero exposure of offspring to GDM may lead to perinatal complications, such as fetal macrosomia, and increased cardiometabolic morbidity later in life through fetal programming.5
The placenta, a highly metabolic organ between the maternal and fetal circulations, likely mediates many of the short-term and long-term effects of maternal diabetes, but the exact molecular mechanisms remain elusive. At the fetal–maternal interphase, the placenta is affected by both maternal and fetal metabolic milieus and their possible derangements. In GDM, preconceptual maternal metabolic abnormalities, such as hyperinsulinemia and dyslipidemia, may impinge on placental development already from conception, whereas hyperglycemia of variable severity and time of onset contribute to later placental alterations.2 6 In addition, maternal obesity, GDM treatment modality and fetal physiological responses to GDM exposure may all influence placental metabolism and nutrient transport.2 6
Mitochondria are plastic and mobile double-membrane organelles with vital roles in cellular respiration, oxygen sensing, redox balance and cell death. In attempts to maintain metabolic and energy homeostasis, they respond to alterations in their cellular environment and physiological demands through functional remodeling termed mitochondrial dynamics.7 Fusion is a process where ‘healthy’ portions of mitochondria join together to share and redistribute content, resulting in elongated mitochondrial networks with improved function.8 Fission, in contrast, generates new smaller fragmented organelles, allowing for mitochondria that are beyond repair to be eliminated by mitophagy.8 Mitochondrial dynamic events are orchestrated by dynamin-related GTPases, a family of membrane-remodeling enzymes whose regulation is intimately linked to cellular metabolism and survival.7 Central to mitochondrial fission is dynamin-related protein 1 (DRP1), whose activation by phosphorylation at serine 616 and translocation from the cytosol to the OMM, leads to its ring-like oligomerization resulting in mitochondrial cleavage.9 Mitochondrial fusion, on the other hand, involves the coordinated merging of both outer mitochondrial membrane (OMM) and inner mitochondrial membrane (IMM). Tethering of two adjacent mitochondria at OMM is mediated by mitofusins 1 and 2 (MFN1 and MFN2).10 Optic atrophy protein 1 (OPA1), with soluble short and long IMM-resident isoforms, is required for IMM fusion10 and cristae maintenance.11 OPA1 overexpression yields interconnected tubular mitochondrial networks while its downregulation results in smaller, globular mitochondria.12
Inherited and acquired defects in mitochondrial function and dynamics characterize obesity and cardiometabolic conditions.13 14 However, our understanding of placental mitochondrial structure and function in the context of pregnancy-related metabolic morbidity remains elusive.15 We have previously reported that increased placental accumulation of ceramide in pre-eclampsia, a serious pregnancy disorder typified by maternal endothelial dysfunction, contributes to augmented trophoblast mitochondrial fission and cell death.16–18 Pre-eclampsia is common in diabetic pregnancies, and, interestingly, both conditions exhibit features of the ‘metabolic syndrome’.19 Although GDM is characterized by distinct alterations in feto-placental metabolism, placental mitochondrial dynamics have not been examined in the context of GDM. In the present study, we performed a systematic examination of placental mitochondrial dynamics in GDM. Our data reveal that placental mitochondrial dynamics shift toward fusion in GDM and that alterations in placental insulin exposure and ceramide metabolism may in part contribute to this phenomenon.
Research design and methods
Collection of placental samples and clinical information
Twenty-five women with GDM and 44 with normal pregnancies, matched according to gestational age at delivery, were recruited by the Research Centre for Women’s and Infant’s Health BioBank, Mount Sinai Hospital (MSH), Toronto, Canada. All participants provided a written informed consent. GDM was defined according to the Diabetes Canada Clinical Practice Guidelines.20 Diet and physical activity were prescribed as the first-line treatment to all patients, but if glycemic targets were not met, pharmacological therapy was initiated.20 In our study population, 12 women received diet-treatment only (D-GDM) and 13 women received also insulin (I-GDM). Placental tissue was collected according to the ethical guidelines of the University of Toronto, Faculty of Medicine and MSH, immediately after delivery and snap-frozen in liquid nitrogen or stored in 2% (v/v) glutaraldehyde. Available information on maternal age, parity and gravidity, prepregnancy weight and height, gestational weight gain (GWG), blood pressure, glycated hemoglobin (HbA1c) and obstetric and perinatal outcomes were extracted from the patient records of MSH. GWG was categorized according to the Institute of Medicine (IOM) criteria as adequate, below or above recommendations.21 Only singleton pregnancies were included. Pregnancies affected by smoking, substance abuse, hypertensive disorders of pregnancy, fetal malformations, chromosomal aberrations, intrauterine infections, placental disease, relative birth weight <−2.0 SD units, metformin treatment, or pre-existing diabetes were excluded.
Analysis of placental mitochondrial morphology using transmission electron microscopy (TEM)
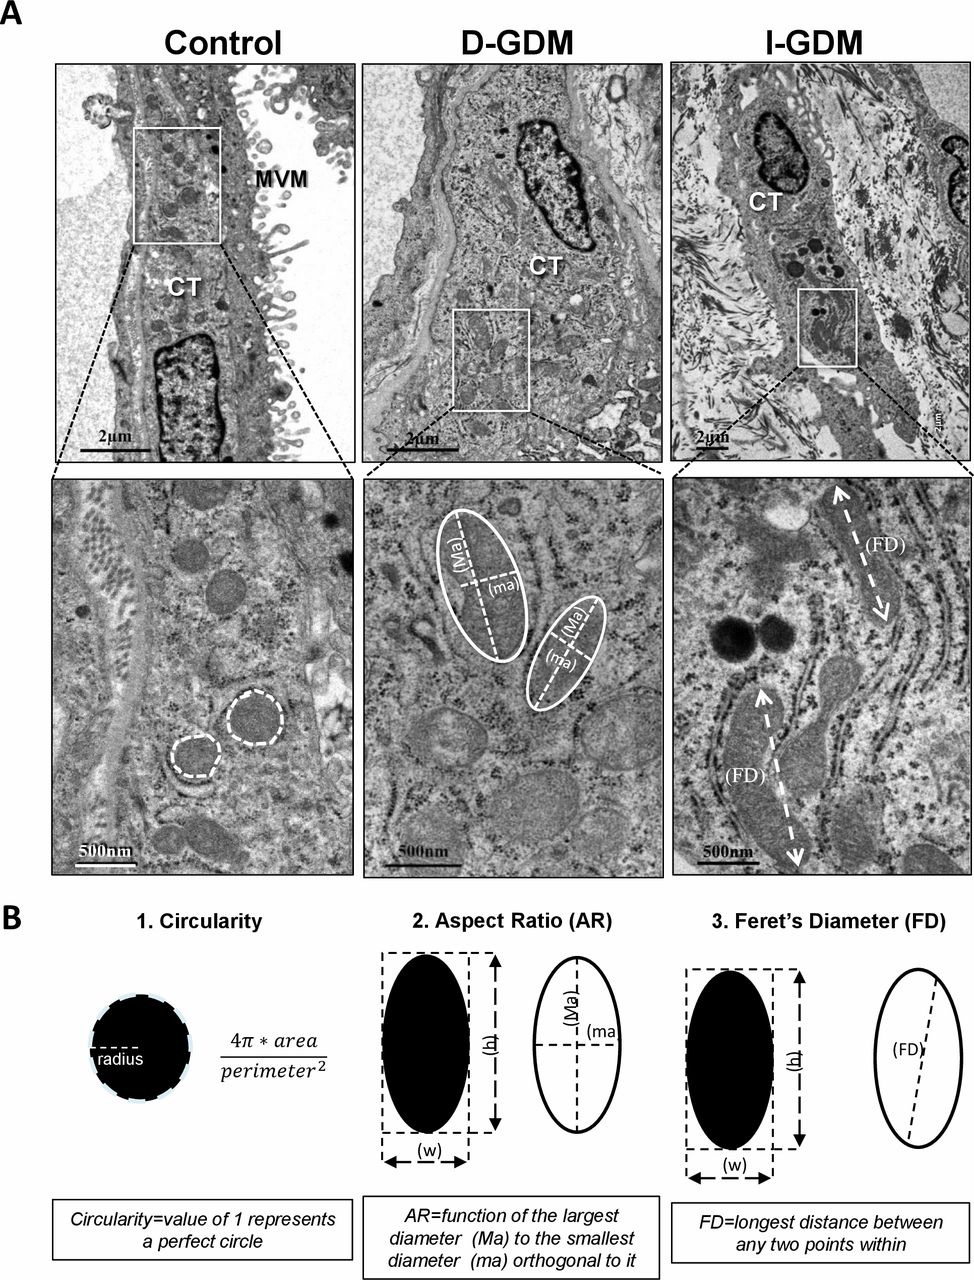
Placental tissue samples from D-GDM, I-GDM and control pregnancies were fixed in 2% (v/v) glutaraldehyde in 0.1 M cacodylate buffer (pH 7.3), and processed for TEM analysis at the The Hospital for Sick Children, Toronto, as previously described.16 Images were captured by a FEI Technai 20 (FEI, Hillsboro, Oregon, USA) and quantitative analysis of mitochondrial morphology was carried out using Image J (version 1.50i, National Institutes of Health, USA).
The following measurements and descriptors of mitochondrial size and shape were collected: surface area (µm2); perimeter (µm); Feret’s diameter (the longest distance (μm) between any two points within a given mitochondrion); aspect ratio (AR) ((major axis)/(minor axis)), which reflects the ‘length-to-width ratio’; form factor (FF) ((perimeter2)/(4π·surface area)), which reflects complexity and branching; circularity (4π·(surface area/perimeter2)) and roundness (4·(surface area)/(π·major axis2)), which are two-dimensional indexes of sphericity with value 1 indicating perfect spheroids.22 Mitochondrial density was defined as the number of mitochondria counted per µm2 of tissue section.
Cell line culture and treatments
JEG-3 cells (ATCC, Manassas, Virginia, USA) were cultured in 6-well plates with or without coverslips in 21% O2 at 37°C in Eagle’s Minimal Essential Media (EMEM) with 10% (v/v) fetal bovine serum and 1% (10 000 U/mL) of penicillin-streptomycin (Wisent Inc, Montreal, Quebec). At 60%–80% confluency, cells were treated with either 45 µM of glucose (GLU); 0.85 µM of insulin solution (INS; 10 mg/mL in 25 mM HEPES, catalog no. I9278, Sigma-Aldrich,); glucose plus insulin (GLU+INS); or with EMEM alone (control) for 24 hours. The treatment period was selected based on pilot time-study experiments testing 0.5, 3, 6 and 24 hours treatments. To block the actions of insulin, 15 µM of Genistein was applied to cells 1 hour before the GLU, INS or GLU+INS treatments. Controls were treated with vehicle, dimethyl sulfoxide (DMSO). After treatment, the cells were washed with phosphate-buffered saline (PBS) and either collected in RIPA buffer for western blot (WB) analysis or fixed with 3.7% (v/v) formaldehyde for immunofluorescence (IF) microscopy or processed in 2% (v/v) glutaraldehyde for TEM.
Western blotting
Both tissue samples from D-GDM, I-GDM, normal pregnancies and JEG-3 cells were homogenized in RIPA buffer (150 mM NaCl, 50 mM Tris, 1% (v/v) NP-40, pH 7.5). Bradford protein assay and WB analyses were performed as outlined previously.16 17 23 Briefly, 50 µg of protein from placental samples and 30 µg of protein from JEG-3 cells were separated on 7.5%–10% gradient sodium dodecyl sulfate–polyacrylamide gels (Bio-Rad, Mississauga, Ontario, Canada). After electrophoresis, proteins were transferred to methanol-hydrated polyvinylidene difluoride membranes (Immun-Blot PVDF Membrane, Bio-Rad) and blocked with 5% (w/v) non-fat milk dissolved in Tris-buffered saline containing 0.1% (v/v) Tween-20 (TBS-T) for 1 hour at room temperature. After an overnight incubation with primary antibodies at 4°C, membranes were washed in TBS-T and incubated for 1 hour with the secondary antibody. Proteins were visualized by enhanced chemiluminescence reagent (PerkinElmer Inc, Waltham, Massachusetts, USA). Densitometry was conducted using ImageQuant 5.0 software (Molecular Dynamics, GE Healthcare, La Jolla, California, USA) or ImageJ (version 1.50i, National Institutes of Health, USA). Protein levels were corrected for background and normalized to β-actin (ACTB) volumes.
IF microscopy
JEG-3 cells cultured on coverslips in 6-well plates were treated with 100 nM of MitoTracker Red FM (Molecular Probes Inc, Oregon, USA) for 25 min, washed with PBS and fixed with 3.7% (v/v) formaldehyde. IF staining was performed as previously described.16 IF intensity and colocalization were quantified using ImageJ and Volocity software version 6.3, respectively, as reported.24
Mitochondria isolation
Mitochondrial isolates (MIs) were prepared from GDM and control placentae as previously reported.16 Briefly, small pieces of placental tissue were rinsed with isotonic saline solution and suspended in ice-cold buffer containing 0.25M sucrose, 0.001M EDTA, 10 mM Tris-HEPES at pH 7.4. The tissue was homogenized and subsequently centrifuged at 1300 g for 5 min at 4°C. The supernatant was collected and centrifuged at 12 000 g for 15 min at 4°C, yielding an MI pellet and a postmitochondrial supernatant. MI fractions were validated using TOM20, a marker of OMM, and assessed by WB for OPA1 and pDRP1.
Lipid mass spectral analysis
Placental tissue and mitochondria from control, D-GDM and I-GDM women were processed for lipid analysis as described previously.16 Following lipid extraction, ceramide species were quantified using high performance liquid chromatography coupled to tandem mass spectormetry (LC-MS/MS) at the Analytical Facility for Bioactive Molecules, Hospital for Sick Children, Toronto, Canada.
Antibodies
The following primary antibodies were used: DRP1 (mouse (WB: 1:500)) and pDRP1 (S616) (3455 S, rabbit (WB 1:1000, IF: 1:500)) from Cell Signalling Technology (Danvers, Massachusetts, USA); OPA1 (612607, mouse (WB 1:1000, IF: 1:750)) from BD Biosciences (Mississauga, Ontario, Canada); MFN1 (rabbit (WB: 1:1000) from ThermoFisher Scientific (Mississauga, Ontario, Canada); acid ceramidase (ASAH1) (OAPB00726, rabbit (WB 1:1000) from Aviva Systems Biology (Cedarlane, Burlington, Ontario, Canada); and ACTB (β-actin; I-19, sc-1616, goat (WB 1:2000)) from Santa Cruz Biotechnology (Mississauga, Ontario, Canada). Secondary antibodies included goat anti-rabbit IgG-HRP (sc-2054 (WB: 1:2000)) and goat anti-mouse IgG-HRP (sc- 2005 (WB: 1:2000)) from Santa Cruz Biotechnology. For IF experiments, Alexa Fluor 488 donkey anti-rabbit IgG (A21206), Alexa Fluor 594 donkey anti-rabbit IgG (A21207) and Alexa Fluor 594 donkey anti-mouse IgG (A21203) by ThermoFisher Scientific were used.
Statistics
Statistical analysis was performed using GraphPad Prism 8 for Windows 64-bit (version 8.1.2 (332), 6 May 2019) and IBM SPSS Statistics V.25.0. Categorical variables were analyzed with the χ2 test. For the comparison continuous variables in two groups, Student’s t-test or Mann-Whitney U test was used, as appropriate. In case of more than two comparison groups, one-way analysis of variance or Kruskal-Wallis test were applied followed by Tukey’s or Dunn’s post hoc tests, respectively, when n>3 per group, and pairwise t-tests between individual groups were used when n=3 per group. Data are presented as means (SD) or medians (IQR or range). P values <0.05 were considered statistically significant.
The types of biological specimen examined and the respective laboratory methods used in their analyses are outlined in online supplementary table 1.
Supplemental material
Results
Maternal characteristics and perinatal outcomes of women with D-GDM, I-GDM and normal pregnancies are displayed in table 1. Maternal prepregnancy body mass index (BMI) was higher in I-GDM compared with control women. By definition, plasma glucose levels in glucose challenge test and/or oral glucose tolerance test were higher in GDM women as compared with control women. Late-pregnancy HbA1c level was higher in I-GDM compared with D-GDM. Gestational age at birth was slightly lower in I-GDM women, probably reflecting the practice of labor induction. With respect to other obstetric and perinatal characteristics, including fetal sex as well as placental and birth weight, no statistically significant differences were observed between the GDM groups and controls. Only one newborn infant of a woman with I-GDM had a relative birth weight >2 SD units.
Maternal and perinatal characteristics of women with diet-treated (D-GDM) or insulin-treated (I-GDM) gestational diabetes and control women with normal pregnancies
Mitochondrial fusion is increased in GDM placentae
Considering that the cytotrophoblast (CTB) is the most metabolically active, proliferating cell layer of the placenta,25 we started by examining the morphology of 171, 162 and 308 CTB mitochondria in D-GDM, I-GDM and control placentae, respectively, using TEM. Qualitative examination revealed a dominance of elongated mitochondria in the CTB of both D-GDM and I-GDM placentae as compared with control tissues that exhibited more globular mitochondria (figure 1A). Next, we performed a systematic collection and analysis of mitochondrial measurements (figure 1B and table 2). Mitochondrial number was significantly decreased in CTB cells in both D-GDM and I-GDM compared with controls. In contrast, mitochondrial size, reflected by surface area, perimeter, minor and major axes and Feret’s diameter, was markedly increased in the GDM groups compared with controls. Also mitochondrial shape was more elongated as the median AR was higher in GDM (1.65) compared with controls (1.53) when D-GDM and I-GDM patients were analyzed together (p=0.01). No differences in the circularity, roundness or complexity and branching (FF) of mitochondria were observed between the groups. Taken together, our data indicate that mitochondrial fusion dominates in the CTB of GDM placentae as compared with healthy control placentae.
Mitochondrial descriptors and measurements obtained from TEM images of placental cytotrophoblast cells from control pregnancies (n=6), diet-treated (D-GDM; n=2) and insulin-treated (I-GDM; n=2) gestational diabetes pregnancies

TEM analysis of mitochondrial dynamics in placentae from women with gestational diabetes. (A) Representative TEM images of placental cytotrophoblast cells in a normal pregnancy and in pregnancies complicated by diet-treated (D-GDM) and insulin-treated (I-GDM) gestational diabetes. (B) Methods for quantifying mitochondrial circularity, aspect ratio and Feret’s diameter on TEM images. TEM, transmission electron microscopy.
As placental tissue is metabolically and structurally heterogenous,26 we next examined mitochondrial dynamic events in other cell layers of the placenta. In line with our data from CTB, a prominent feature of GDM placentae was decreased mitochondrial density in the syncytiotrophoblast (STB) layer (online supplementary figure 1). Likewise, in the endothelium of chorionic villi, mitochondrial density was lower in GDM, but more variation was observed in both control and GDM samples. Quantification supported our observations, showing lower number of mitochondria per µm2 in GDM STB and fetal endothelium versus control tissues (online supplementary figure 1). In addition, TEM analysis revealed overall smaller and rounder mitochondria in STB compared with CTB, in both GDM and control samples, congruent with earlier observations.25 26
Supplemental material
Next, we assessed key mechanochemical mediators of mitochondrial fusion and fission in whole placental lysates. In agreement with TEM findings, increased levels of long and short isoforms of OPA127 were observed in GDM compared with control tissue (figure 2A, left panel), independent of treatment modalities. As MFN1 is required in IMM fusion mediated by OPA,12 we also analyzed its expression but found no alterations (figure 2A, right panel). While no statistically significant changes in DRP1 levels were found (p=0.07) (figure 2B, left panel), the active DRP1 (pDRP1) was decreased in GDM (figure 2B, right panel), indicating reduced mitochondrial fission. WB analysis of OPA1 and pDRP1 in placental mitochondria isolated from control and GDM placentae showed similar trends toward increased OPA1 and decreased pDRP1, although statistical significance was not reached (figure 2C).
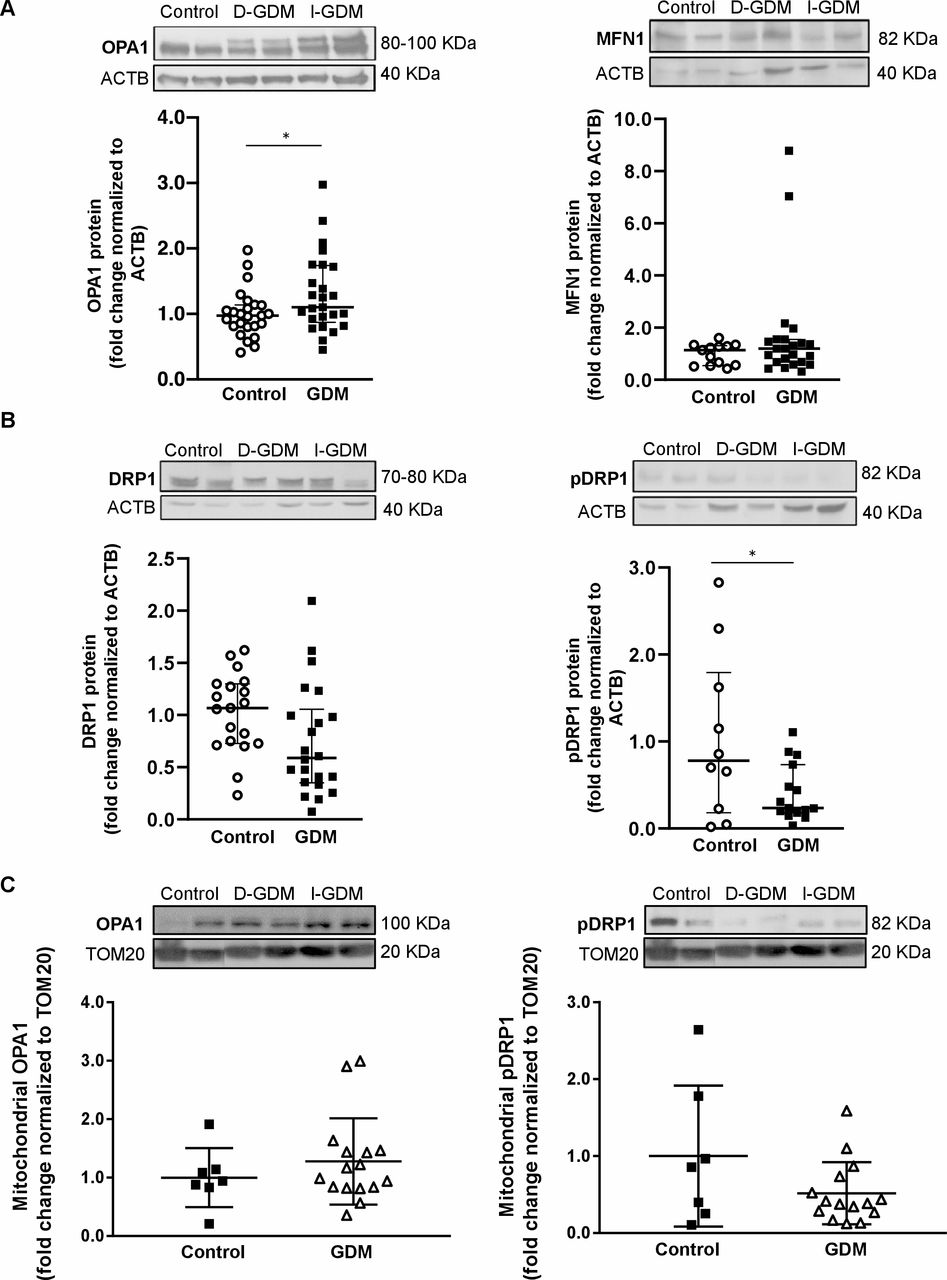
Placental levels of mitochondrial fusion and fission proteins in normal pregnancies compared with gestational diabetes pregnancies. (A) Representative western blots and associated densitometry analysis of fusion markers, OPA1 and MFN1, in control (n=25 and 13, respectively) versus gestational diabetes mellitus (GDM) placental tissue (n=25 and 23, respectively). (B) Representative western blots and associated densitometry analysis of fission regulator, Drp1 and its activated form, pDRP1, in control (n=19 and 12, respectively) versus GDM (n=22 and 15, respectively) placental tissue. (C) Representative western blots and associated densitometry analysis of OPA1 and pDRP1 levels in mitochondria isolated from control (n=7) versus GDM (n=16) placentae. Data are presented as median±IQR. *P<0.05 **p<0.01. D-GDM, diet-treated GDM; I-GDM, insulin-treated GDM; MFN1, mitofusin 1; OPA1, optic atrophy 1.
Since maternal obesity associates with placental mitochondrial alterations28 and GWG outside recommended ranges with adverse perinatal outcomes,29 we examined placental pDRP1 and OPA1 levels also in GDM subjects categorized based on maternal BMI and GWG. Interestingly, the median (IQR) placental OPA1 fold change, normalized to ACTB, was higher in GDM women with BMI <30 kg/m2 (1.29 (0.99/1.72), n=13) as compared with those with BMI ≥30 kg/m2 (0.75 (0.60/1.03), n=6), p=0.029. However, no statistically significant difference was observed in placental pDRP1 levels between these groups. Neither were there any statistically significant differences in placental OPA1 or pDRP1 levels between GDM women with appropriate GWG versus GWG below or above the IOM recommendations.21
Yet another potential confounding factor is the delivery mode. Hence, we examined the effect of labor on placental mitochondrial dynamics enzymes in placentae from control women with either a vaginal delivery or a cesarean section after labour (L; n=7) and in placentae from controls with a cesarean section without preceeding labor (NL; n=7). No statistically significant differences in mean (SD) pDRP1 (L vs NL: 0.90 (0.28) vs 1.00 (0.21), p=0.32) or OPA1 protein fold changes (L vs NL: 0.84 (0.37) vs 1.00 (0.11), respectively, p=0.71) were observed.
Insulin promotes mitochondrial fusion in JEG-3 cells
JEG-3 cells have been demonstrated to be a suitable cell line for modeling the effects of insulin on trophoblast metabolism and placental function.30 Hence, to mimic the effects of hyperinsulinemic and/or hyperglycemic environment on trophoblast mitochondrial dynamics, we treated JEG-3 cells with 0.85 µM INS, 45 mM GLU, INS+GLU, or control vehicle EMEM (VEH) for 24 hours. WB analysis revealed increased OPA1 levels in JEG-3 after 24 hours treatment with INS compared with VEH and a similar trend, although not statistically significant, in GLU+INS versus VEH treated cells (figure 3A). In contrast, exposure of JEG-3 cells to INS with or without GLU resulted in decreased pDRP1 levels compared with cells treated with GLU or VEH (figure 3B). Accordingly, TEM demonstrated elongated and larger mitochondria in JEG-3 cells following treatment with INS or GLU+INS relative to VEH (figure 3C). In contrast, exposure of JEG-3 cells to GLU yielded smaller, circular mitochondria suggestive of fission (figure 3C).
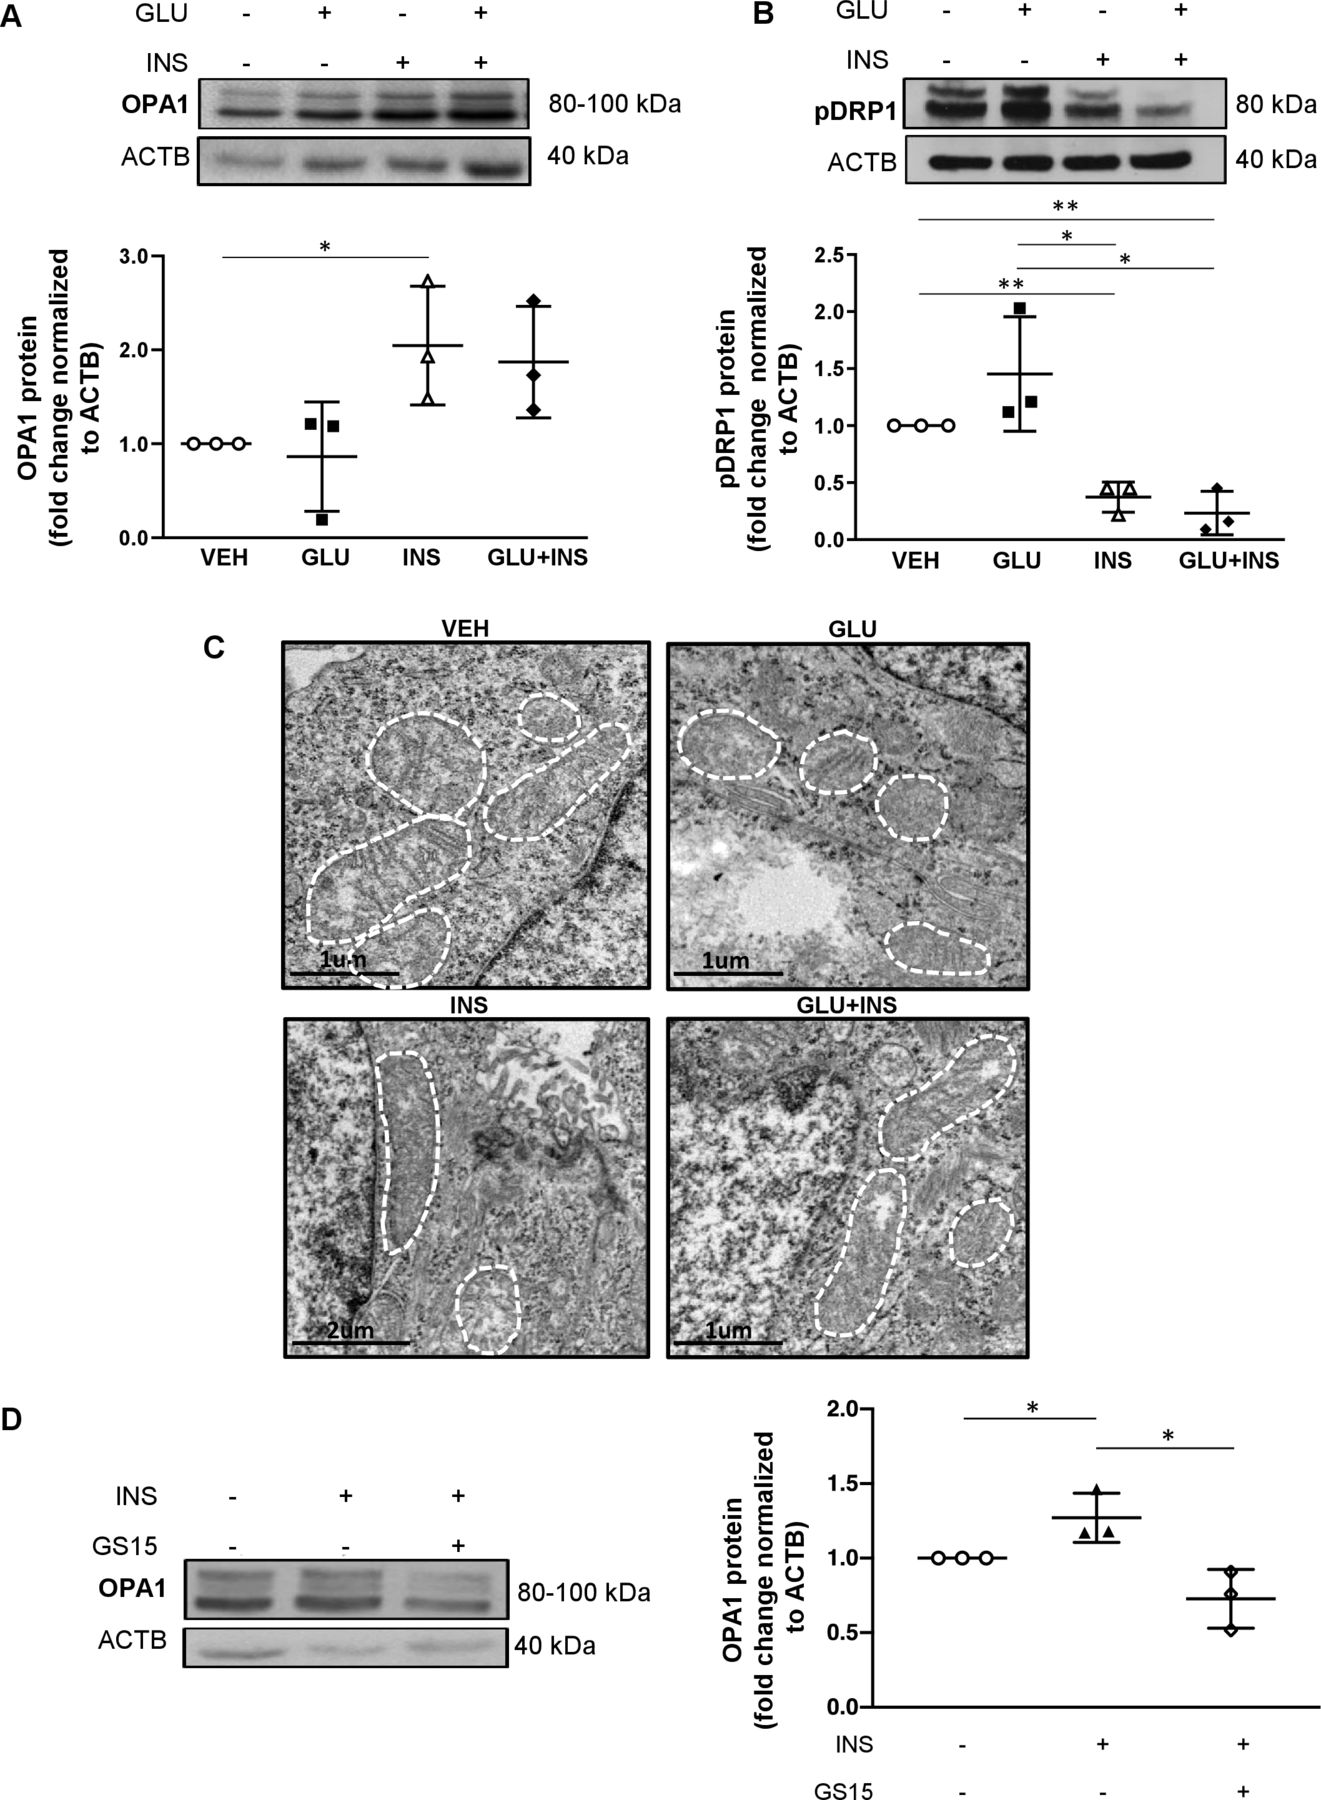
Effects of insulin and/or glucose exposure on mitochondrial fission and fusion protein expression in choriocarcinoma JEG-3 cells. Representative western blots and associated densitometry (n=3 separate experiments in duplicate) for (A) OPA1 and (B) pDRP1 in JEG3 cells treated with EMEM (VEH), glucose (GLU), insulin (INS), and glucose and insulin (GLU+INS). (C) Representative TEM images of JEG-3 cells treated with VEH, GLU, INS and GLU+INS. (D) Representative western blots and associated densitometry for OPA1 in JEG-3 cells treated with DMSO (control), 15 µM genistein (GS15), INS, and GS15+INS. Data are presented as mean±SD. *P<0.05, **p<0.01. DMSO, dimethyl sulfoxide; EMEM, Eagle’s Minimal Essential Media; OPA1, optic atrophy potein 1.
Next, we examined the spatial distribution of OPA1 by IF analysis in JEG-3 cells following the various treatments. Qualitative analysis showed a general perinuclear distribution of mitochondria, as identified by Mitotracker Red staining, in all tested groups. INS treatment resulted in the formation of prominent mitochondrial networks and colocalization of OPA1 to the mitochondria (figure 4A). Quantification of IF images showed increased IF intensity of OPA1 in the INS group relative to VEH and GLU-treated cells, and in GLU+INS-exposed cells compared with the GLU-treated cells (figure 4B), in line with the fusion-promoting effect of INS exposure observed in JEG-3.

Immunofluorescence analysis of OPA1 and pDRP1 in choriocarcinoma JEG-3 cells exposed to glucose and/or insulin. (A) JEG-3 cells treated with glucose (GLU), insulin (INS), glucose plus insulin (GLU+INS) or EMEM vehicle (VEH) were stained for OPA1 (green), Mitotracker (red), and DAPI (blue) and imaged by confocal microscopy (n=4 separate experiments in duplicate). (B) Quantification of immunofluorescence intensity for OPA1. (C) JEG-3 cells treated with GLU, INS, GLU+INS or EMEM vehicle were stained for pDRP1 (green), Mitotracker (red) and DAPI (blue) and imaged by confocal microscopy (n=2 separate experiments in duplicate). (D) Immunofluorescence colocalization analysis (Pearson correlation coefficient) for pDRP1 and Mitotracker. Data are expressed as mean±SD. *P<0.05, **p<0.001, ****p<0.0001. EMEM, Eagle’s Minimal Essential Media; OPA1, optic atrophy potein 1.
IF staining in JEG-3 revealed prevalence of cytoplasmic pDRP1 in INS-treated cells, whereas in GLU-treated cells, a clear association to mitochondria (pDRP1overlap with Mitotracker Red) was observed (figure 4C). Colocalization analysis showed higher Pearson correlation for pDRP1 and mitochondrial stainings in GLU-treated as compared with VEH-exposed, INS-exposed and GLU+INS-exposed cells (figure 4D), suggesting increased translocation of pDRP1 molecules from the cytosol to the mitochondria triggering fission.
In sum, our findings suggest that a hyperinsulinemic placental environment promotes mitochondrial fusion and network formation, while in hyperglycemic conditions, there may be more tendency toward mitochondrial fission.
Genistein reduces insulin-induced OPA1 expression
Insulin effects are mediated by the insulin receptor (IR), a transmembrane glycoprotein highly expressed in the placenta.31 Insulin binding to IR results in receptor autophosphorylation on specific tyrosine residues and consequent tyrosine phosphorylation of IR substrates (IRS1 and IRS2), which allows for the association of IRS to downstream signaling molecules such as phosphatidyl-inositol-3-kinase (PI3K). Genistein is a tyrosine kinase inhibitor that downregulates IRS-1 tyrosine phosphorylation required in PI3K signaling. To confirm the role of insulin signaling in triggering mitochondrial fusion in throphoblast cells, we treated JEG-3 cells with 15 µM of Genistein (GS15) to block the IRS/PI3K pathway. In line with the data shown in figure 3A, exposure of JEG-3 cells to INS resulted in increased OPA1 levels when compared with those treated with vehicle alone (figure 3D). This stimulatory effect was abrogated by the addition of GS15, resulting in decreased OPA1 in JEG-3 treated with INS+GS15 (figure 3D).
Placental ceramide content is diminished in GDM possibly contributing to decreased mitochondrial fission
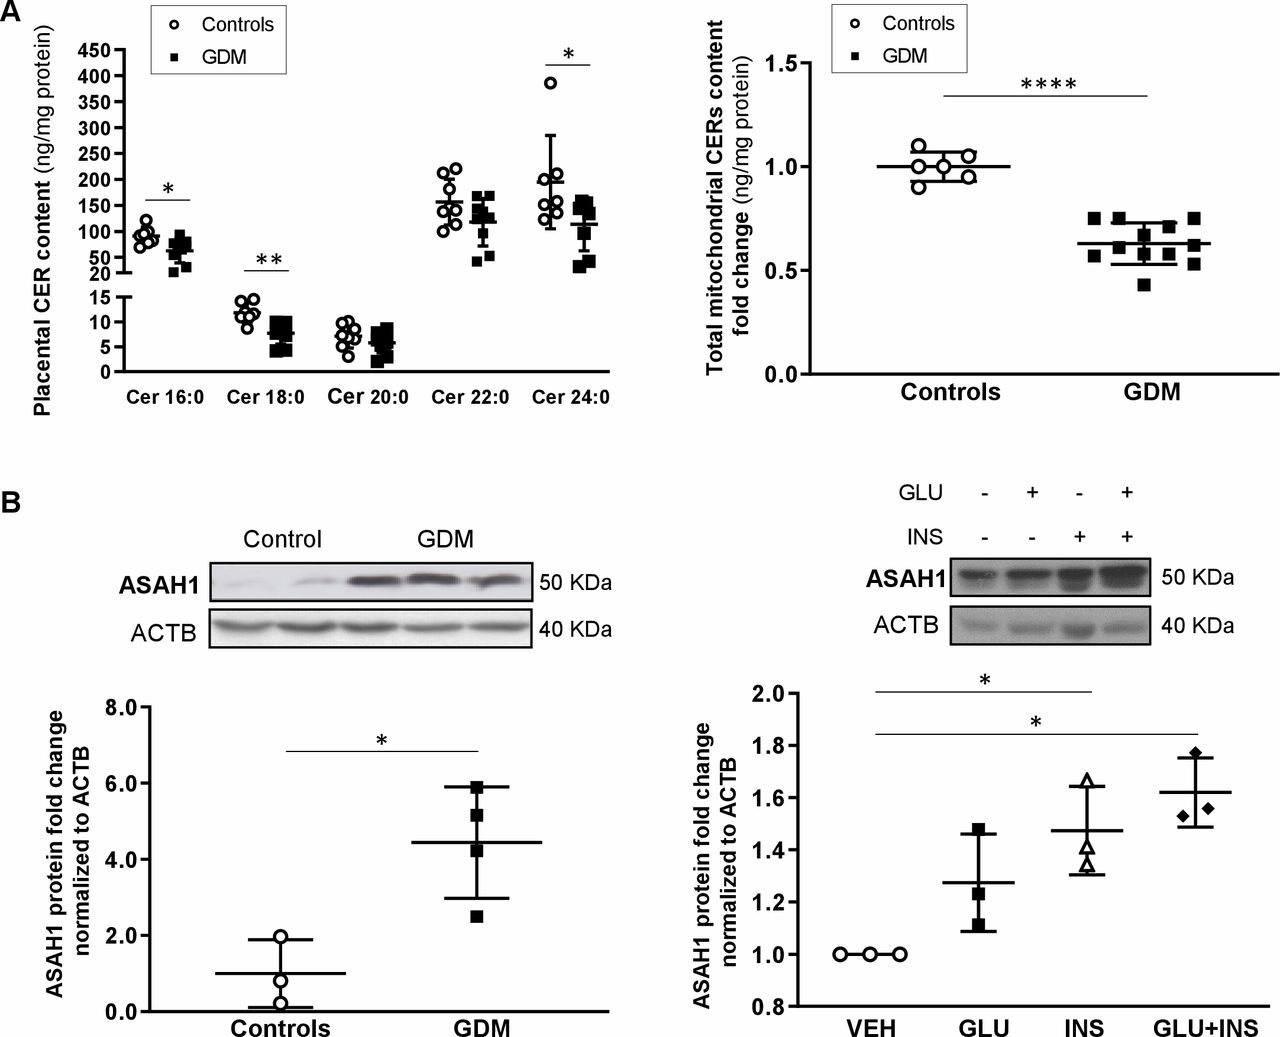
We have previously reported that accumulation of ceramide (CER) in pre-eclamptic placentae contributes to trophoblast cell death17 18 and mitochondrial fission.16 Hence, we examined CER content in placental tissue and MIs from GDM and control pregnancies. LC-MS/MS analysis demonstrated decreased placental CER 16:0, 18:0 and 24:0 levels in GDM versus controls (figure 5A, left panel). Likewise, a decreased total CER content was found in MIs from GDM placentae relative to controls (figure 5A, right panel). In accordance with our lipidomic data, protein levels of ASAH1, a rate-limiting enzyme involved in the degradation of CER into sphingosine and fatty acids,32 were more abundant in GDM compared with control placentae (figure 5B, left panel). To examine the possible contribution of insulin and glucose to ASAH1 upregulation, we treated JEG-3 cells with GLU, INS and GLU+INS and observed increased ASAH1 protein levels in INS and INS+GLU exposed cells as compared with those treated with the DMSO vehicle (figure 5B, right panel).
Analysis of placental ceramide metabolism in gestational diabetes and control pregnancies. (A) Placental ceramide species content (left panel; n=8 control, n=8 GDM) and placental change in mitochondrial ceramide content (right panel; n=6 control, n=12 GDM) in pregnancies complicated by GDM as compared with normal control pregnancies. (B) Representative western blots and associated densitometry for ASAH1 enzyme levels in control versus GDM placentae and in JEG-3 cells (n=3 separate experiments in triplicate) treated with EMEM (VEH), glucose (GLU), insulin (INS), or glucose and insulin (GLU+INS). Data are expressed as median ±IQR. *P<0.05, **p<0.01, ****p<0.0001. CER, ceramide; EMEM, Eagle’s Minimal Essential Media; GDM, gestational diabetes mellitus.
Conclusions
Our study demonstrates that mitochondrial fusion is dominant in placentae from pregnancies complicated by GDM. Using JEG-3 cells, we show that insulin is a potential mediator of this phenomenon. Also, we demonstrate that ceramide, an inducer of mitochondrial fission in the placenta,16 is reduced in GDM placentae. This decrease is accompanied by an upregulation of the ceramide-degrading enzyme ASAH1, which in JEG-3 cells is upregulated by insulin. Collectively, our findings suggest that hyperinsulinemic placental conditions in conjunction with perturbed ceramide metabolism are among plausible factors contributing to increased placental mitochondrial fusion in GDM.
To our knowledge, we are the first to report a systematic, quantitative analysis of placental mitochondrial dynamics in GDM and show that fusion predominates. Among strengths of our study are the fairly robust sample size, diagnosis and follow-up of patients at the same hospital (MSH) according to uniform clinical guidelines and standardized BioBank protocols for the collection of clinical specimen. Weaknesses include deficiency of laboratory evidence of maternal and fetal (cord blood) insulin levels; which could have been correlated with parameters of placental mitochondrial dynamics. Furthermore, we lack detailed clinical information on some control samples; however, these were screened by the BioBank at sample collection as being from an uneventful pregnancy without chronic or acute disease conditions.
Mitochondrial fusion has a central role in cellular bioenergetics. Typically, it is stimulated in conditions of increased oxidative phosphorylation needs and ‘cellular starvation’, to preserve mtDNA levels, mitochondrial membrane potential and respiratory function.8 33 Tissue sensitivity to deficiencies in mitochondrial fusion capacity varies.33 In embryonic and placental development, for instance, mitochondrial fusion is essential as Mfn1 and Mfn 2 knock-out in mice results in fetal death due to placental insufficiency.34 In addition, fusion is one of the first-line mechanisms to repair mitochondrial damage by permitting sharing of content as mtDNA and lipids.8 Hence, our observations of increased mitochondrial fusion in GDM placentae could reflect both increased demand for oxidative phosphorylation and/or need to compensate for mitochondrial damage due to placental cell stress. Enhanced mitochondrial fusion was most conspicuous in the CTB layer, complying with the CTB’s suggested role as the highly metabolically active placental cell type with ability to maintain respiratory capacity despite fluctuations in nutrient availability.25 26 Taking into account that increased placental OPA1 levels were observed also in the D-GDM patients (ie, mostly normal weight women, with no insulin treatment, assumably milder hyperinsulinemia, and newborns displaying the lowest mean birth weight), it cannot be excluded that GDM diet treatment might also influence placental mitochondrial dynamics. Considering our result of lower placental OPA1 levels in obese versus non-obese GDM patients, it is possible that this compensatory capacity is exceeded in maternal obesity, due to factors such as oxidative stress, inflammation, hyperlipidemia and lipotoxicity, which are detrimental to proper mitochondrial function.28
The underlying pathology of GDM is closely linked to type 2 diabetes (T2D) and obesity. This is reflected in the characteristics of our study participants, showing higher BMI in I-GDM patients. T2D and obesity feature mitochondrial dysfunction in metabolically active tissues such as skeletal muscle, liver and adipose tissue.13 In keeping with this, decreased skeletal muscle oxidative phosphorylation35 and reduced mtDNA in peripheral blood36 have been observed also in GDM women. In placental tissue from GDM pregnancies, reduced microRNA (miR)-143 (mediates switch from oxidative phosphorylation to glycolysis) and transcription factors that promote mitochondrial biogenesis (PCG-1α and PPARγ) have been reported, along with increased glycolysis.37–39 Similarly, in pregnancies complicated by pre-existing diabetes, suppressed placental mitochondrial respiratory chain enzyme activity has been shown.40 Interestingly, in obese women without GDM, contrasting findings such as heightened mtDNA content in the placenta28 and peripheral blood,41 suggesting increased mitochondrial biogenesis, have been reported. Collectively, these data point toward reduced placental mitochondrial biogenesis and/or respiratory capacity in diabetic pregnancies. Our finding of decreased placental mitochondrial density in the different cell layers (CTB, STB and endothelial cells) of GDM placentae is consistent with these prior reports.
Although long-standing evidence supports the role for insulin as an important mediator of feto-placental growth, its exact mechanisms of action on placental cell metabolism remain elusive.6 42 Our in vitro results demonstrating upregulation of mitochondrial fusion in trophoblast cells following insulin exposure are consistent with this potential role.43 44 Although IR expression dominates on the STB side in early gestation, IRs have also been identified in the cytoplasm of CTB cells in late first trimester,45 enabling insulin effects on the CTB. At term, however, placental IR density is highest on the fetal endothelium,46 and it has been hypothesized that this temporo-spatial shift in IR density may reflect a shift in control of placental insulin-mediated processes from the mother to the fetus.46 Hence, it is plausible that the maternal metabolic milieu, including derangements of the glucose-insulin axis or obesity-related abnormalities, could impact on placental metabolism and mitochondrial dynamics already in early pregnancy.42–44 Notably, increased throphoblast IR density and placental IRS-1 protein levels have been reported in insulin-treated GDM compared with diet-controlled GDM and healthy controls,47 48 and this could also enhance insulin signaling through the IRS1/PI3K pathway, upregulating mitochondrial fusion.
Pregnancy is associated with a physiological increase in serum insulin levels, and in GDM, plasma insulin concentrations are on average higher than in normal pregnancies.49 Maternal hyperglycemia related to GDM is usually mild, but continuous positive relationships exist between maternal plasma glucose levels and fetal hyperinsulinemia, a central player in the pathogenesis of diabetic perinatal complications.50 Both excess fetal glucose and insulin lead to increased fetal substrate uptake, overgrowth and/or adiposity, and increased oxygen consumption.51 In line with this, increased placental weight, volume and vascularization are often found in diabetes, possibly representing an adaptive mechanism.6 Therefore, it is possible that maternal and/or fetal elevated insulin concentrations and/or other associated metabolic changes stimulate placental mitochondrial fusion to promote placental ‘anabolism’, to meet the high oxidative phosphorylation demands of the placenta and to ensure sufficient substrate transfer to the often hyperinsulinemic fetus.52 Similarly, decreased mitochondrial density in the STB in GDM placentae could be an adaptive mechanism to reduce ‘loss’ of vital mitochondria from the metabolically active CTB to STB. Studies in other metabolically active tissues conform to our placental findings, as increased mitochondrial fusion, mitochondrial potential and O2 consumption have been reported in rat cardiomyocytes53 and increased O2 consumption, ATP production, and mitochondrial protein levels shown in the skeletal muscle of non-diabetic adults54 after insulin exposure.
High-glucose conditions are typically associated with increased mitochondrial ROS production, oxidative cell damage and increased mitochondrial fission in metabolically active tissues.13 14 However, in contrast, in placental tissue from GDM women, we found decreased pDRP1 levels. One contributing factor could be the appropriate glycemic control of our GDM patients, as suggested by the available HbA1c levels and the favorable obstetric and perinatal outcomes, including lack of fetal macrosomia. In line with this, the observed changes in mitochondrial dynamics might have appeared before the establishment of glycemic control and/or be due to factors other than hyperglycemia, for example, hyperinsulinemia. In light of our findings in GLU-exposed JEG-3 cells, it is tempting to speculate that in untreated GDM or in pre-existing diabetes, more severe hyperglycemia could also trigger placental mitochondrial fission.
Outside pregnancy, mounting evidence supports the lipotoxic role of intracellular ceramide accumulation in obesity-related morbidity, from insulin resistance to atherosclerosis.32 Interestingly, plasma levels of CER 16:0, 18:0 and 24:0—the species we found to be diminished in GDM placentae—have been reported to be enriched in the plasma of non-pregnant patients with type 2 diabetes and to associate with insulin resistance.55 In keeping with this, rodent models of obesity have revealed that genetic or pharmacological inhibition of CER biosynthesis improves insulin sensitivity, mitochondrial activity and oxygen consumption.32 56 Considering that inflammation, oxidative stress and dyslipidemia are well-established triggers of CER accumulation in other metabolically active tissues, our finding of decreased CER content in GDM placentae is intriguing. Interestingly, our previous observations in intrauterine growth restriction (IUGR) placentae are similar to those seen in GDM, demonstrating heightened ASAH1 expression and decreased CER 18:0, 20:0 and 24:0 levels.57 A common denominator for these conditions could be disturbed feto-placental energy homeostasis requiring increased mitochondrial respiration. As maintenance of low intracellular CER could facilitate anabolism in the feto-placental unit, upregulation of ASAH1 could be a protective mechanism against the harmful effects of GDM on placental metabolism. In contrast, in pre-eclampsia, we have demonstrated that placental CER accumulation leads to enhanced mitochondrial fission and cell death,16 17 and CER 16:0 exposure of primary CTB and JEG-3 cells increases DRP1 expression, phosphorylation and recruitment to the mitochondria.16 Collectively, these observations suggest that placental sphingolipid metabolism differs between pregnancy pathologies and that CER could be a potential regulator of placental mitochondrial dynamics. To our knowledge, we are the first to identify insulin as a mediator of ASAH1 protein expression. However, a recent study examining the effects of insulin exposure on first-trimester trophoblast transcriptome suggested insulin as a regulator of placental lipid metabolism.44 Clearly, future studies aimed at examining the precise mechanism(s) responsible for ASAH1 regulation by insulin are warranted.
In conclusion, our data imply that GDM with or without maternal obesity has profound impacts on placental mitochondria dynamics and metabolism, even in pregnancies not characterized by typical adverse outcomes such as fetal macrosomia. Variations in placental metabolic flexibility to adapt to maternal and/or fetal disturbed metabolism could be a factor accounting for the heterogeneity and unpredictability of adverse offspring outcomes (eg, macrosomia and fetal chronic hypoxia) in diabetes.
Acknowledgments
We would like to thank the Research Centre for Women’s and Infant’s Health BioBank, the Lunenfeld-Tanenbaum Research Institute, and the Mount Sinai Hospital (MSH)/UHN Department of Obstetrics and Gynaecology for the human specimens and clinical data used in this study (http://biobank.lunenfeld.ca) and Dr Denice Feig for providing information on gestational diabetes mellitus (GDM) diagnostic and management policies at MSH.
References
Footnotes
JA and MMK contributed equally.
Contributors JA carried out the cytotrophoblast transmission electron microscopy (TEM) analyses, western blot (WB) and half of immunofluorescence (IF) experiments. MMK performed half of IF experiments and participated in WBs together with AT and AF and analyzed clinical data. MMK, AF and JS carried out STB and endothelium TEM analyses. LE performed the studies on mitochondrial isolates and prepared samples for lipidomic analyses. TG prepared figure 1. MMK and IC wrote the manuscript, and all authors contributed toward data interpretation and critically revising the paper and accepted the final version. MMK and IC are the guarantors of this work and, as such, had full access to all the data in the study and take responsibility for the integrity of the data and the accuracy of the data analysis.
Funding This work was supported by the Canadian Institutes for Health Research (MOP-133436 to IC), National Institutes of Health (1R01HD089660 to IC), Finnish Cultural Foundation (MMK) and Biomedicum Helsinki Research Foundation (MMK).
Competing interests None declared.
Patient consent for publication Not required.
Ethics approval The study protocol was approved by the MSH Research Ethics Board (REB number: 11–0287-E) and carried out in agreement with the Declaration of Helsinki.
Provenance and peer review Not commissioned; externally peer reviewed.
Data availability statement Data are available on reasonable request. The deidentified data generated and/or analyzed in this study are available from the corresponding author (caniggia@lunenfeld.ca) on reasonable request.