Article Text

Abstract
Objective The mechanisms underlying the association between diabetes and inner ear dysfunction are not known yet. The aim of the present study is to evaluate the impact of obesity/insulin resistance on inner ear fluid homeostasis in vivo, and to investigate whether the organ of Corti could be a target tissue for insulin signaling using auditory House Ear Institute-Organ of Corti 1 (HEI-OC1) cells as an in vitro model.
Methods High fat diet (HFD) fed C57BL/6J mice were used as a model to study the impact of insulin resistance on the inner ear. In one study, 12 C57BL/6J mice were fed either control diet or HFD and the size of the inner ear endolymphatic fluid compartment (EFC) was measured after 30 days using MRI and gadolinium contrast as a read-out. In another study, the size of the inner ear EFC was evaluated in eight C57BL/6J mice both before and after HFD feeding, with the same techniques. HEI-OC1 auditory cells were used as a model to investigate insulin signaling in organ of Corti cells.
Results HFD feeding induced an expansion of the EFC in C57BL/6J mice, a hallmark of inner ear dysfunction. Insulin also induced phosphorylation of protein kinase B (PKB/Akt) at Ser473, in a PI3-kinase-dependent manner. The phosphorylation of PKB was inhibited by isoproterenol and IBMX, a general phosphodiesterase (PDE) inhibitor. PDE1B, PDE4D and the insulin-sensitive PDE3B were found expressed and catalytically active in HEI-OC1 cells. Insulin decreased and AICAR, an activator of AMP-activated protein kinase, increased the phosphorylation at the inhibitory Ser79 of acetyl-CoA carboxylase, the rate-limiting enzyme in de novo lipogenesis. Furthermore, the activity of hormone-sensitive lipase, the rate-limiting enzyme in lipolysis, was detected in HEI-OC1 cells.
Conclusions The organ of Corti could be a target tissue for insulin action, and inner ear insulin resistance might contribute to the association between diabetes and inner ear dysfunction.
- complication(s)
- ears
- effects of insulin
- insulin resistance
This is an open access article distributed in accordance with the Creative Commons Attribution Non Commercial (CC BY-NC 4.0) license, which permits others to distribute, remix, adapt, build upon this work non-commercially, and license their derivative works on different terms, provided the original work is properly cited, appropriate credit is given, any changes made indicated, and the use is non-commercial. See: http://creativecommons.org/licenses/by-nc/4.0/.
Statistics from Altmetric.com
Significance of this study
What is already known about this subject?
As has been summarised in reviews and meta-analysis studies, there is an association between diabetes and inner ear dysfunction; the mechanisms lying beneath this association, however, are not known.
We have previously shown that cells from the human inner ear sensory epithelium express the insulin receptor as well as insulin signaling components.
Now we wonder: Does insulin direct action, or defects in insulin-triggered signaling, contribute to hearing dysfunction in diabetes?
What are the new findings?
Insulin impacts on inner ear functions by mechanisms classically associated with insulin signaling in target cells.
Inner ear insulin resistance might contribute to diabetes-associated inner ear dysfunction.
How might these results change the focus of research or clinical practice?
Pure tone audiometry, auditory brain stem response and distortion products otoacustic emissions, conventional testing methods for early diagnosis of hearing loss, could be used in the following up of patients with diabetes to prevent further disease progression of inner ear functions.
Introduction
Ample evidence shows that type 1 and type 2 diabetes negatively impact on the function of the vestibular and auditory systems both in humans and in animal models.1–5 Although several theories have been proposed (eg, microangiopathy, advanced glycation end products, reactive oxidative stress and mitochondrial dysfunction, demyelination of the auditory nerve, spiral ganglion loss and atrophic changes of organ of Corti cells5–9), the exact underlying mechanisms responsible for diabetes-induced damage to the auditory system remain uncertain.
The progression of hearing loss in mice with type 1 diabetes induced with streptozotocin or type 2 diabetes induced with high fat die (HFD), respectively, has been reported to have different characteristics as measured by auditory brain stem response and distortion products otoacustic emissions (DPOAE).10 Furthermore, hyperinsulinemia, a marker for insulin resistance and type 2 diabetes, has been suggested to explain differences in dysfunction of specific auditory pathways in the two types of diabetes in a comprehensive neuro-electrophysiological study in mice.11 In humans, insulin resistance, impaired fasting glucose and beta-cell dysfunction have been reported as independent risk factors for hearing impairment even before the onset of type 2 diabetes.12 Thus, a number of studies are in agreement with reports showing harmful effects of induced hyperinsulinemia on inner ear metabolic and ion homeostasis.13–16
The role of the cochlea as a direct target organ for insulin action has not been well characterized. Recently, it was reported that the insulin receptor is expressed specifically in supporting cells of the organ of Corti17 in agreement with early studies showing high affinity binding sites for insulin in the cochlea.18 Also, previous results from our laboratory demonstrated the expression of the insulin receptor, insulin receptor substrate 1, protein kinase B (PKB/Akt), the insulin-sensitive phosphodiesterase (PDE) 3B as well as targets such as the insulin-regulated glucose transporter 4, in the sensory epithelium of the human saccule.19 20
The C57BL/6 mouse strain fed HFD is a commonly used animal model for studies of the pathophysiology of insulin resistance, impaired glucose homeostasis and early type 2 diabetes.21 In the present study, we investigated the impact of insulin resistance on the size of the cochlear endolymphatic fluid compartment (EFC) in vivo in HFD-fed C57BL/6J mice using MRI with contrast. Endolymphatic hydrops (EH), an expansion of the EFC, was looked on as a marker for risk to develop cochlear dysfunction. We have previously used MRI and gadolinium contrast to demonstrate that EH develops in response to treatment with vasopressin and family selective PDE inhibitors, cilostamide, rolipram and sildenafil, respectively20 22 and furthermore shown that hydrops can be prevented by spironolactone administration under specific conditions.23
To study insulin signaling in vitro, House Ear Institute-Organ of Corti 1 (HEI-OC1) auditory cells, one of the few auditory cell lines available for research purposes, were used.24 HEI-OC1 cells are considered a model for organ of Corti cells since they express markers for both hair cells and supporting cells.
Methods
Animals and high fat diet interventions
A total of 20 female, 8 weeks of age, C57BL/6J mice (Taconic, Denmark) were on a 12 hours light cycle with non-restricted food and water intake.
Study 1: six C57BL/6J mice were fed HFD (D12492, 60 E% fat content; Research Diets, New Brunswick, New Jersey, USA) and six mice were fed control diet (CD) for 30 days. Thereafter, the areas of the EFCs were evaluated using MRI with gadolinium contrast as described in Magnetic resonance imaging.
Study 2: eight C57BL/6J mice were fed HFD for 30 days. The areas of the EFC were evaluated twice for each mouse, both before and after 30 days of HFD, using MRI with gadolinium contrast.
Magnetic resonance imaging
Animals were anesthetized with 3.5% isoflurane in a mixture with 200 mL/min oxygen and 200 mL/min nitrous oxide and maintained at 1.5%–2% isoflurane inside the magnet. Gadolinium contrast agent (Dotarem, Guerbet, Villepinte, France) (gadoteric acid, 279.3 mg/mL, 0.5 mmol/mL) was administered intraperitoneally (100 μg/20 g) in the left abdominal quadrant 55–65 min before MRI. The induction chamber was kept warm at 37°C. Inside the magnet, the respiratory rate of the animal was monitored (SA Instruments, New York, USA) and the body temperature was maintained using a Lauda Rc6 CS recirculating water bath (Köningshofen, Germany).
MRI was performed as previously described20 22 23 with a 9.4 T magnet (Agilent, Palo Alto, USA) using Avance III electronics (Bruker, Ettlingen, Germany). The system is equipped with a 12 cm inner diameter gradient system having a maximum gradient strength of 670 mT/m. The animals were imaged using a quadrature transmit/receive cryoprobe (Bruker). T1-weighted three-dimensional (3D) images were acquired with a gradient echo 3D sequence; repetition time TR: 11 ms, echo time TE: 3.695 ms, number of averages: 2, data matrix size 220×220×147 pixels, field of view 15×15×10 mm3. Images were reconstructed by zero filling to increase the apparent resolution of the image to a matrix size of 440×440×294 pixels and an apparent pixel resolution of 0.034 mm.
Quantitative assessment of gadolinium in the endolymphatic relative to the perilymphatic space
Synedra view personal 16 (Synedra, Innsbruck, Austria), as well as Adobe Photoshop CS5 (Adobe, San Jose, USA), were used for postproduction processing of images, for the quantification of signal intensity in regions of interest and for labeling and demonstration of perilymph in the scala tympani (ST) and scala vestibule (SV) and endolymph in the scala media (SM). Images parallel to the modiolus of mouse cochleae were used for measurements.20 22 23 To evaluate the effect of various treatments on the size of the EFC, the relative area of SM in the basal turn of the cochlea was estimated by calculating the ratio between SM (endolymph, non-contrast enhanced) and SM plus SV (perilymph, contrast enhanced). The ratio of areas was subsequently converted to percentage as shown in figures 1 and 2. The observer assessing and outlining the perilymphatic and endolymphatic sizes, was blinded to the treatments given.
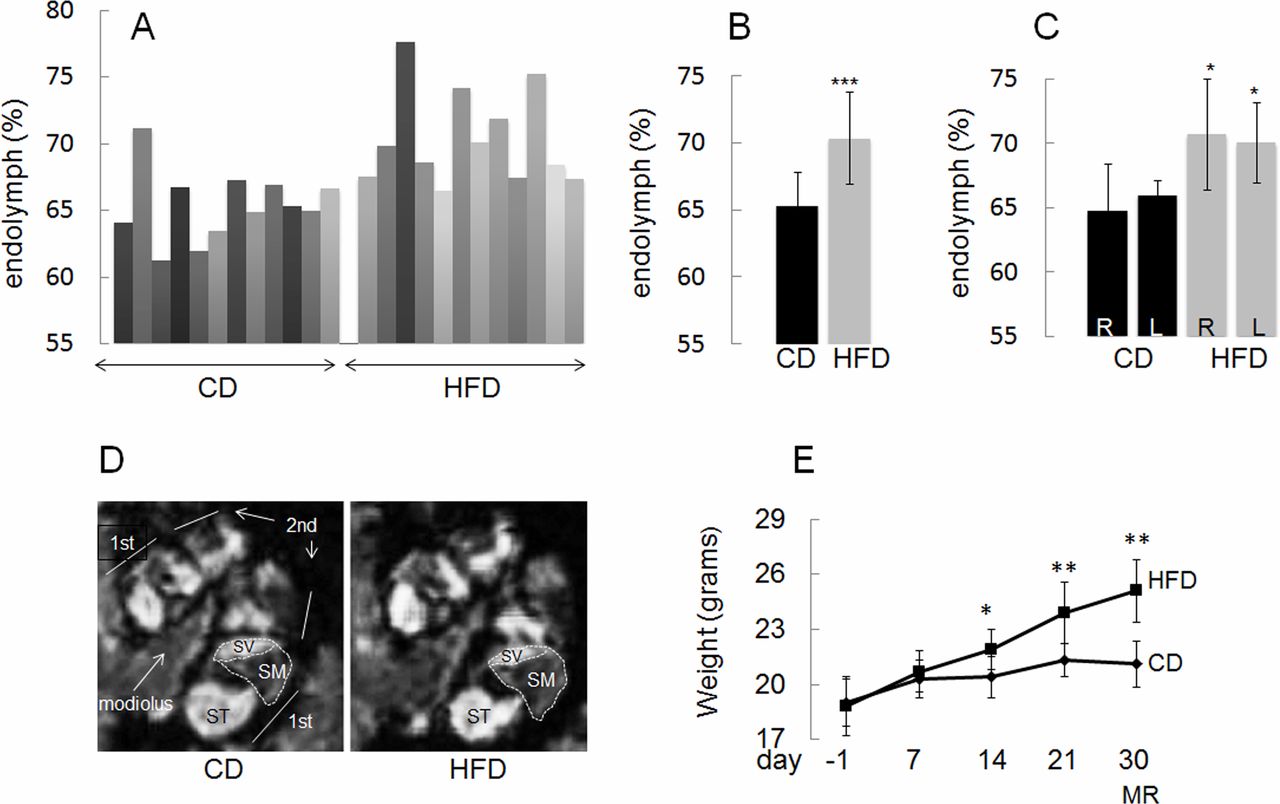
High fat diet (HFD) feeding induces expansion of the endolymphatic fluid compartment in C57BL/6J mice as compared with mice fed control diet (CD). (A) Relative areas of endolymphatic compartments in individual ears. (B) Ears in the CD and HFD groups (mean±SEM: 65.3±2.5 and 70.4±3.4, respectively; p=0.00088). (C) Right and left ears in CD and HFD groups (mean±SEM: 64.7±3.7 and 70.7±4.3; p=0.028 for right ears and 66.0±1.1 and 70.0±3.1; p=0.011 for left ears). R, right; L, left. (D) Example of images parallel to the modiolus of cochlea of mice fed HFD or CD analyzed by MRI is shown. The gadolinium contrast moves into the perilymph (SV and ST), but not into the endolymph (SM), therefore the perilymph looks white and the endolymph looks black. Note the significant decrease in SV relative area after HFD feeding. The relative area of SM in the basal turn of the cochlea was estimated as described in ‘Methods’ section. The ratio of areas was subsequently converted to percentage as shown in A–C. SV, scala vestibule; ST, scala tympani; SM, scala media; 1st, first turn; 2nd, second turn. (E) Time course in changes in body weight from baseline at 8 weeks of age and during 30 days on CD (six mice) and HFD (six mice). MRI was performed at day indicated. Data are presented as means±SD. *P<0.05, **p<0.01,***p<0.001, HFD vs CD.

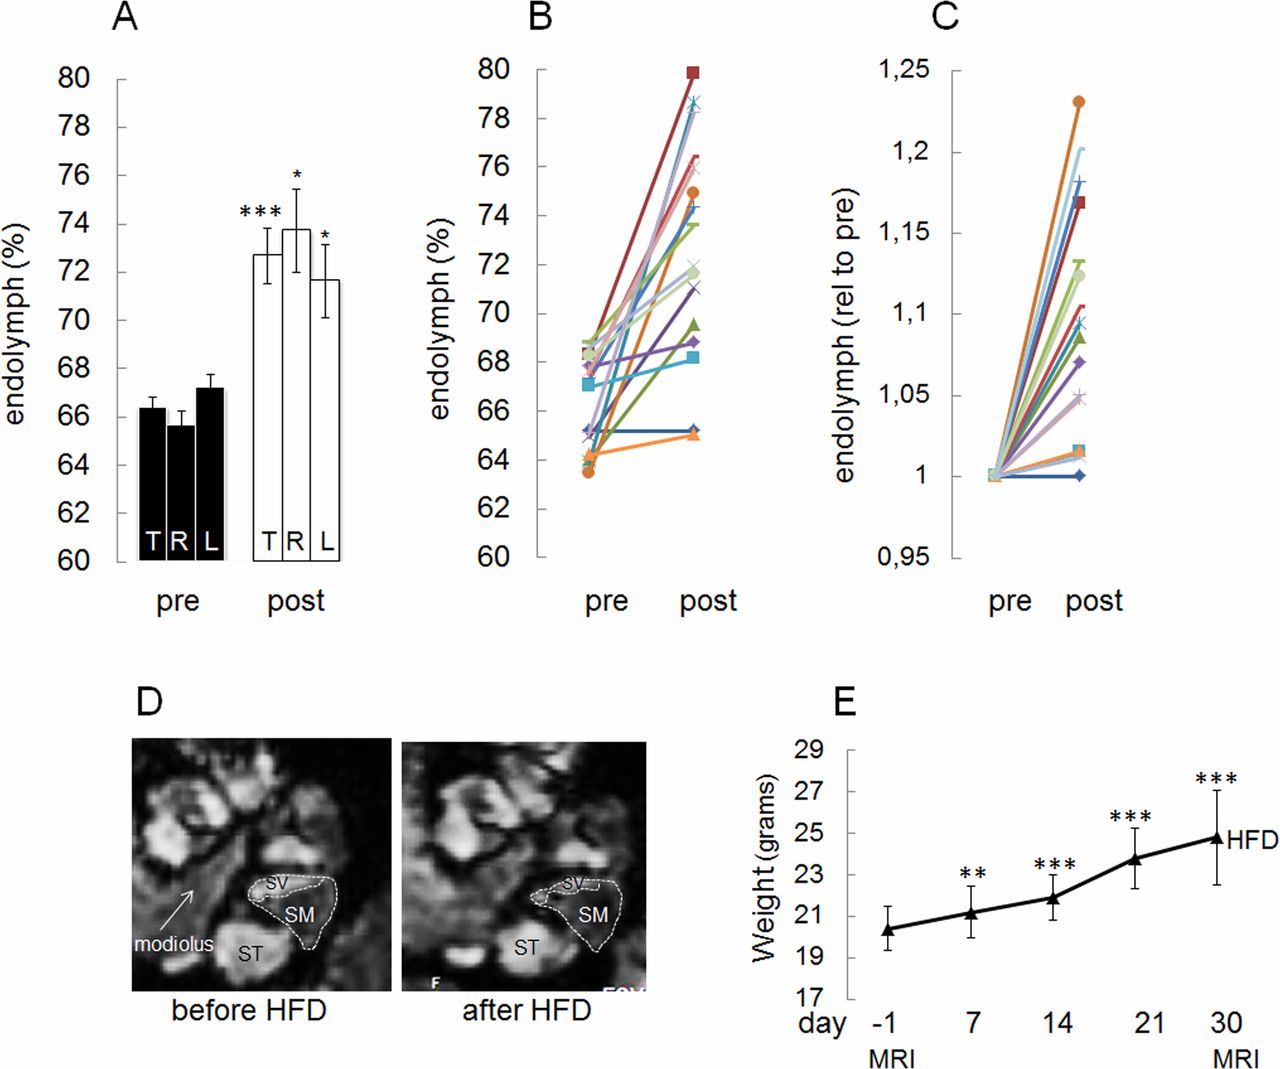
High fat diet (HFD) feeding induces expansion of the endolymphatic fluid compartment in C57BL/6J mice when comparing the same ear before and after feeding. (A–C) Data are presented as: (A) means±SEM corresponding to all animals in the study shown for all ears (T), right ears (R) and left ears (L) (mean±SEM: before HFD (pre), 66.4±0.50 (T), 65.6±0.7 (R), 67.2±0.6 (L) and after HFD (post), 72.7±1.1 (T), 73.7±1.7 (R), 71.6±1.5 (L), respectively; p=0.000073 (T), 0.015 (R), 0.021 (L), (B) as individual values before and after HFD and (C) as individual values for each ear with prevalues set to 1. (D) Example of images parallel to the modiolus of cochlea analyzed by MRI both before and after HFD feeding is shown. The gadolinium contrast moves into the perilymph (SV and ST), but not into the endolymph (SM), therefore the perilymph looks white and the endolymph looks black. Note the significant decrease in SV relative area after HFD feeding. The relative area of SM in the basal turn of the cochlea was estimated as described in ‘Methods’ section. The ratio of areas was subsequently converted to percentage as shown in A–C. SV, scala vestibule; ST, scala tympani; SM, scala media. (E) Time course in changes in body weight from baseline at 8 weeks of age and during 30 days on HFD (eight mice). MRI was performed at days indicated. Data are presented as means±SD. *P<0.05, **p<0.01,***p<0.001 vs day −1.
HEI-OC1 auditory cells and culture
HEI-OC1 cells were cultured in 6-well plates (6-well TC (tissue culture) plate standard, Sarstedt, Numbrecht, Germany) under permissive conditions (33°C, 10% CO2) in high-glucose Dulbecco’s Modified Eagle Medium (Sigma) containing 10% fetal bovine serum (Sigma) without antibiotics.24 After reaching 70%–80% confluence cells were washed twice with phosphate-buffered saline and preincubated for 2 hours in Krebs-Ringer bicarbonate buffer containing 2 mM glucose, 10 mM HEPES, pH 7.4, 120 mM NaCl, 5 mM NaHCO3, 5 mM KCl, 1.2 mM KH2PO4, 2.5 mM CaCl2, 1.2 mM MgSO4 and 0.2% bovine serum albumin (BSA). Thereafter, fresh buffer was added and cells were treated as indicated in the ‘Results’ section. After treatments, the cells were harvested in a buffer containing 50 mM TES (N-[Tris(hydroxymethyl)methyl]-2-aminoethanesulfonic acid), pH 7.4, 250 mM sucrose, 1 mM EDTA, 2 mM ethylene glycol tetraacetic acid (EGTA), 40 mM phenyl-phosphate, 5 mM sodium fluoride, 1 mM dithiothreitol (DTT), 50 µM sodium vanadate, Pefabloc (Sigma), Complete (Roche, protease inhibitors) and 1% NP40 (200 μL/well) and subjected to sonication (10 short pulses). The lysates were centrifuged for 5 min at 5000×g, 4°C and the supernatants were used for further analysis.
SDS-PAGE and western blot analysis
HEI-OC1 cell lysates (20–30 µg protein as measured by Bradford) were mixed with LDS (Lauryl Dodecyl Sulphate) sample buffer 4X (Invitrogen) containing 300 mM DTT and subjected to electrophoresis on 4%–12% bisacrylamide gels (Novex, Invitrogen). Proteins were transferred to Immobilon-P, PVDF (Polyvinylidene Fluoride) membranes (Merck Millipore), blocked with 10% milk in Tris-buffered saline tween-20 (50 mM Tris, pH 7.6, 150 mM NaCl and 0.1% Tween-20) for 30 min and incubated at 4°C overnight with primary antibodies as indicated. Membranes were incubated with secondary antibody conjugated with horseradish peroxidase (HRP) for 1 hour at room temperature, incubated with SuperSignal West Pico ECL (enzymatic chemiluminescence) reagent (Thermo Scientific, Rockford, USA) for 10 min followed by imaging (Molecular Imager ChemiDoc XRS+, Bio-Rad Laboratories, Solna, Sweden) and quantification (Image lab software, V.3.0, Bio-Rad Laboratories).
Total internal reflection fluorescence imaging
HEI-OC1 cells were cultured on glass-bottom dishes (MatTek) and preincubated as described for 2 hours in Krebs-Ringer bicarbonate buffer containing 2 mM glucose, 10 mM HEPES, pH 7.4, 120 mM NaCl, 5 mM NaHCO3, 5 mM KCl, 1.2 mM KH2PO4, 2.5 mM CaCl2, 1.2 mM MgSO4 and 0.2% BSA at 33°C. The cells were stimulated without or with 10 nM insulin for 7 min. Subsequently, the cells were fixed using 4% paraformaldehyde and incubated with antibodies as indicated (1 hour per primary antibody and 1 hour per secondary antibody) in a buffer containing 1% BSA, 1% goat serum and 0.05% saponin. To visualize actin the cells were incubated with phalloidin (Invitrogen) for 1–2 hours.
For total internal reflection fluorescence (TIRF) imaging we used a commercial TIRF system based on a Nikon Ti-E eclipse microscope equipped with a 100×Apo TIRF DIC oil immersion objective with a NA of 1.49 (Nikon Instruments), an iXon Ultra DU-897 EMCCD camera (Andor Technology) and four main laser lines: 405 (Cube, Coherent), 488 (Melles-Griot), 561 (Sapphire, Coherent) and 640 (Cube, Coherent) with corresponding filter sets.
Antibodies
The following primary antibodies were used for western blot analysis/TIRF microscopy as indicated: pACC Ser79 #3661, ACC #3662, pPKBSer473 #9271, PKB #9272, pAMPK Thr172 #2535, anti-AMPK #2603 (all from Cell Signalling), PDE1B and PDE4D antibodies were from Scottish Biomedical, the PDE3B antibody was made in house, Hsp 90 (610418, BD Biosciences), GAPDH (Sigma-Aldrich, St Louis, Missouri, USA), fatty acid synthase (FAS) (sc20140) were from Santa Cruz. Antirabbit and antimouse secondary antibodies conjugated to HRP were from Thermo Fisher Scientific (Rockford, Illinois, USA) and GE Healthcare (Little Chalfont, UK), respectively.
Immunoprecipitation and in vitro assay of AMP-activated kinase activity
Lysates containing 5 µg of protein were incubated at 4°C for 1–2 hours on a shaking platform with 2 µg AMPKα1 antibody generated in house by immunizing rabbits with a peptide encompassing residues 344–358 of rat AMPKα1 (TSPPDSFLDDHHLTR) (Innovagen, Lund, Sweden), conjugated to 5 µL packed protein G-Sepharose (GE Healthcare Biosciences, Uppsala, Sweden). AMP-activated kinase (AMPK) assay was performed exactly as previously described using AMARA peptide (AMARAASAAALARRR) (GL Biocem, Shanghai) as substrate (for 20 min at 30°C).25 Incorporation of 32P-phosphate was expressed as pmol ATP incorporated/mg protein/min (mU/mg).
Measurement of PDE activity
HEI-OC1 cells were harvested in PDE buffer containing 50 mM TES, pH 7.4, 250 mM sucrose, 1 mM EDTA, 1 mM DTT and Complete (Roche, protease inhibitors) (200 µL/well) and subjected to sonication (2×10 pulses). Homogenates were centrifuged for 5 min at 5000×g. PDE1 and PDE4 activities were measured in the supernatants. PDE3 activity was measured in a membrane fraction. The 5000×g supernatant was centrifuged at 100 000×g for 60 min at 4°C and membranes were suspended in PDE buffer (500 µL/plate). The following PDE inhibitors were used at final concentrations: 10 µM of the PDE3 inhibitor OPC3911 (Osaka, Japan), 10 µM of the PDE4 inhibitor RO-20 (Roche) and 50 µM of the PDE1 inhibitor 8MM-IBMX (Enzo Life Science, Farmingdale, New York, USA). The non-selective PDE inhibitor IBMX was used at 100 µM final concentration. Assays were performed at 30°C in a total volume of 300 µL of buffer containing 50 mM TES pH 7.4, 250 mM sucrose, 1 mM EDTA, 0.1 mM EGTA and 8.3 mM MgCl2, 0.5 µM cAMP, 0.5 µg ovalbumin and 1 µCi/mL 3H cAMP (55 000–65 000 cpm).26
Measurement of hormone-sensitive lipase activity
HEI-OC1 cells and mouse adipose tissue were homogenized in 0.25 M sucrose, 1 mM EDTA, 1 mM DTE and protease inhibitors (20 μg/mL leupeptin, 2 μg/mL antipain, 1 μg/mL pepstatin), pH 7.0, using a glass-glass homogenizer. To remove fat from the adipose tissue homogenate, it was centrifuged at 110 000×g for 1 hour at 4°C and the fat-free infranatant was used for hormone-sensitive lipase (HSL) activity measurements. As a positive control in the HSL activity measurements, recombinant rat HSL was used. Measurement of HSL activity was performed using 1 (3)-oleoyl-2–0-oleylglycerol, a diacylglycerol analogue, as substrate, as described in detail by Osterlund and Holm.27 To estimate the fraction of activity accounted for by HSL, samples were pre-incubated with either an activity-neutralizing hen antirat HSL serum (prepared in-house) or pre-immune serum for 15 min at 37°C prior to the assay. Total protein content of the samples was measured using the Bradford method and activity was expressed as mU/mg protein, where 1 U corresponds to the release of 1 μmol of fatty acids per min at 37°C.
Statistical analysis
Results are expressed as mean±SEM. Differences between groups were tested for statistical significance using paired or non-paired Student’s t-test. P values <0.05 were considered to denote statistical significance.
Results
Impact of insulin resistance on mouse inner ear
As shown in figure 1A–D, mice fed HFD showed significantly larger EFCs compared with mice fed CD. HFD-induced hydrops developed in the right as well as in the left ears (figure 1C). The body weight of mice fed HFD was significantly higher after 14, 21 and 30 days, respectively, compared with the body weight of mice fed CD (figure 1E).
We also performed a longitudinal study of the effect of HFD on the size of the EFC in C57BL/6J mice, both before and after 30 days of HFD feeding. As shown in figure 2A,D, HFD significantly induced an expansion of the EFC. HFD-induced hydrops developed in the right as well as in the left ears (figure 2A). In figure 2B, prevalues and postvalues are shown for each ear and in figure 2C, the pretreatment value was set to 1 for each ear. After the initiation of HFD feeding, significant weight gain was obtained after 7, 14, 21 and 30 days (figure 2E).
Thus, in agreement with the known association between diabetes and inner ear dysfunction, mice with HFD-induced insulin resistance develop EH.
The organ of Corti was recently shown to express the insulin receptor.17 To investigate whether the cochlea could be a direct target for insulin signaling, we used HEI-OC1 auditory cells as a model for organ of Corti cells.
Insulin induces phosphorylation of PKB in HEI-OC1 cells
Insulin induced a dose-dependent and time-dependent phosphorylation of PKB at the activity-controlling site Ser473 (figure 3A,B) in the plasma membrane in HEI-OC1 auditory cells (figure 3C). Cells were co-stained with actin to confirm that image analysis was done close to the plasma membrane (figure 3C, upper panel).
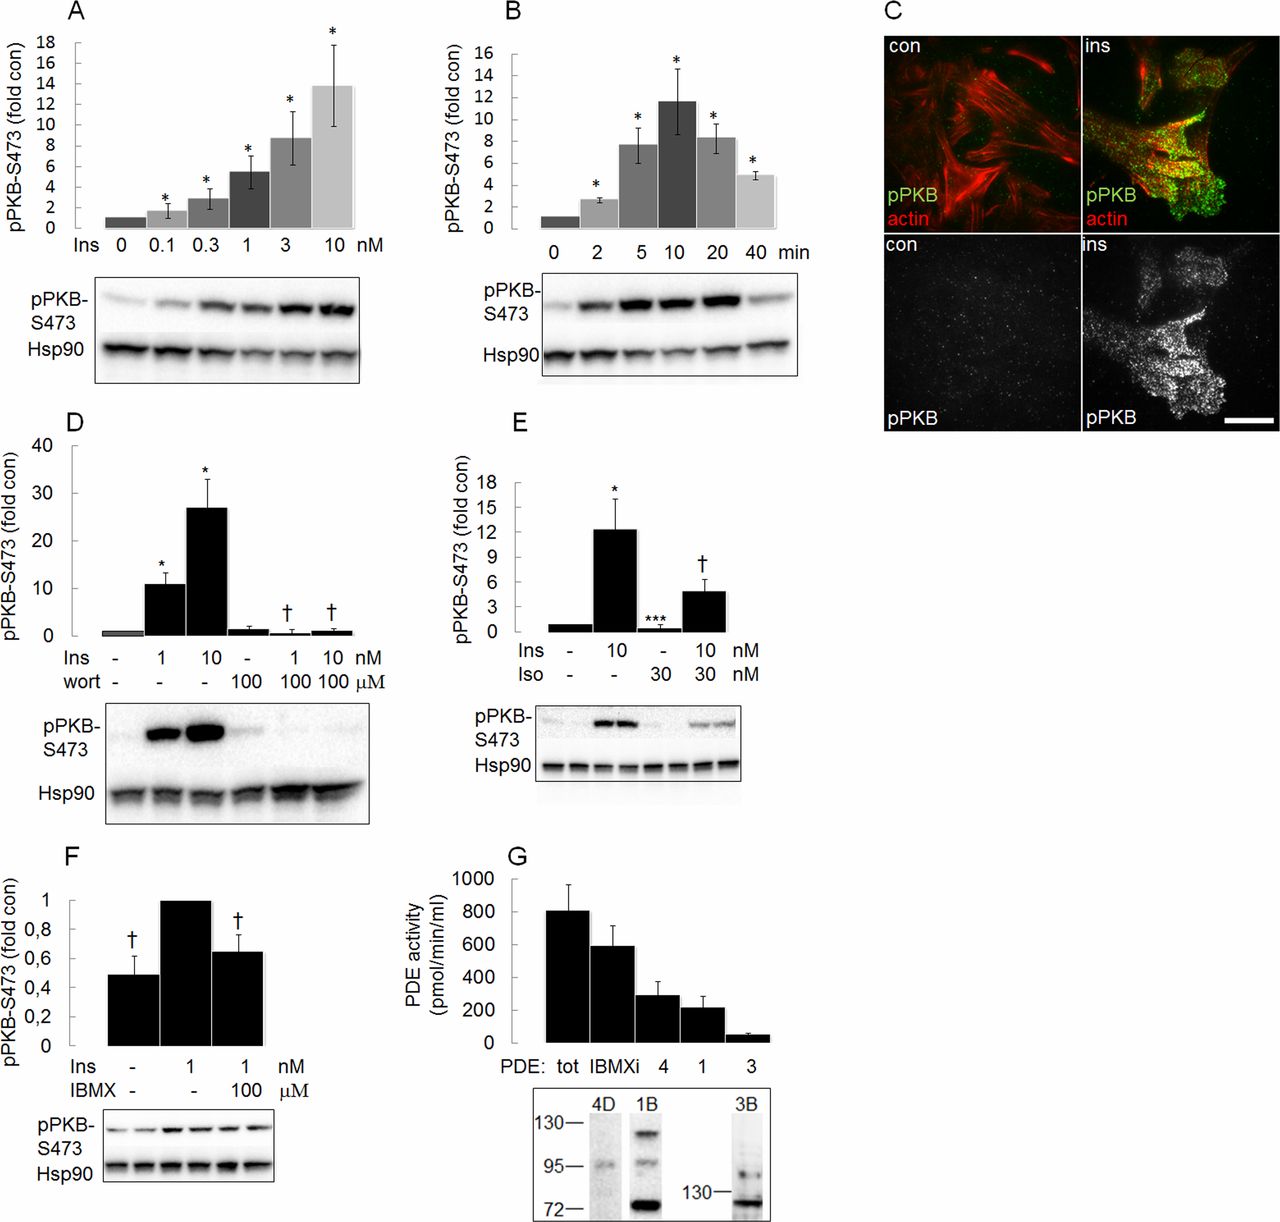
Insulin (ins) induces phosphorylation of protein kinase B (PKB) in the plasma membrane of House Ear Institute-Organ of Corti 1 (HEI-OC1) auditory cells. (A) HEI-OC1 cells were stimulated with different concentrations of ins for 10 min (n=4–6) and (B) with 1 nM ins for 0–40 min (n=3–6). Phosphorylation of PKB was analyzed by western blot analysis using PKB Ser473 antibody. (C) Total internal reflection fluorescence (TIRF) imaging was performed on HEI-OC1 cells stimulated without or with 10 nM ins for 7 min prior to fixation and cells co-stained with PKB Ser473 antibody and actin antibody (upper panel) or with PKB Ser473 antibody (lower panel). A representative image from three experiments is shown. Scale bar=20 μm. (D) HEI-OC1 cells were stimulated without or with ins (1 and 10 nM) for 30 min without or with 100 μM wortmannin (wort) (added 30 min before ins) (n=3), (E) 10 nM ins with or without 30 nM isoproterenol (iso) (n=4) or (F) 1 nM ins with or without 100 μM IBMX (n=6). Phosphorylation of PKB was analysed by western blot analysis using PKB Ser473 antibody (samples are shown in duplicate for E and F). (G) Total cell lysates or membrane fractions (for measurement of phosphodiesterase (PDE)3 activity) were assayed for PDE1 (inhibited by 8 MM IBMX) (n=5), PDE4 (inhibited by rolipram) (n=5) and PDE3 (inhibited by cilostamide) (n=4) and also for PDE activity inhibited by IBMX (IBMX inhibitable (i) PDE) (n=5), as indicated. Western blot analysis using PDE4D, PDE1B and PDE3B antibodies are shown (lower panel). Blots are representative of three to six independent experiments. pPKB western blot analysis signals were normalized to untreated control samples not stimulated by ins (A, B, D, E) or to samples stimulated with ins only (F). Data are presented as means±SEM. *P<0.05, ***p<0.001 vs control (A, B, D, E), †p<0.05 vs ins only (D, E, F). Hsp90, heat shock protein 90.
Insulin-induced phosphorylation of PKB was blocked by wortmannin, a PI3-kinase inhibitor, isoproterenol, a β-adrenergic receptor agonist and by IBMX, a general PDE inhibitor (figure 3D–F). Rolipram (PDE4 inhibitor), 8 MM IBMX (PDE1 inhibitor) or cilostamide (PDE3 inhibitor) did not significantly antagonize the insulin-induced effect (data not shown), although the respective PDE subtype was expressed (figure 3G lower panel) and catalytically active (figure 3G upper panel) in HEI-OC1 cells.
Insulin decreases and AICAR increases phosphorylation of acetyl-CoA carboxylase in HEI-OC1 cells
Insulin lowered the phosphorylation of acetyl-CoA carboxylase (ACC) at Ser79, an inhibitory phosphorylation site (figure 4A). AICAR, an AMPK activator, in turn increased ACC Ser79 phosphorylation (figure 4B). AMPK activation was verified by increased Thr172 phosphorylation (figure 4C) and increased in vitro kinase activity (figure 4D). FAS, the enzyme complex catalyzing the synthesis of fatty acids (figure 4F) as well as HSL, the rate-limiting enzyme in lipolysis (figure 4E), were expressed in HEI-OC1 cells. Lipase activity, as measured using a diacylglycerol analogue as substrate, was inhibited to approximately 50% by an HSL antiserum, whereas diacylglycerol lipase activity in an adipose tissue homogenate as well as that of recombinant HSL were completely inhibited (figure 4E).

Insulin decreases and AICAR increases the phosphorylation of acetyl-CoA carboxylase (ACC) in House Ear Institute-Organ of Corti 1 (HEI-OC1) cells. (A) HEI-OC1 cells were stimulated without or with 1 nM insulin for 0–60 min (n=4) or (B–D) with 1 mM AICAR (n=3) for 60 min. The phosphorylation state of ACC and AMP-activated kinase (AMPK) were analyzed by western blot analysis using ACC Ser79 (A, B) and AMPK Thr172 (C) antibodies and the activity state of AMPK was measured against the peptide substrate AMARA in AMPK immunoprecipitates (n=3) (D). Blots are representative of three to four independent experiments (samples are shown in duplicate). pACC and pAMPK western blot analysis signals were normalized to control samples not stimulated by insulin or AICAR. For effect of insulin on ACC phosphorylation (A), the 20 min time point was used for quantification. (E) Hormone-sensitive lipase (HSL) activity was determined by immune-inhibition and compared with a control sample incubated with a preimmune serum as described in ‘Methods’ section (n=3). (F) HEI-OC1 cells were stimulated without or with 10 nM insulin for 0–60 min. The expression of FAS was analyzed by western blot analysis using FAS antibody, shown is a representative blot. Data are presented as means±SEM. *P<0.05, **p<0.01 vs control (con) (A–D). DAG, diacylglycerol; FAS, fatty acid synthase; GAPDH, glyceraldehyde-3-phosphate dehydrogenase; Hsp90, heat shock protein 90; ins, insulin.
Discussion
In this study, we investigated the presence and size of EH in HFD-fed C57BL/6J mice using MRI and gadolinium,20 22 23 and insulin signaling in HEI-OC1 auditory cells. Importantly, the development of EH was used as a marker for inner ear dysfunction, but the mechanisms involved in hydrops development were not addressed. Our results indicate that HFD-fed C57BL/6J mice indeed develop inner ear EH and that insulin signaling takes place in HEI-OC1 cells.
C57BL/6J mice fed HFD is a robust and widely used model to study effects of insulin resistance, impaired glucose homeostasis and early type 2 diabetes.21 In a recent study from our laboratory, using the same batch of HFD and the same mouse strain, the onset of insulin resistance and lowering of insulin-induced phosphorylation of PKB was noted already after 2 days on HFD.28
Our present results, indicating dysfunction of the inner ear by HFD feeding using EH as a read-out, agree with several previous studies showing HFD-induced damage to the inner ear.10 29 30 To our knowledge, the development in vivo of EH using MR and gadolinium has not previously been reported on in the context of insulin resistance and diabetes. Furthermore, it should be noted that in the present study EH developed already after 4 weeks of HFD feeding.
It should be noted that type 1 diabetes and type 2 diabetes could impact on the auditory systems by common mechanisms related to hyperglycemia. However, insulin resistance or hyperinsulinemia, characteristic features of type 2 diabetes, may cause damage via separate mechanisms.10 11 Thus, development of EH in our study could be related to systemic hyperglycemia and/or insulin resistance/hyperinsulinemia. It has been shown that administration of insulin to guinea pigs leads to reduction in [K+] and increase in [Na+] in the endolymph, which, by increasing the osmotic pressure, could result in EH.13 14 Furthermore, administration of insulin to guinea pigs has been shown to reduce cochlear microphonics and administration of insulin to sheep showed reductions in DPOAE indicating loss of outer hair cells’ function.15 16 Interestingly, in a recent cross-sectional study insulin resistance, impaired fasting glucose and beta-cell dysfunction were reported as independent risk factors for impaired hearing.12
Development of EH could also be related to altered levels of adipose tissue-derived factors such as increased flux of free fatty acids, increased release of proinflammatory cytokines and altered secretion of adipokines.31 Interestingly, adiponectin, one of the major adipokines released from adipocytes, was suggested to be a mediator of obesity-associated, age-related hearing impairment.32
The finding that classical insulin signaling, involving the PI3-kinase/PKB node, takes place in HEI-OC1 cells agrees with a recent study showing the expression of the insulin receptor in supporting cells of the organ of Corti from mouse17 and also with the expression of insulin signaling components in the human saccule sensory epithelium.19 20 Regarding the PI3-kinase/PKB signaling node, several studies have demonstrated that a decrease in PI3-kinase/PKB signaling in the organ of Corti cells is associated with hearing loss.33 34 Also, following aminoglycoside treatment, PI3-kinase/PKB signaling has been shown to protect against gentamycin ototoxicity in explants of the organ of Corti.35 These results are compatible with a negative impact of organ of Corti insulin resistance on hearing.
The cross-talk between insulin and cAMP is highly relevant, cAMP being a key component in the regulation of ion and fluid homeostasis in the inner ear.36 37 For example, as in the kidney, in the inner ear vasopressin acts on aquaporin 2 and fluid transport via increases in cAMP.36 The findings that IBMX, a general PDE inhibitor, could mimic the ability of isoproterenol to reduce the insulin signaling capacity indicates a role for PDEs in the cross-talk with insulin. The expression of cAMP-degrading and cGMP-degrading enzymes PDE1B, PDE3B and PDE4D in HEI-OC1 auditory cells is in agreement with previous results showing the expression of these and other PDE family members in the human saccule19 38 and with results showing the development of EH in response to PDE3 and PDE4 inhibitors.20 However, we could not demonstrate a connection between PDE1, PDE3 or PDE4 and insulin signaling in HEI-OC1 cells such as that shown in adipocytes and hepatocytes, where insulin lowers cAMP by activating PDE3B.39
Our results indicate that enzymes involved in de novo lipogenesis and lipolysis, ACC, FAS and HSL, are expressed in HEI-OC1 cells, and that insulin lowers the phosphorylation of ACC. The latter is presumably associated with increased synthesis of fatty acids and formation of triglycerides. We also show that phosphorylation of ACC increased when cells were incubated with AICAR, an activator of AMPK, a major regulator of cellular energy homeostasis. Altered expression/activity of AMPK in the organ of Corti has previously been shown to protect against as well as promote hearing loss following acoustic overstimulation.40 41 The role of ACC in AMPK-mediated effects on hearing remains to be clarified.
Interestingly, lipid droplets have been detected in Hensen cells in the auditory organ and it has been suggested that these droplets have an important role in inflammatory responses in the cochlea.42 In adipocytes, the main role for HSL is to catalyze the hydrolysis of stored triacylglycerols during periods of energy shortage.39 In addition to the generation of energy substrates, HSL could also provide the auditory cells with lipid signaling molecules, for example, long-chain acyl-CoA and diacylglycerol (DAG) which has been described in other cell types, for example, in pancreatic beta-cells.43 In various non-adipocyte-producing or non-steroid-producing cells, including beta-cell lines and in rat and mouse islets, DAG lipase activity has been reported in the range of 2.2–9.2 mU/mg protein and HSL immuno-inhibition was from 22% to 77%43 in agreement with our results in HEI-OC1 cells.
In conclusion, insulin might impact on the organ of Corti by mechanisms used in classical target cells for insulin action. Thus, defects in inner ear insulin action could contribute to the previously described association between diabetes and inner ear dysfunction.1–5 It is possible that direct effects of insulin signaling on regulatory systems for fluid and ion homeostasis as well as energy metabolism act as a new regulatory mechanism for the organ of Corti in normal situations and in disease. Although in the present study mechanisms for the development of EH have not been addressed, it is possible that defects in insulin action in the organ of Corti contributes to the development of EH since the vasopressin/aquaporin 2 system as well as key ion transporters, Na,K-ATPase and the sodium transporter Enac, are known to be expressed in the organ of Corti.44–47 Interestingly, in kidney cells, insulin has been shown to regulate these transporters.48 49 On the other hand, EH could just be a marker for risk to develop inner ear/cochlear dysfunction independent of the causative etiology, perhaps making the organ of Corti cells more vulnerable to metabolic stressors, such as dysregulated glucose homeostasis and insulin resistance/hyperinsulinemia. Glucose is considered to be the primary energy source for the cochlea and interestingly, insulin-dependent glucose uptake in the organ of Corti was recently reported.17 Although there is no indication that cells from the stria vascularis express insulin receptors,17 we plan to investigate them in the near future because of their key role in the production of the endolymph. However, we anticipate problems in separating the contribution of cells from the cochlea and the stria vascularis since the composition of the endolymph and the endocochlear potential depends both on the active electrogenic extrusion of K+ into the scala media by the stria vascularis and by the passive drainage of K+ from scala media, largely through the hair cells in the organ of Corti.50
Study limitation and future research
We used MR and gadolinium contrast to demonstrate an expansion of the EFC as a marker for inner ear dysfunction in the context of HFD/insulin resistance. A limitation of this study, however, is that we have not directly investigated mice cochleae in regard to morphology (IHC), protein expression and, most important, we did not provide direct evidence that the cochlea in vivo is a target of insulin action or resistance. It will be important to link such mechanisms to (dys)regulation of inner ear fluid and energy homeostasis, and we plan to address these questions in upcoming studies. It will also be of importance to take into consideration the interaction between type 2 diabetes and age-induced hearing loss, since it has been shown in animal models that age-induced hearing loss is enhanced by diabetes.5 9
Supplemental material
Abstract translation
This web only file has been produced by the BMJ Publishing Group from an electronic file supplied by the author(s) and has not been edited for content.Acknowledgments
Lund University Bioimaging Center (LBIC) is gratefully acknowledged for providing experimental resources. ED, A-KP, FK, BM, KS, OG, CH are affiliated with Lund University Diabetes Center (LUDC).
References
Footnotes
Contributors ED, MM, CH, A-KP conceived the study and designed the experiments. A-KP, FK, BM, RIZ conducted the experiments. A-KP, FK, ED, CH analyzed the data. ED drafted and FK helped to edit the manuscript. All authors interpreted the data, contributed to discussion and critically revised the manuscript and figures. All authors approved the final version of this manuscript. ED is responsible for the integrity of the work as a whole.
Funding The work was supported by grants from the Swedish Medical Research Council Dnr 2019-01246, the Swedish Diabetes Foundation, the Swedish Foundation for Strategic Research Dnr IRC 15-0067, the Albert Påhlsson Foundation, Sweden, the Crafoord Foundation, Sweden, Diabetes Wellness Sweden, Skane County Council’s Research and Development Foundation, Sweden and the Faculty of Medicin, Lund University, Sweden. The authors alone are responsible for the content and writing the paper.
Competing interests None declared.
Patient consent for publication Not required.
Ethics approval All animal procedures were approved by the Regional Ethical Committee for Animal Experiments in Malmö/Lund.
Provenance and peer review Not commissioned; externally peer reviewed.
Data availability statement Data are available on reasonable request. All data relevant to the study are included in the article or uploaded as supplementary information. To obtain MR raw data contact the corresponding author ED (eva.degerman@med.lu.se) to obtain images as zipped dicoms. All other data relevant for the study are included in the article.