Article Text

Abstract
Introduction Chronic inflammation is observed in type 2 diabetes islets, and fat deposition in the pancreas affects insulin secretion and glucose tolerance. However, the relationship between this inflammation and pancreatic fat deposition has not been elucidated.
Research design and methods We examined pancreatic sections from 60 Japanese patients obtained by pancreatectomy. We evaluated pancreatic fat-cell area (%) and CD68-positive (CD68+) cells per islet histologically and examined the relationships between these histological findings and various clinical parameters.
Results The number of CD68+ cells per islet in the diabetes group was significantly higher than that in the normal glucose tolerance group (p=0.026). Moreover, CD68+ cells per islet were significantly correlated with body mass index (r=0.33, p=0.0080), fasting C-peptide immunoreactivity (r=0.46, p=0.0042), homeostasis model assessment insulin resistance (r=0.38, p=0.016), C-peptide index (r=0.38, p=0.018), the area under the glucose concentration curve (AUCglucose) at the 75 g oral glucose tolerance test (r=0.49, p=0.0065) and fat-cell area (r=0.51, p<0.0001). In multiple regression analyses, fat-cell area (β=0.600, p=0.0027) and AUCglucose (β=0.453, p=0.0042) were the independent and significant determinants of CD68+ cells per islet.
Conclusion The inflammation of islets is associated with pancreatic fatty infiltration and hyperglycemia, which may further aggravate glucose tolerance.
- diabetes mellitus, type 2
- inflammation
- pancreas
- obesity
This is an open access article distributed in accordance with the Creative Commons Attribution Non Commercial (CC BY-NC 4.0) license, which permits others to distribute, remix, adapt, build upon this work non-commercially, and license their derivative works on different terms, provided the original work is properly cited, appropriate credit is given, any changes made indicated, and the use is non-commercial. See: http://creativecommons.org/licenses/by-nc/4.0/.
Statistics from Altmetric.com
Significance of this study
What is already known about this subject?
Pancreatic islet inflammation is observed in patients with human type 2 diabetes, where macrophages are the most frequent immune cells.
Fat deposition in the pancreas could affect insulin secretion and glucose tolerance.
What are the new findings?
The degree of islet inflammation was higher in patients with type 2 diabetes than that in subjects with normal glucose tolerance.
Islet inflammation was closely associated with pancreatic fat deposition and hyperglycemia.
How might these results change the focus of research or clinical practice?
Future study should focus on the relationship between islet inflammation and longitudinal change of insulin-secreting capacity in type 2 diabetes.
Diabetes therapy focusing on reducing pancreatic fat deposition might have the possibility that islet inflammation could ameliorate, resulting in more preserved β-cell function.
Introduction
Type 2 diabetes is characterized by insulin resistance and impaired insulin-secreting capacity. Chronic inflammation in various organs is observed in patients with type 2 diabetes1 2 and is associated with insulin resistance.3 Inflammation in adipose tissue and the liver has been well studied,4 5 and this inflammation is closely associated with obesity, including metabolic syndrome.4 5 It has recently been reported that increased pancreatic islet-associated immune cells were also observed in patients with human type 2 diabetes, high-fat diet-fed C57BL/6J mice, GK rats and db/db mice,6 where macrophages were the most frequent immune cells.7 β-cell dysfunction with worsening glucose tolerance might be partly derived from this type of inflammation.8 However, the etiology and pathophysiology of this islet inflammation have not been elucidated.
Pancreatic fatty infiltration is one of the ectopic fat depositions, as are visceral fat accumulation and fatty liver. These ectopic fat depositions may be derived from lipid oversupply and may be associated with the elevation of intracellular lipid metabolites and/or fatty infiltration, which is adipocyte infiltration.9 Fatty liver, which is lipid deposition in hepatocytes, induces inflammation and progression to non-alcoholic steatohepatitis5; thus, ectopic fat deposition might be one of the causes of organ inflammation, leading to organ failure. We demonstrated that pancreatic fat deposition evaluated by CT scans was strongly and positively associated with the longitudinal decrease in endogenous insulin-secreting capacity,10 and we also showed that histological pancreatic fatty infiltration had a strong correlation with glucose intolerance within 1 year of pancreatectomy in preoperative patients without diabetes.11 In Zucker diabetic fatty rats, triglyceride accumulation in the exocrine pancreas precedes the onset of overt diabetes.12
Thus, the association of chronic inflammation with type 2 diabetes and the association of pancreatic fat deposition with type 2 diabetes have been studied, but it is unclear whether this islet inflammation is relevant to pancreatic fat deposition. We aimed to clarify the relationship between islet inflammation, evaluated by macrophage infiltration, and pancreatic fatty infiltration in patients with various degrees of glucose intolerance by immunohistochemical analyses.
Research design and methods
Patients
We enrolled 60 Japanese patients who had undergone pancreatic resection between 2008 and 2013 and between 2018 and 2019 at the Department of Gastroenterological Surgery, Osaka University Hospital, and had agreed to participate in this study. Patients with renal failure (estimated glomerular filtration rate <30 mL/min/1.73 m2) and patients with pancreatic endocrine tumors were excluded from this study. Patients underwent a 75 g oral glucose tolerance test (OGTT) at 1–60 days before pancreatic resection, and the results of the test were used to classify the patients into three groups: normal glucose tolerance (NGT), impaired glucose tolerance (IGT), and diabetes mellitus (DM). One patient was diagnosed with new DM without the 75 g OGTT based on his medical history. The DM group included patients undergoing long-term medical intervention.
Laboratory tests
We evaluated glycated hemoglobin (HbA1c) (%, mmol/mol), fasting plasma glucose (FPG) (mmol/L), fasting C-peptide immunoreactivity (F-CPR) (nmol/L), the C-peptide index (CPI) (nmol/mmol), the insulinogenic index (II) (pmol/mmol), homeostasis model assessment insulin resistance (HOMA-IR), the area under the glucose concentration curve (AUCglucose) at 75 g OGTT (min·mmol/L), C reactive protein (CRP) (mg/L), and serum total amylase (IU/L).
Pancreatic tissue processing
We obtained normal pancreatic tissue samples from patients who had undergone pancreatic resection. The tissues were isolated from near the resected margins after intraoperative consultation, fixed immediately in formaldehyde, and embedded in paraffin, and 5 µm sections were cut for subsequent analysis. Paraffin-embedded tissue was stained with H&E and confirmed to contain no cancerous elements. Sections with >30% fibrous area estimated by Azan staining were excluded from this study.
Immunohistochemistry
Primary and secondary antibodies are listed in the online supplementary table. To evaluate intraislet and peripheral islet macrophages, we performed double immunofluorescent staining for insulin and CD68, which is a marker of macrophages. The sections were incubated with rabbit anti-CD68 antibody and biotinylated secondary antibody, followed by Alexa Fluor 488-conjugated streptavidin. Sections were costained with guinea pig anti-insulin antibody, followed by rhodamine-conjugated antibody. We counted the number of CD68-positive (CD68+) cells per islet, which was defined as CD68+ cells around the periphery and/or within islets of more than 100 µm in diameter and expressed as the number per unit of islet. We observed 89.5±65.8 islets per section.
Assessment of pancreatic fatty infiltration
Pancreatic fatty infiltration was evaluated as the fat-cell area in the pancreas histologically. The ratio of the sum of the interlobular and intralobular fat-cell area to the entire pancreatic section was defined as ‘fat-cell area’ (%).13 A mean section area of 101.4±35.5 mm2 was examined for each section. The fat-cell area was quantified using the Win ROOF software program (Mitani Corporation, Fukui, Japan).11
Statistical analysis
Normally distributed data are presented as the means±SD, and non-normally distributed data are presented as the medians and IQRs. Normally distributed data were compared by one-way analysis of variance followed by a post hoc Tukey-Kramer analysis. Non-normally distributed data were compared using the Kruskal-Wallis test followed by a post hoc Steel-Dwass analysis. Multivariable regression analyses were used to assess independent determinants. All statistical analyses were performed with JMP Pro V.14 software (Statistical Analysis System, Cary, North Carolina, USA). Significance was set at p<0.05.
Results
Clinical characteristics and laboratory data
Table 1 shows a comparison of the clinical characteristics among the groups. Patients were classified as NGT (n=21), IGT (n=15), or DM (n=24). Primary diseases were mainly cystic lesions of the pancreas (n=25) and pancreatic cancer (n=19). The surgical procedures were pancreatoduodenectomy (n=35) and distal pancreatectomy (n=25). There were no differences among the groups with respect to age, BMI, F-CPR, CPI, HOMA-IR, CRP or amylase. HbA1c levels were significantly higher in the IGT group than in the NGT group (p<0.01) and higher in the DM group than in the NGT (p<0.01) and IGT (p<0.01) groups. The FPG level in the DM group was significantly higher than those in the NGT (p<0.01) and IGT (p<0.05) groups. The II was lower in the DM group than in the NGT (p<0.05) and IGT (p<0.01) groups. AUCglucose was significantly higher in the DM group than in the NGT (p<0.01) and IGT (p<0.01) groups. In the DM group, 11 patients did not receive any medications for diabetes, and 13 patients received oral antidiabetic agents and/or insulin.
Clinical characteristic of subjects
Pancreatic fat-cell area
Representative views of pancreatic fat cells stained by H&E are shown in figure 1A. There were no significant differences in fat-cell area among the three groups (NGT: 2.5±3.8% vs IGT: 6.6±15.2% vs DM: 2.2%±2.6%, p=0.209) (figure 1B). Fat-cell area had a significant correlation with HOMA-IR (r=0.54, p=0.0004), BMI (r=0.47, p=0.0002), F-CPR (r=0.40, p=0.015) and CPI (r=0.34, p=0.040) but not with age (r=−0.12, p=0.330), HbA1c (r=0.04, p=0.740), FPG (r=0.05, p=0.689), II (r=0.09, p=0.640), AUCglucose. (r=0.11, p=0.558), CRP (r=−0.03, p=0.819) or amylase (r=−0.09, p=0.473) (figure 1C).
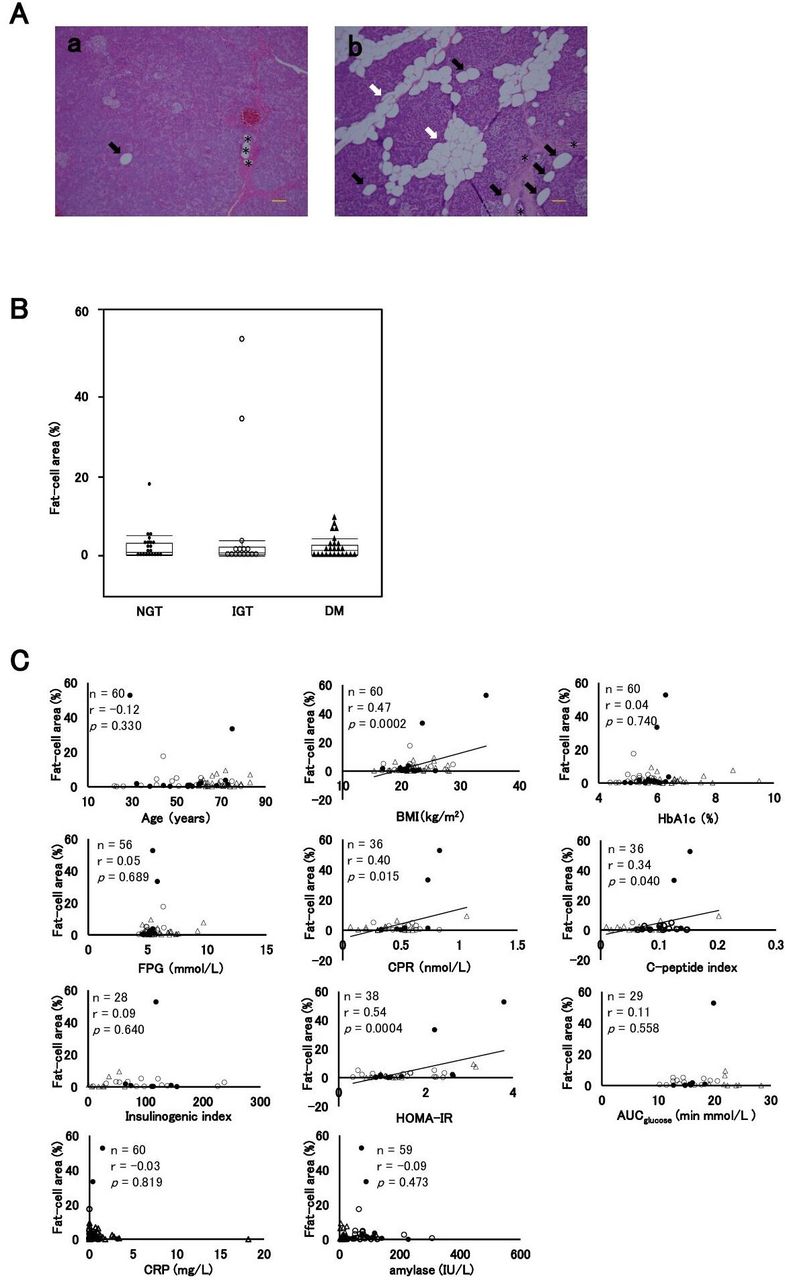
Intrapancreatic fat-cell area. (A) Representative views of H&E-stained sections: (a) patient with DM aged 60 years; fat-cell area, 0.06%; BMI, 20.9 kg/m2; (b) patient with IGT aged 20 years; fat-cell area, 52.7%; BMI, 34.3 kg/m2. Fat-cell area was quantified as the scattered and spread interlobular (white arrows) and intralobular (black arrows) fat-cell area, distinguished from lymph ducts or vessels (asterisk) by the absence of surrounding connective tissue and endothelial cells. Scale bars: 100 µm. (B) Comparisons of the fat-cell area among the NGT, IGT, and DM groups. (C) Correlation coefficient between fat-cell area and clinical parameters of age, BMI, HbA1c, FPG, CPR, C-peptide index, insulinogenic index, HOMA-IR, AUCglucose, CRP and amylase. Closed circles (●), the NGT group; open circles (○), the IGT group; closed triangles (▲), the DM group. AUCglucose, area under the glucose concentration curve; BMI, body mass index; CPR, C-peptide immunoreactivity; CRP, C reactive protein; DM, diabetes mellitus; FPG, fasting plasma glucose; HbA1c, glycated hemoglobin; HOMA-IR, homeostasis model assessment insulin resistance; IGT, impaired glucose tolerance; NGT, normal glucose tolerance.
Intraislet and peripheral islet macrophages
Figure 2 shows a comparison of the number of CD68+ cells per islet among the groups and the correlation coefficient between the number of CD68+ cells per islet and clinical parameters. A representative image showing a CD68-immunopositive cell around the periphery of an islet from a patient with DM is shown in figure 2A. The median CD68+ cells per islet were 0 (IQR, 0.04), 0.017 (IQR, 0.07), and 0.05 (IQR, 0.12) in the NGT, IGT, and DM groups, respectively. The number of CD68+ cells per islet in DM was significantly higher than that in NGT (p=0.026) (figure 2B). CD68+ cells per islet were associated with BMI (r=0.33, p=0.0080), F-CPR (r=0.46, p=0.0042), HOMA-IR (r=0.38, p=0.016), CPI (r=0.38, p=0.018), and AUCglucose (r=0.49, p=0.0065) but not with age (r=0.19, p=0.140), HbA1c (r=0.22, p=0.080), FPG (r=0.15, p=0.253), II (r=−0.19, p=0.316), CRP (r=0.18, p=0.160) or amylase (r=0.01, p=0.932). In addition, we observed a significant correlation between the number of CD68+ cells per islet and fat-cell area (r=0.51, p<0.0001) (figure 2C). In multiple regression analyses, both fat-cell area (β=0.600, p=0.0027) and AUCglucose (β=0.453, p=0.0042) were independent and significant determinants (table 2).
Multiple regression analyses for determinants of the number of islet macrophage

Intraislet and peripheral islet macrophages. (A) Immunofluorescence staining for insulin (INS) (red), CD68 (green) and 4′,6-diamidino-2-phenylindole (DAPI) (blue) in a patient with NGT. (B) Comparisons of the CD68+ cells per islet among the NGT, IGT, and DM groups. (C) Correlation coefficient between CD68+ cells per islet and parameters of age, BMI, HbA1c, FPG, CPR, C-peptide index, insulinogenic index, HOMA-IR, AUCglucose, CRP, amylase and fat-cell area. Closed circles (●), the NGT group; open circles (○), the IGT group; closed triangles (▲), the DM group. AUCglucose, area under the glucose concentration curve; BMI, body mass index; CPR, C-peptide immunoreactivity; CRP, C reactive protein; DM, diabetes mellitus; FPG, fasting plasma glucose; HbA1c, glycated hemoglobin; HOMA-IR, homeostasis model assessment insulin resistance; IGT, impaired glucose tolerance; NGT, normal glucose tolerance.
Conclusions
We observed that islet-associated macrophage infiltration in type 2 diabetes increased compared with NGT, and this is the first study showing significant correlations between pancreatic fat deposition as well as hyperglycemia and islet inflammation.
We observed a significant correlation between the number of islet-associated macrophages and fat-cell area. In a previous report, a significantly higher number of macrophages were found in the islets located in proximity to adipocytes than in other islets.14 These results might indicate that macrophages are recruited to the islets by pancreatic fatty infiltration. One of the key substances that recruits macrophages to islets with pancreatic fatty infiltration may be a saturated fatty acid, palmitate. β cells respond to palmitate via the Toll-like receptor pathway and produce chemokines, including interleukin (IL)-8, IL-6 and monocyte chemotactic protein-1 (MCP-1)14 that recruit M1-type proinflammatory monocytes/macrophages to the islets.15 The pancreatic fat-cell area was positively correlated with BMI and HOMA-IR in this study, suggesting that pancreatic fat deposition might be exacerbated by obesity. This is consistent with some previous studies that report a significant correlation between pancreatic fat and BMI.9 10 16 In another report, fatty pancreas diagnosed by sonographic findings was also associated with visceral fat area and HOMA-IR in subjects without diabetes,17 which indicates that excess pancreatic fat deposition could be one of the components of metabolic syndrome. In our study, there was no significant difference in fat-cell area among the three stages of glucose tolerance groups, which might be derived from no significant difference in BMI among the groups.
This study has shown that islet inflammation in type 2 diabetes may be exacerbated not only in relation to excess pancreatic fat deposition but also hyperglycemia. Although there was no significant difference in pancreatic fat-cell area among the three glucose tolerance groups, the number of islet-associated macrophages was significantly increased in patients with diabetes compared with patients without diabetes, suggesting that the islet inflammation shown in our study could be greatly attributed to a hyperglycemic state. The mechanism that explains why macrophages are recruited to the islets by hyperglycemia may be as follows. Hyperglycemia increases IL-1β mRNA levels in β cells.18 Because β cells express IL-1 receptor type 1, β cells secrete chemokines in response to IL-1β in an autocrine or paracrine manner, which leads to the recruitment of macrophages and a vicious cycle of inflammation.8 On the other hand, a previous report showed that there was no significant difference in the number of islet-associated macrophages between patients with type 2 diabetes and those without.19 In that report, both groups of patients were obese, and obesity induced inflammation, as described previously.4 5 It is speculated that the impact of obesity on islet inflammation might obscure the impact of hyperglycemia in that study. Since most patients were not obese at all glucose tolerance stages in our study, the impact of hyperglycemia might become apparent.
CRP level, which is one of the sensitive physiological markers of systemic inflammation, did not show a significant difference among the three groups. CRP level, which is generally associated with BMI,20 was positively correlated with BMI (r=0.29, p=0.022) but not with the glycemic parameters or fat-cell area (online supplementary figure 1). These results might suggest that obesity causes both whole-body inflammation and islet inflammation, while hyperglycemia also affects islet inflammation rather than whole-body inflammation. We also evaluated serum total amylase level as one of the possible local inflammation parameters of pancreas. The amylase level did not show a significant difference among the three groups, and this level was not correlated with any clinical parameters or fat-cell area (online supplementary figure 2). In addition, the amylase level was not correlated with the number of islet-associated macrophages (data not shown). These results might suggest that macrophages recruited by pancreatic fatty infiltration and hyperglycemia might injure β cells rather than the entire pancreas.
Supplemental material
A previous study reported that islet inflammation derived from lipotoxity could deteriorate β-cell function in experimental animal models.15 A direct negative association between islet inflammation and insulin-secreting capacity was not observed in our study, but referring to this report, we found that the increased islet inflammation observed in patients with type 2 diabetes might promote the worsening of glucose intolerance.
One patient with DM had received sodium-glucose co-transporter-2 (SGLT-2) inhibitor before pancreatic resection. We consider that SGLT-2 inhibitors might ameliorate pancreatic steatosis, where such effect is observed in visceral adipose tissue,21 and affect the results. Thus, we investigated again after excluding the patient; however, the results did not change (data not shown). The effect of SGLT-2 inhibitors on fat deposition and islet inflammation would be further investigated in the future.
There is a limitation in our study. It is difficult to exclude the impact of the primary diseases on histological findings or clinical backgrounds because some individuals in this study had malignant diseases of the pancreas, hepatobiliary system and duodenum. However, there were no significant differences in islet-associated macrophage and pancreatic fat-cell area between patients with malignant diseases and those without (data not shown).
In conclusion, islet inflammation occurs in association with pancreatic fatty infiltration and glucose intolerance and may contribute to further worsening of glucose intolerance.
Acknowledgments
We thank Ms. Misako Kobayashi for excellent technical assistance.
References
Footnotes
Contributors TH analyzed the data and wrote the manuscript. YF and KF contributed to the discussion. HE examined the patients and obtained pancreatic tissue samples. YF and JK analyzed the data and reviewed/edited the manuscript. IS contributed to the discussion and reviewed/edited the manuscript. TH is the guarantor of this work and, as such, had full access to all the data in the study and takes responsibility for the integrity of the data and the accuracy of data analysis.
Funding This study was supported in part by G-7 Scholarship Foundation.
Competing interests None declared.
Patient consent for publication Not required.
Ethics approval This study design and protocol were approved by the ethics committee of Osaka University (approval number: 13 279–5).
Provenance and peer review Not commissioned; externally peer reviewed.
Data availability statement Data are available upon reasonable request. All data relevant to the study are included in the article or uploaded as supplementary information. There is no additional information.