Article Text

Abstract
Introduction Most patients with type 2 diabetes require sequential addition of glucose-lowering agents to maintain long-term glycemic control. In this retrospective, observational study, we compared intensification with a glucagon-like peptide-1 receptor agonist (GLP-1 RA), oral antidiabetic drugs (OADs), and insulin in patients receiving two OADs, using US electronic health records and claims data.
Research design and methods For inclusion, patients in the IBM MarketScan Explorys database were required to have claims for two different OADs in the 180-day baseline period and ≥1 claim for a different OAD/GLP-1 RA/insulin at index date (treatment intensification). Changes in glycated hemoglobin (HbA1c) and weight from baseline were assessed at 180 days postindex. Patients were propensity score-matched by baseline characteristics and exact-matched by HbA1c category (HbA1c cohort and weight/composite outcomes cohort) and body mass index (BMI) category (weight/composite outcomes cohort only) to obtain balanced treatment arms. The primary endpoint was the percentage of patients reaching target HbA1c <7% (53 mmol/mol).
Results Significantly more patients intensifying with a GLP-1 RA achieved HbA1c <7% than those receiving OAD(s) (OR: 1.35; 95% CI 1.03 to 1.77; p=0.032) or insulin (OR: 1.77; 95% CI 1.27 to 2.47; p<0.001). GLP-1 RAs were also associated with a significantly greater chance of not gaining weight; significantly greater HbA1c and weight decreases from baseline; and a significantly greater chance of HbA1c <7%, no weight gain and discontinuation of ≥1 baseline OAD (composite outcome), compared with OAD(s) or insulin.
Conclusions In propensity score-matched cohorts, GLP-1 RAs demonstrated significant benefits for both glycemic control and weight management over additional OAD(s) or insulin, respectively, indicating that they may represent the optimal choice at these points in the treatment pathway.
- observational study
- glucagon-like peptide 1
- blood glucose
- weight loss
This is an open access article distributed in accordance with the Creative Commons Attribution Non Commercial (CC BY-NC 4.0) license, which permits others to distribute, remix, adapt, build upon this work non-commercially, and license their derivative works on different terms, provided the original work is properly cited, appropriate credit is given, any changes made indicated, and the use is non-commercial. See: http://creativecommons.org/licenses/by-nc/4.0/.
Statistics from Altmetric.com
Significance of this study
What is already known about this subject?
For patients with type 2 diabetes receiving two oral antidiabetic drugs (OADs) who require treatment intensification to maintain glycemic control, physicians may prescribe a third oral agent, a glucagon-like peptide-1 receptor agonist (GLP-1 RA) or insulin.
What are the new findings?
Compared with either additional OAD(s) or insulin, GLP-1 RAs are associated with significantly greater chances of meeting a glycated hemoglobin (HbA1c) target of <7%, of not gaining weight, and of achieving both these outcomes while discontinuing at least one baseline OAD.
GLP-1 RAs are also associated with significantly greater HbA1c and weight decreases from baseline than either additional OAD(s) or insulin.
How might these results change the focus of research or clinical practice?
These results suggest that GLP-1 RAs may represent the optimal treatment choice for patients receiving two OADs, providing benefits in terms of glycemic control, weight management and baseline medication discontinuation.
Introduction
Achieving glycemic control is a major treatment aim in type 2 diabetes, and maintenance of glycated hemoglobin (HbA1c) at or below target levels is associated with reductions in the risk of long-term complications.1 2 Weight management is both a treatment aim and a key consideration in improving glycemic control.3 However, in most cases, long-term maintenance of glycemic control requires sequential addition of multiple glucose-lowering agents.4
The standard of care for type 2 diabetes in recent years has been to use metformin as a first-line therapy, followed by treatment intensification with additional oral antidiabetic drugs (OADs), commonly sulfonylureas (SUs) or dipeptidyl peptidase-4 inhibitors (DPP-4is).4 However, clinicians have multiple options for patients requiring treatment intensification. Decisions are based on various considerations, including risk of hypoglycemia, weight management, side effects, comorbidities and patient preference, which is often influenced by administration route and convenience of treatment.4 The American Diabetes Association (ADA) guidelines emphasize the importance of timely treatment intensification for achieving glycemic control and recommend that treatment be assessed every 3–6 months,4 creating frequent opportunities for healthcare providers to consider intensification options.
Consequently, treating physicians require robust evidence that takes into account all factors informing the decisions made in clinical practice, as a complement to data from randomized controlled trials (RCTs). Well-designed, real-world studies can identify large, diverse cohorts that are representative of patients at specific points in the therapeutic pathway, yielding comparative effectiveness data for different intensification options. Patients’ experiences with treatment can also be examined using these data sources, by assessing medication-taking behavior.
We designed the retrospective, observational PATHWAY study (Comparison of Treatment Intensification Options on Health Outcomes and Persistency for Real World T2DM Patients at Early and Late Stages of OAD Treatment) to identify optimal therapeutic options for patients with type 2 diabetes at different treatment intensification stages, making use of linked US electronic healthcare records (EHR) and administrative claims data. In this analysis, PATHWAY 2-OADs, we have focused on treatment intensification with additional OAD(s), a glucagon-like peptide-1 receptor agonist (GLP-1 RA) or insulin in patients receiving two OADs (online supplemental figure 1). This comparison reflects a common treatment decision in clinical practice during the time that our study was conducted: it would be expected that most patients receive metformin plus DPP-4is or SUs, with injectable therapies considered as an alternative to a third OAD when further intensification is required, as shown in another recent analysis of treatment intensification in US patients receiving two OADs.5 Here, we assess HbA1c and weight outcomes, discontinuation of baseline OADs, and adherence to and persistence with intensification treatment.
Supplemental material
Research design and methods
Data source
We used data from the IBM MarketScan Explorys Linked Claims-EHR Database (IBM Watson Health, Armonk, New York, USA), which combines anonymized EHR with inpatient and outpatient administrative claims from commercially insured patients.6 Available data include medical history, prescriptions, clinical events, and laboratory tests from more than 50 million unique patients across all care settings, representing approximately 15% of the US population. Linkage to MarketScan allows confirmation that patients collected their prescriptions.7 At the time of the analysis, more than 500 000 patients included in the entire database had at least one code for type 2 diabetes.
Study design and patient population
This was a retrospective, observational study, with index period from March 1, 2013 to October 31, 2018. For inclusion, patients aged 18 years or older are required to have been continuously enrolled in the database for 180 days each side of treatment intensification (index date (day 0); figure 1). Patients are required to have at least one International Classification of Diseases (ICD)-9 or ICD-10 code8 9 associated with type 2 diabetes any time before or on the index date. Those who had a code associated with type 1 diabetes or secondary diabetes preindex or gestational diabetes or pregnancy during the study period (September 1, 2012–October 31, 2018), were excluded.
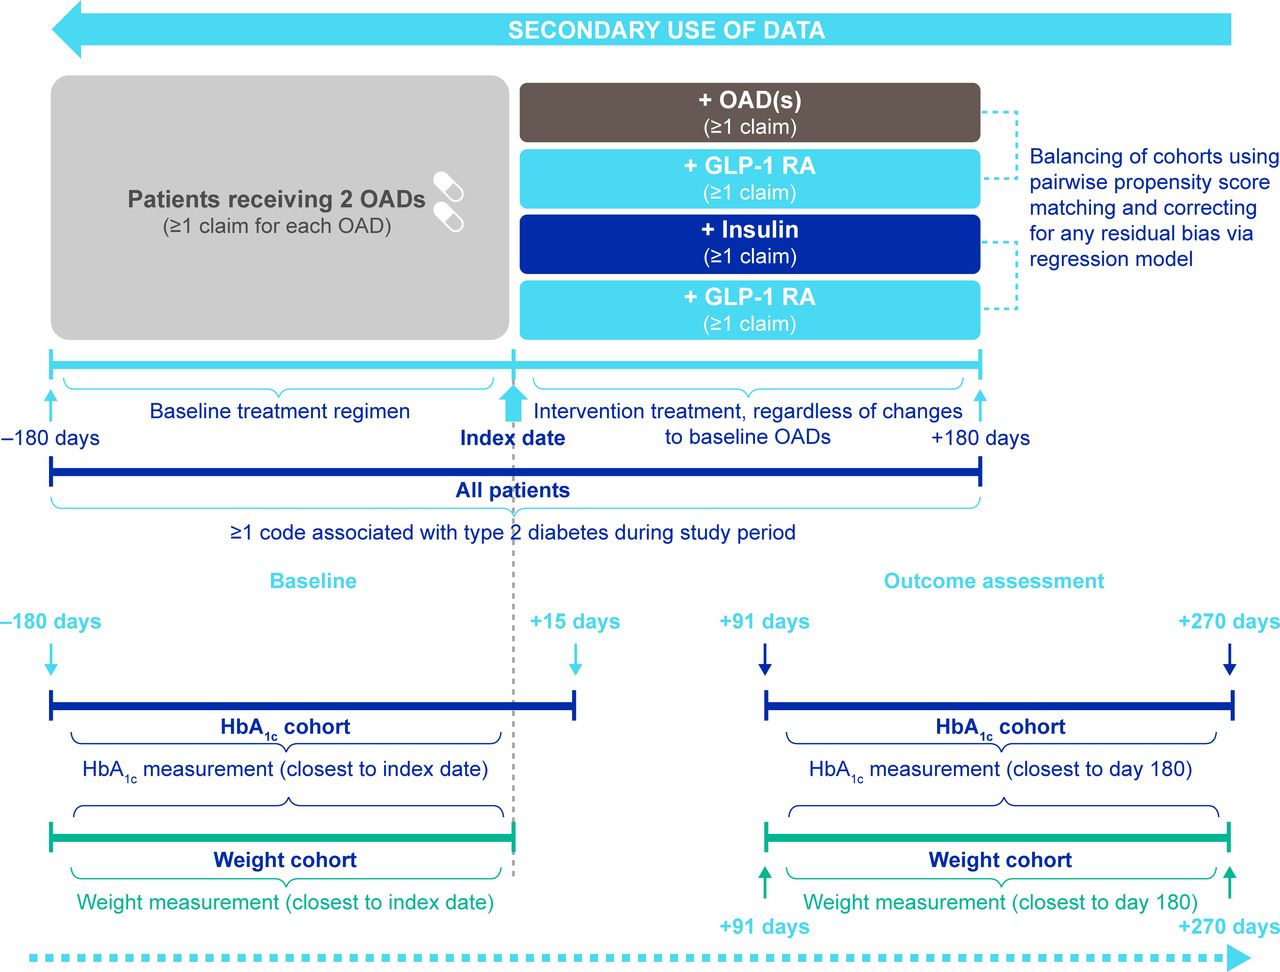
Study design. Index date was defined as the date of treatment intensification. GLP-1 RA, glucagon-like peptide-1 receptor agonist; HbA1c, glycated hemoglobin; OAD, oral antidiabetic drug.
Patients who intensified treatment were identified as those with at least one claim (indicating a prescription fill, typically for 30 or 90 days’ medication) for each of two OADs in different classes in the 180 days preindex (baseline period), and at least one claim for any other OAD (in a different class from baseline OADs), GLP-1 RA or insulin at index date. Patients who received treatments in only one OAD class (including those who switched treatments within a class) or more than two OAD classes before treatment intensification, or had one or more claims for injectables or index treatment during the baseline period, were excluded. Patients who initiated fixed dose combinations as index treatment were defined by the treatment class of the novel agent. For example, in a patient with a metformin claim in the baseline period who initiated metformin+DPP-4i at treatment intensification date, DPP-4i was considered to be the index treatment. Patients with claims for more than one index treatment on two different dates were included in the cohort corresponding to the earliest claim; those with claims for more than one index treatment on the same date were excluded.
Outcomes
We assessed HbA1c reduction and weight reduction at 6 months after treatment intensification (day 180) for GLP-1 RA versus OAD(s) and for GLP-1 RA versus insulin. To maximize the available sample sizes, we analyzed separate cohorts for HbA1c and weight/composite outcomes. Patients with eligible HbA1c and weight measurements were included in both cohorts. Baseline HbA1c and weight were taken as the measurements within the baseline period closest to the treatment intensification date, between day –180 and day 15 for HbA1c, and between day –180 and day 0 for weight. Follow-up measurements were those closest to day 180 (±90 days (days 91–270) for both HbA1c and weight; figure 1).
Patients who discontinued baseline OADs were identified via claims captured in the 6 months after treatment intensification (follow-up period) in the HbA1c cohort. Patients with at least one claim for a given baseline OAD were assumed to have continued receiving this therapy in addition to index treatment; those with no claims were assumed to have discontinued the respective baseline OAD.
The primary endpoint was the percentage of patients reaching target HbA1c <7% (53 mmol/mol). We also assessed the percentages of patients with no weight gain and those who achieved weight loss ≥3%, and calculated the mean absolute HbA1c and weight changes from baseline for each treatment cohort. To reflect the multiplicity of factors that are considered when selecting treatment intensification options—HbA1c, weight and patient preference for fewer medications—we assessed the percentages of patients meeting three composite endpoints:
Target HbA1c <7% (53 mmol/mol) with no weight gain.
Target HbA1c <7% (53 mmol/mol) with discontinuation of one or more baseline OADs.
Target HbA1c <7% (53 mmol/mol) with no weight gain and discontinuation of one or more baseline OADs.
For each endpoint, we calculated the OR for the GLP-1 RA cohort versus the OAD(s) cohort and the insulin cohort.
Adherence and persistence
Adherence to and persistence with intensification treatment over the 180-day follow-up period were assessed in the HbA1c cohort. Our approach was aligned with best practice guidance for assessing medication-taking behavior in claims databases.10 Adherence was summarized as the mean proportion of days covered (PDC); adherent patients were those with PDC ≥0.8 during follow-up. Persistence was summarized as the mean stay time in the full cohorts and as the time to discontinuation for patients who discontinued treatment. Stay time was defined as the treatment period in days from index date until discontinuation (see online supplemental methods) or end of follow-up, with a maximum allowable gap of 60 days. The percentage of patients who persisted with treatment over the entire 180-day period was also calculated.
The date of treatment discontinuation was either the last treatment day (last fill+days’ supply associated with the last fill), if there were no further claims in the 60 days following this date, or day of initiation of new antidiabetic medication class (not baseline or index medication) after the last fill, whichever was the earliest. In the OAD(s) cohort, switching treatment to a different OAD class was considered to be index treatment discontinuation.
Propensity score matching
In non-randomized studies, propensity score (PS) matching is used to obtain patient cohorts that are balanced in terms of their baseline characteristics, controlling for confounding in estimating treatment effects.11 In our analyses, matching was performed separately for each comparison (GLP-1 RA vs OAD(s), GLP-1 RA vs insulin). Patients were exact-matched by baseline HbA1c category to obtain ~0% standardized mean differences (SMD) between treatment arms. In the weight/composite outcomes cohort, patients were also exact-matched by BMI category. Following exact matching, patients were matched pairwise on up to 33 baseline demographic and clinical characteristics, including age, sex, weight, HbA1c, comorbidities and baseline antidiabetic medications (see online supplemental methods).
Matching method was chosen based on the number of patients available after matching and the SMD between comparators, which was required to be ≤10%. For the OAD(s) and GLP-1 RA cohorts, optimal matching with a 1:1 ratio and default 0.25 caliper was used; for the insulin and GLP-1 RA cohorts, a greedy nearest neighbor method with a 1:1 ratio and 0.1 caliper was used.
Statistical analyses
For demographic and clinical characteristics and outcome metrics, mean and SD were calculated for continuous variables. Counts and percentages were calculated for categorical variables.
In line with established methods to control for any remaining confounding variables following PS matching,12 further adjustment for significant baseline covariates was applied in statistical analyses (see online supplemental methods). The differences between cohorts in terms of changes in HbA1c and weight were estimated using analysis of covariance, ORs were estimated using logistic regression, and HRs were estimated using a Cox proportional hazard model. The OAD(s) and insulin cohorts were used as the reference cohorts for the GLP-1 RA cohort in the respective comparisons.
Results
Study population and baseline characteristics
In total, 183 882 patients with type 2 diabetes initiating at least one antidiabetic medication were identified. Of this group, 102 771 had continuous enrollment either side of the index date and met none of the exclusion criteria, of whom 23 467 had at least one claim for each of two OADs in the baseline period. A total of 4792 patients had the requisite HbA1c measurements, and 3927 patients had both HbA1c and weight measurements. Online supplemental table 1 shows the number of these patients receiving each index treatment, before and after matching. In the matched cohorts, all patients had a record of type 2 diabetes diagnosis before index date, with the exception of one patient in the GLP-1 RA versus OAD(s) analysis and two patients in the GLP-1 RA versus insulin analysis, for whom diagnosis and index date were the same. As these patients met the condition of receiving two OAD(s) in the baseline period, it is assumed that this is due to a delay in recording type 2 diabetes diagnosis.
There were prematching disparities in some baseline characteristics across the cohorts; for example, the mean HbA1c was higher in the insulin cohorts (online supplemental table 2 and online supplemental table 3). Following PS matching, these characteristics were well balanced (table 1 and online supplemental table 4). In the HbA1c cohorts, the mean age was 56.0 years for GLP-1 RA versus OAD(s), and 57.2/57.6 years for GLP-1 RA versus insulin. Approximately 50% of patients in each cohort were women. The mean BMI was between 35 kg/m2 and 37 kg/m2, and the mean weight was between 104.1 kg and 107.4 kg. Exact matching by baseline HbA1c category resulted in closely matched cohorts, with SMD of approximately 0% for baseline HbA1c. There was a relatively low prevalence of cardiovascular disease (2.8%–4.5% across cohorts). Baseline characteristics were similar for the weight/composite outcome cohorts.
Postmatching baseline characteristics for the HbA1c cohort
Across the HbA1c and weight/composite outcomes cohorts, the most common combinations of baseline OADs were metformin plus SU (42.2%–50.5%) and metformin plus DPP-4i (26.2%–32.4%; table 1 and online supplemental table 4). To confirm that two OADs were taken at the same time, we assessed days covered and showed that, on average, each patient received two OADs simultaneously for 100 days during the baseline period. For treatment intensification in the HbA1c cohorts, the most common GLP-1 RAs used were liraglutide (49.5%–49.6%), exenatide extended release (22.1%–22.5%) and dulaglutide (19.6%–20.0%; online supplemental figure 2). No patients in the analyses had received injectable or oral semaglutide, because their availability did not overlap with the study period or meet the inclusion criterion requiring 180 days of follow-up. The most common OADs used were DPP-4is (30.9%), SUs (25.1%) and sodium-glucose co-transporter-2 inhibitors (22.3%). The vast majority of the patients who intensified treatment with insulin received a long-acting form (83.2%), with only 5.5% receiving rapid-acting insulin and 4.3% receiving both long-acting and rapid-acting insulin. A similar pattern was observed in the weight/composite outcomes cohorts.
HbA1c reduction from baseline
ORs, 95% CIs, and numbers and percentages of patients achieving single and composite outcomes are presented in figure 2. Absolute changes from baseline are presented in online supplemental figure 3 and online supplemental table 6.

OR for GLP-1 RAs versus OAD(s) or insulin for single outcomes (A, B) and composite outcomes (C, D). GLP-1 RA, glucagon-like peptide-1 receptor agonist; HbA1c, glycated hemoglobin; OAD, oral antidiabetic drug.
GLP-1 RA versus OAD(s)
In total, 38.3% of patients intensifying treatment with GLP-1 RA and 32.1% of those intensifying with OAD(s) reached an HbA1c target of <7% (53 mmol/mol), equating to an OR of 1.35 in favor of GLP-1 RA (95% CI 1.03 to 1.77; p=0.032; figure 2A). This increased to 48.2% vs 34.5% (OR: 2.03; 95% CI 1.41 to 2.92; p<0.001) in patients who were adherent to medication postintensification.
Overall, treatment intensification with either a GLP-1 RA or OAD(s) was associated with mean absolute reductions from baseline in HbA1c of –1.0% (–10.4 mmol/mol) and –0.7% (–7.8 mmol/mol), respectively, with a –0.25% (–2.7 mmol/mol) reduction in favor of GLP-1 RA (p=0.001). The difference between treatments was more pronounced in a subgroup of patients who were adherent to treatment postintensification (GLP-1 RA: n=278, –1.3% (–13.7 mmol/mol); OAD(s): n=313, –0.8% (–8.6 mmol/mol); –0.41% (–4.5 mmol/mol) in favor of GLP-1 RA; p<0.001).
GLP-1 RA versus insulin
In total, 32.7% of those who intensified treatment with GLP-1 RA and 22.9% of those intensifying with insulin reached an HbA1c target of <7% (53 mmol/mol), equating to an OR for GLP-1 RA versus insulin of 1.77 (95% CI 1.27 to 2.47; p<0.001; figure 2B). This increased to 41.9% vs 23.9% (OR: 2.39; 95% CI 1.47 to 3.89; p<0.001) in patients who were adherent to medication (figure 2B).
Treatment intensification with GLP-1 RA was associated with a significantly greater mean absolute reduction from baseline in HbA1c, compared with insulin (–1.3% (–14.0 mmol/mol) and –0.8% (–8.6 mmol/mol), respectively; –0.45% (–4.9 mmol/mol) in favor of GLP-1 RA; p<0.001), including in patients who were adherent to treatment postintensification (GLP-1 RA: n=215, –1.6% (–17.2 mmol/mol) reduction; insulin: n=142, –0.9% (–9.8 mmol/mol) reduction; –0.5% (–5.5 mmol/mol) in favor of GLP-1 RA; p<0.001).
Weight reduction from baseline
GLP-1 RA versus OAD(s)
Consistently greater percentages of those receiving GLP-1 RAs at treatment intensification achieved no weight gain and ≥3% weight loss, versus patients receiving OAD(s). This equated to ORs of 2.10 and 1.72 in favor of GLP-1 RA versus OAD(s) for each respective endpoint (p<0.001; figure 2A). In patients who were adherent to treatment, the OR for no weight gain was 2.71 in favor of GLP-1 RA versus OAD(s).
Treatment intensification with a GLP-1 RA rather than OAD(s) resulted in significantly greater weight loss from baseline (GLP-1 RA: –2.4 kg (–2.2%); OAD(s): –0.7 kg (–0.6%); –1.7 kg in favor of GLP-1 RA; p<0.001), including in patients who were adherent to treatment (GLP-1 RA: –2.8 kg (–2.4%); OAD(s): –0.7 kg (–0.5%); –2.3 kg in favor of GLP-1 RA; p<0.001).
GLP-1 RA versus insulin
Significantly greater percentages of those receiving GLP-1 RAs at treatment intensification achieved no weight gain and ≥3% weight loss versus patients receiving insulin, with ORs of 3.67 and 2.95 in favor of GLP-1 RAs for each respective endpoint (p<0.001; figure 2B). In patients who were adherent to treatment, the OR for no weight gain was 4.40 in favor of GLP-1 RA versus insulin.
Treatment intensification with a GLP-1 RA was associated with significant reductions in weight from baseline, whereas intensification with insulin resulted in a small mean gain (GLP-1 RA: –2.4 kg (–2.3%); insulin: +0.05 kg (+0.3%); –2.5 kg in favor of GLP-1 RA; p<0.001). This pattern was replicated in patients who were adherent to treatment (GLP-1 RA: –2.5 kg (–2.3%); insulin: +0.04 kg (+0.3%); –2.7 kg in favor of GLP-1 RA; p<0.001).
Baseline OAD discontinuation
Full data on the percentages of patients discontinuing each baseline OAD in the HbA1c cohort are shown in online supplemental table 5.
GLP-1 RA versus OAD(s)
In total, 43.2% of those receiving a GLP-1 RA discontinued at least one of their baseline OADs, compared with 29.2% of those who intensified treatment with additional OAD(s), equating to an OR of 1.91 (95% CI 1.48 to 2.48; p<0.001; figure 2A).
GLP-1 RA versus insulin
There was no difference between GLP-1 RA and insulin in terms of baseline OAD discontinuation (40.5% for each treatment; OR: 0.98; 95% CI 0.73 to 1.32; p=0.91; figure 2B).
Composite outcomes
GLP-1 RA versus OAD(s)
Patients who intensified treatment with a GLP-1 RA had a significantly greater likelihood of meeting each composite outcome than those receiving additional OAD(s) (figure 2C). For a target of HbA1c <7% (53 mmol/mol) and no weight gain, the OR was 1.44 (95% CI 1.05 to 1.98; p=0.024) in favor of GLP-1 RA. Patients in this cohort also had a greater chance of achieving HbA1c <7% (53 mmol/mol) with discontinuation of at least one baseline OAD (OR: 2.03; 95% CI 1.36 to 3.02; p<0.001), and of achieving HbA1c <7% (53 mmol/mol) with no weight gain and discontinuation of at least one baseline OAD (OR: 1.87; 95% CI 1.18 to 2.99; p=0.008).
GLP-1 RA versus insulin
Patients who intensified treatment with a GLP-1 RA were significantly more likely to achieve HbA1c <7% (53 mmol/mol) and no weight gain (OR: 3.33; 95% CI 2.08 to 5.33; p<0.001), HbA1c <7% (53 mmol/mol) with discontinuation of at least one baseline OAD (OR: 2.05; 95% CI 1.25 to 3.34; p=0.004), and HbA1c <7% (53 mmol/mol) with no weight gain and discontinuation of at least one baseline OAD (OR: 3.02; 95% CI 1.51 to 6.05; p=0.002) than those who intensified with insulin (figure 2D).
Adherence and persistence
Data on adherence and persistence are shown in table 2.
Adherence and persistence over 180 days postindex for GLP-1 RAs versus OAD(s) and versus insulin
GLP-1 RA versus OAD(s)
Patients receiving a GLP-1 RA were less adherent to treatment than those receiving OAD(s), with a lower mean PDC and a smaller proportion of patients with PDC ≥0.8 (52.5% vs 59.1%; OR: 0.76; 95% CI 0.60 to 0.98; p=0.0032). This trend was affected by the frequency of GLP-1 RA injection: 41.8% of those receiving once-daily (OD) GLP-1 RAs were adherent to treatment, whereas adherence in those receiving once-weekly (OW) GLP-1 RAs (61.1%) was not significantly different from the OAD(s) cohort.
Stay time was not significantly different between the GLP-1 RA cohort and the OAD(s) cohort (HR: 1.16; 95% CI 0.94 to 1.42; p=0.16). A smaller proportion of patients receiving a GLP-1 RA were persistent than those receiving OAD(s) (63.8% vs 67.5%). Overall, 67.8% of patients receiving OW GLP-1 RAs and 57.4% of those receiving OD GLP-1 RAs were persistent.
GLP-1 RA versus insulin
Patients receiving a GLP-1 RA were significantly more adherent to treatment than those receiving insulin, with a higher mean PDC and a greater proportion of adherent patients (54.0% vs 35.7%; OR: 2.11; 95% CI 1.58 to 2.81; p<0.001). Administration frequency of GLP-1 RA appeared to affect adherence rates (OW: 63.3%; OD: 43.7%).
Stay time was significantly longer for the GLP-1 RA cohort than the insulin cohort (HR: 0.68; 95% CI 0.55 to 0.85; p<0.001), and a greater proportion of patients were persistent with treatment, regardless of administration frequency (all GLP-1 RAs: 64.6%; OW: 66.7%; OD: 58.4% vs insulin: 53.0%).
Conclusions
This is one of the first real-world, observational studies using EHR combined with claims data to assess multiple options for treatment intensification in type 2 diabetes. By presenting comparative effectiveness evidence on the full range of choices available at this therapeutic decision point, our findings provide valuable guidance to clinicians. Our PS-matched analysis indicates that patients receiving two OADs have a significantly higher chance of reaching HbA1c targets and achieving weight loss at 6 months following intensification with GLP-1 RA rather than additional OAD(s), provided that they had an equal chance of receiving each intensification option. Similar results were observed for patients who were equally likely to intensify treatment with either a GLP-1 RA or insulin. Overall, 33%–38% of patients intensifying with a GLP-1 RA achieved HbA1c <7% (53 mmol/mol). This is similar to rates reported in previous observational studies: 21%–33% at 12 months in patients intensifying OAD treatment with GLP-1 RA and basal insulin,13 and 30% in patients adding lixisenatide to basal insulin (±OADs).14
Patients in our study receiving a GLP-1 RA rather than OAD(s) or insulin were more likely to achieve target HbA1c without weight gain while discontinuing one or more baseline OADs. For baseline OAD discontinuation as a single endpoint, there was no difference between the GLP-1 RA and insulin cohorts, but patients who intensified treatment with a GLP-1 RA were nearly twice as likely to discontinue a baseline OAD as those in the OAD(s) cohort. Although the reasons for this cannot be inferred retrospectively, it is likely that baseline OAD discontinuation in the GLP-1 RA cohorts was partly driven by patients discontinuing DPP-4is, in line with the ADA guidance.4
Patients who were adherent to intensification therapy tended to achieve greater HbA1c reduction and weight loss from baseline. Medication-taking behavior was affected by both mode and frequency of administration: GLP-1 RAs were associated with higher adherence and persistence than insulin, but significantly lower adherence than OADs. This difference was partly driven by low adherence and persistence rates with OD rather than OW GLP-1 RAs; another possible explanation is the gastrointestinal side effects that are often linked to early discontinuation in this treatment class.4 In future, analyzing adherence and persistence separately during days 0–90 and days 91–180 after intensification would allow examination of medication-taking behavior in those who persisted with treatment beyond 90 days.
Our use of linked EHR and claims data was a major strength of this study because it provided confirmation that all included patients had received their medication. Consequently, our study was able to mimic specific points in the treatment pathway, providing evidence to complement the results of previous RCTs that have examined treatment intensification for patients receiving two OADs.15 Although our approach in assessing GLP-1 RAs as a class rather than individually is limited in its specificity and does not take into account the differences between GLP-1 RAs, it accurately reflects clinical decision-making, whereby treating physicians first identify the most appropriate class of antidiabetic medication before selecting a specific therapy.
Lack of randomization and risk of bias are potential limitations of retrospective observational studies. To mitigate against these, we used PS matching to obtain balanced cohorts and importantly performed exact matching by baseline HbA1c and BMI categories, resulting in cohorts with identical baseline values and allowing us to detect clinically significant changes at follow-up. Subsequent adjustment of the models used to calculate differences between treatment cohorts was intended to address residual confounding, which was particularly valuable for analyses in subpopulations of the main cohorts. We conducted sensitivity analyses using unadjusted models and obtained results similar to the main analyses; however, it is possible that residual confounding remained. It should be noted that PS matching effectively created two subpopulations: those for whom treatment intensification with either an OAD or a GLP-1 RA is indicated and those whose disease has progressed to the requirement for either a GLP-1 RA or insulin. This is reflected in the higher mean HbA1c in the insulin cohorts before matching, indicating that these patients had more advanced disease than those in the other treatment cohorts. Therefore, our results should be interpreted in the context of these distinct treatment decisions. We also acknowledge that, perhaps due to use of the Explorys database, the mean BMI of patients in our study was slightly higher than might be expected in a general population with type 2 diabetes. Although the separation of HbA1c and weight/composite outcomes cohorts could be considered to limit the generalizability of the results, we show that baseline demographic and disease characteristics were similar across all cohorts, providing relatively high confidence that HbA1c and weight benefits are realized in similar patient populations.
Another limitation of claims data is the need to infer some aspects of medication-taking behavior. We selected eligible patients by the presence of relevant treatment claims, with no requirement for continuous treatment periods during the baseline period and no restriction by number of days of index medication prescribed. Although this is an established method of patient identification in claims databases and avoids a possible source of selection bias, it meant that some instances of baseline or index treatment discontinuation may have gone undetected. In future, when more eligible patients are available in these databases, sensitivity analyses requiring overlapping treatment periods could be conducted to assess whether this had an impact on our results.
In our PS-matched cohorts from a population receiving two OADs, treatment intensification with a GLP-1 RA provided significant benefits in terms of glycemic control and weight management compared with additional OADs or insulin, respectively. Future analyses including patients receiving newer GLP-1 RAs would be expected to show even greater benefits associated with this treatment class due to their comparatively greater efficacy. Furthermore, the PATHWAY study design and matching methodology will be valuable to compare different treatment intensification options, to examine other points in the treatment pathway, to assess costs and resource use, and to examine how the availability of oral semaglutide might affect future prescribing practices and patient acceptance of GLP-1 RAs.
Acknowledgments
The authors acknowledge the medical writing assistance of PharmaGenesis Oxford Central.
References
Supplementary materials
Supplementary Data
This web only file has been produced by the BMJ Publishing Group from an electronic file supplied by the author(s) and has not been edited for content.
Footnotes
Contributors All authors contributed to study design, data interpretation, and writing and critical review of the manuscript. KKM performed the data analysis. ARK is the guarantor of this work and as such had full access to all of the data in the study and takes responsibility for the integrity of the data and the accuracy of the data analysis.
Funding This study was funded by Novo Nordisk A/S.
Competing interests CD has performed consultancy for AstraZeneca, Bayer AG and Novo Nordisk A/S. ARK and MLW are employees of, and shareholders in, Novo Nordisk A/S. KKM is an employee of Novo Nordisk Global Service Centre India, which is part of Novo Nordisk A/S. IL has performed consultancy for AstraZeneca, Boehringer Ingelheim Pharmaceuticals, Eli Lilly and Company, Intarcia Therapeutics, Janssen Pharmaceuticals, MannKind Corporation, Novo Nordisk A/S, Sanofi, TARGET PharmaSolutions and Valeritas.
Patient consent for publication Not required.
Provenance and peer review Not commissioned; externally peer reviewed.
Data availability statement Data supporting the findings of this study are under license from IBM. Aggregate data are available from the authors upon reasonable request.
Supplemental material This content has been supplied by the author(s). It has not been vetted by BMJ Publishing Group Limited (BMJ) and may not have been peer-reviewed. Any opinions or recommendations discussed are solely those of the author(s) and are not endorsed by BMJ. BMJ disclaims all liability and responsibility arising from any reliance placed on the content. Where the content includes any translated material, BMJ does not warrant the accuracy and reliability of the translations (including but not limited to local regulations, clinical guidelines, terminology, drug names and drug dosages), and is not responsible for any error and/or omissions arising from translation and adaptation or otherwise.