Article Text

Abstract
Introduction Hemoglobin glycation index (HGI) is the difference between observed and predicted glycated hemoglobin A1c (HbA1c), derived from mean or fasting plasma glucose (FPG). In this secondary, exploratory analysis of data from DEVOTE, we examined: whether insulin initiation/titration affected the HGI; the relationship between baseline HGI tertile and cardiovascular and hypoglycemia risk; and the relative strengths of HGI and HbA1c in predicting these risks.
Research design and methods In DEVOTE, a randomized, double-blind, cardiovascular outcomes trial, people with type 2 diabetes received once per day insulin degludec or insulin glargine 100 units/mL. The primary outcome was time to first occurrence of a major adverse cardiovascular event (MACE), comprising cardiovascular death, myocardial infarction or stroke; severe hypoglycemia was a secondary outcome. In these analyses, predicted HbA1c was calculated using a linear regression equation based on DEVOTE data (HbA1c=0.01313 FPG (mg/dL) (single value)+6.17514), and the population data were grouped into HGI tertiles based on the calculated HGI values. The distributions of time to first event were compared using Kaplan–Meier curves; HRs and 95% CIs were determined by Cox regression models comparing risk of MACE and severe hypoglycemia between tertiles.
Results Changes in HGI were observed at 12 months after insulin initiation and stabilized by 24 months for the whole cohort and insulin-naive patients. There were significant differences in MACE risk between baseline HGI tertiles; participants with high HGI were at highest risk (low vs high, HR: 0.73 (0.61 to 0.87)95% CI; moderate vs high, HR: 0.67 (0.56 to 0.81)95% CI; p<0.0001). No significant differences between HGI tertiles were observed in the risk of severe hypoglycemia (p=0.0911). With HbA1c included within the model, HGI no longer significantly predicted MACE.
Conclusions High HGI was associated with a higher risk of MACE; this finding is of uncertain significance given the association of HGI with insulin initiation and HbA1c.
Trial registration number NCT01959529.
- diabetes mellitus
- type 2
Data availability statement
Data are available upon reasonable request. The datasets generated during and/or analyzed during the current study are available from the corresponding author on reasonable request.
This is an open access article distributed in accordance with the Creative Commons Attribution Non Commercial (CC BY-NC 4.0) license, which permits others to distribute, remix, adapt, build upon this work non-commercially, and license their derivative works on different terms, provided the original work is properly cited, appropriate credit is given, any changes made indicated, and the use is non-commercial. See: http://creativecommons.org/licenses/by-nc/4.0/.
Statistics from Altmetric.com
Significance of this study
What is already known about this subject?
Glycated hemoglobin A1c (HbA1c) remains the gold standard for measurement of glycemic control, despite evidence that some individuals can have persistently higher or lower HbA1c than their plasma glucose would predict; previous studies have demonstrated that high hemoglobin glycation index (HGI) may predict an individual’s risk of developing diabetes complications and associated adverse outcomes, independent of HbA1c.
What are the new findings?
HGI showed variability in response to the initiation of insulin therapy, particularly in the first 12 months; this largely stabilized at 24 months.
Our findings confirm those of previous studies and suggest that HGI may predict major adverse cardiovascular events (MACEs) in a population with type 2 diabetes and established cardiovascular disease or at high cardiovascular risk.
However, these results suggest that HGI is not a better predictor of cardiovascular risk than HbA1c and does not predict risk of severe hypoglycemia.
How might these results change the focus of research or clinical practice?
The results presented suggest that while HGI may be predictive of MACE in certain populations, it may not be robust to the initiation of insulin therapy. Further research is needed to clarify the underlying mechanism of population differences in HGI, how and when to calculate HGI, and the efficacy of HGI-lowering interventions on reducing cardiovascular risk.
Introduction
Glycated hemoglobin A1c (HbA1c) is considered the gold standard for measurement and monitoring of glycemic control, despite evidence demonstrating that some individuals have consistently higher or lower HbA1c than their plasma glucose (PG) levels would predict.1 The factors contributing to this variation are not fully understood but are thought to be biologically determined and to include erythrocyte lifespan, intracellular glucose transport, enzymatic activity, hemoglobinopathies, and race and ethnicity.2–10 Whether individual variation in hemoglobin glycation is clinically relevant continues to be debated, but raises concern that HbA1c may not accurately assess glycemic control in certain individuals and patient populations.11 12 Additional tools have therefore been developed to determine whether individuals with discordant HbA1c based on PG levels are at higher risk for diabetic complications. The hemoglobin glycation index (HGI) utilizes a population-based linear regression equation to derive a predicted HbA1c from PG measurements. The predicted HbA1c is subtracted from the observed HbA1c to calculate the HGI (ie, HGI=observed HbA1c–predicted HbA1c).1
Several trials have demonstrated that differences in HGI predict complications in both type 1 diabetes (T1D) and type 2 diabetes (T2D), including mortality, cardiovascular disease (CVD), hypoglycemia and microvascular complications.13–16 Furthermore, studies have indicated that HGI can also predict the response to antihyperglycemic medications.17 18 Together, these data suggest that HGI may have a role in predicting outcomes for people with diabetes and in helping to individualize care. However, controversy remains as to whether HGI could be an effective tool to predict diabetes complications. The effect of initiating antihyperglycemic medication on HGI is unclear and may be dependent on the way HGI is calculated. In the major cardiovascular outcomes trials that have assessed HGI, it has been calculated via a single fasting plasma glucose (FPG) value. As basal insulin initiation primarily impacts FPG, it is plausible that initiation or titration of insulin would alter individual HGI. Whether HGI is robust to insulin initiation has not been determined. The predictive value of HGI compared with HbA1c has also not been established.
In this secondary analysis, data from the Trial Comparing Cardiovascular Safety of Insulin Degludec vs Insulin Glargine in Patients With Type 2 Diabetes at High Risk of Cardiovascular Events (DEVOTE) were used to assess the utility of HGI calculated from a single FPG as a tool for guiding risk prediction in T2D and the stability of HGI following the initiation or titration of insulin therapy.
Methods
Study design
DEVOTE was a multicenter, international, randomized, double-blind, active comparator-controlled cardiovascular outcomes trial designed to evaluate the noninferiority of cardiovascular safety of insulin degludec (degludec) versus insulin glargine 100 units/mL (IGlar U100), in a population of participants with T2D at high risk for CV disease.19 Overall, 7637 participants were randomized 1:1 to receive either degludec or IGlar U100. It was an event-driven trial and continued until 633 positively adjudicated, primary cardiovascular outcome events were accrued.19 Participants were either aged ≥50 years with a history of CVD or moderate chronic kidney disease or aged ≥60 years with ≥1 risk factor for CVD.19 Participants were required to be treated with ≥1 oral or injectable antihyperglycemic agent and have an HbA1c level ≥7.0% or <7.0% if treated with ≥20 units of basal insulin per day.19 Full details are available in the primary report.20
DEVOTE was registered with ClinicalTrials.gov. The trial was conducted in accordance with the Declaration of Helsinki and ICH Good Clinical Practice Guideline.20
Primary analysis endpoints
The primary endpoint of DEVOTE was the time to first occurrence of a three-point major adverse cardiovascular event (MACE), consisting of cardiovascular death, nonfatal myocardial infarction or nonfatal stroke.19 Severe hypoglycemia was a prespecified, multiplicity-adjusted secondary endpoint and defined using the American Diabetes Association criteria as an event requiring assistance of another person to actively administer carbohydrates, glucagon or take other corrective actions.21 Both endpoints were centrally adjudicated by independent investigators who were blinded to randomized treatment allocation.19 Additional endpoints included HbA1c, measured at randomization, months 3, 6, 9 and 12, and then yearly thereafter; and FPG, measured at randomization and yearly thereafter. Primary and secondary endpoints were assessed from baseline to completion of the study.19
Secondary analysis outcomes
In this secondary analysis of data from DEVOTE, outcomes were analyzed for the whole trial population and for insulin-naive participants. The stability of HGI over time was assessed using participants’ mean HGI and HGI tertile based on the baseline cut points, over time, at baseline, 12 and 24 months. Outcomes comprised HGI as a predictor of the risk of MACE; HGI as a time-varying covariate as a predictor of the risk of MACE; HGI compared with baseline HbA1c as a predictor of the risk of MACE; and HGI and HbA1c as predictors of the risk of severe hypoglycemia.
Deriving HGI from the HbA1c versus FPG regression equation
Only participants with a recorded FPG and HbA1c measurement at baseline at the same visit were included in this analysis. As the primary analysis revealed no differences in composite three-point MACE between participants treated with degludec versus IGlar U100,20 study participants in the two arms were combined in this post hoc analysis of HGI.
Baseline FPG and HbA1c data were used to estimate the linear relationship between FPG and HbA1c in the study population. Predicted HbA1c was calculated by inserting the corresponding FPG value into the linear regression equation (HbA1c = 0.01313 FPG (mg/dL)+6.17514). HGI was calculated by subtracting the predicted HbA1c from the observed HbA1c; the population was then divided into low, moderate or high HGI tertiles based on these calculated values. When HGI tertile was assessed over time, the tertile cut points based on the whole trial population at baseline were used.
For analyses assessing the insulin-naive population, a separate model was developed based only on these participants. Predicted HbA1c was based on an insulin-naive population-specific linear regression equation (HbA1c = 0.0156 FPG (mg/dL)+5.7688), with HGI tertile points specific to the insulin-naive population; results reported for insulin-naive participants are based on this model unless otherwise specified.
Statistical analysis
Baseline characteristics in the whole trial population were summarized descriptively for participants in each HGI tertile. Correlation between HGI calculated based on FPG and based on self-measured blood glucose (SMBG) was determined using Pearson’s correlation coefficient. Stability of HGI was summarized descriptively and was also determined graphically by plotting mean HGI at baseline, 12-month and 24-month follow-up for the whole trial population, each HGI tertile and the insulin-naive participants at baseline. Furthermore, individual HGI curves were plotted, along with the tertile mean, for 60 randomly selected participants in the whole trial population and the insulin-naive group.
Kaplan−Meier curves were used to compare the distribution of time to first MACE or severe hypoglycemic event in both the whole trial population and insulin-naive participants between the three tertiles and by baseline HbA1c. The difference in the rate of events between the three tertiles was estimated using HRs, 95% CIs and p values, generated by Cox regression with treatment as the sole covariate exchanged with HGI tertile. P values were based on a type 3 test for the factor. The same methods were used to estimate differences in time to events between baseline HbA1c groups; time to events adjusted for baseline HGI tertile and baseline HbA1c groups; and time to first MACE between HGI tertiles with HGI as a time-varying covariate.
Results
Study population
Of the primary DEVOTE trial population (n=7637), 16.1% of participants (n=1228) were not using insulin at baseline (insulin naive). In this secondary analysis, 7486 participants had sufficient data recorded at baseline to be included, 1205 (16.1%) of whom were insulin naive. Baseline characteristics of participants by HGI tertile are presented in table 1, with marked variation between subgroups observed across a number of characteristics. On average, participants in the high HGI tertile population were younger; 56.6% of participants were <65 years of age at baseline compared with 43.0% and 45.4% in the low and moderate tertiles, respectively. Additionally, more participants in the high HGI tertile were female, Black or African American, or Hispanic or Latino, than in the moderate or low HGI tertiles. Although blood pressure and pulse rate were similar, differences between subgroups were observed in other risk factors for CV events; mean low-density lipoprotein cholesterol and triglyceride levels were higher in the high HGI tertile compared with the low and moderate HGI group. Participants who were insulin naive at baseline were evenly distributed across the HGI tertiles; however, more participants in the low HGI tertile were treated with short-acting insulin at baseline (49.3% in the low tertile vs 44.2% and 44.6% in the moderate and high tertiles, respectively).
Baseline characteristics of DEVOTE participants by baseline HGI tertile
HGI and glycemic parameters
A linear regression model was used to calculate predicted HbA1c from baseline FPG and HbA1c data, as shown in online supplemental figure S1A and B, which was in turn used to calculate HGI (observed minus predicted HbA1c). HGI calculated from FPG was shown to be highly correlated with HGI calculated from SMBG at 24 months, with Pearson’s correlation coefficient of 0.82, p<0.0001 (online supplemental figure S1C). The HGI cut point for participants in the low HGI tertile was ≤−0.680 (n=2493); for the moderate HGI tertile −0.680 to <0.345 (n=2498); and for the high HGI tertile ≥0.345 (n=2495). A narrow distribution of HbA1c level was observed in the low and moderate tertiles, while a wider distribution was seen among participants in the high HGI tertile (online supplemental figure S1D). Distribution of FPG was similar between tertiles (online supplemental figure S1D).
Supplemental material

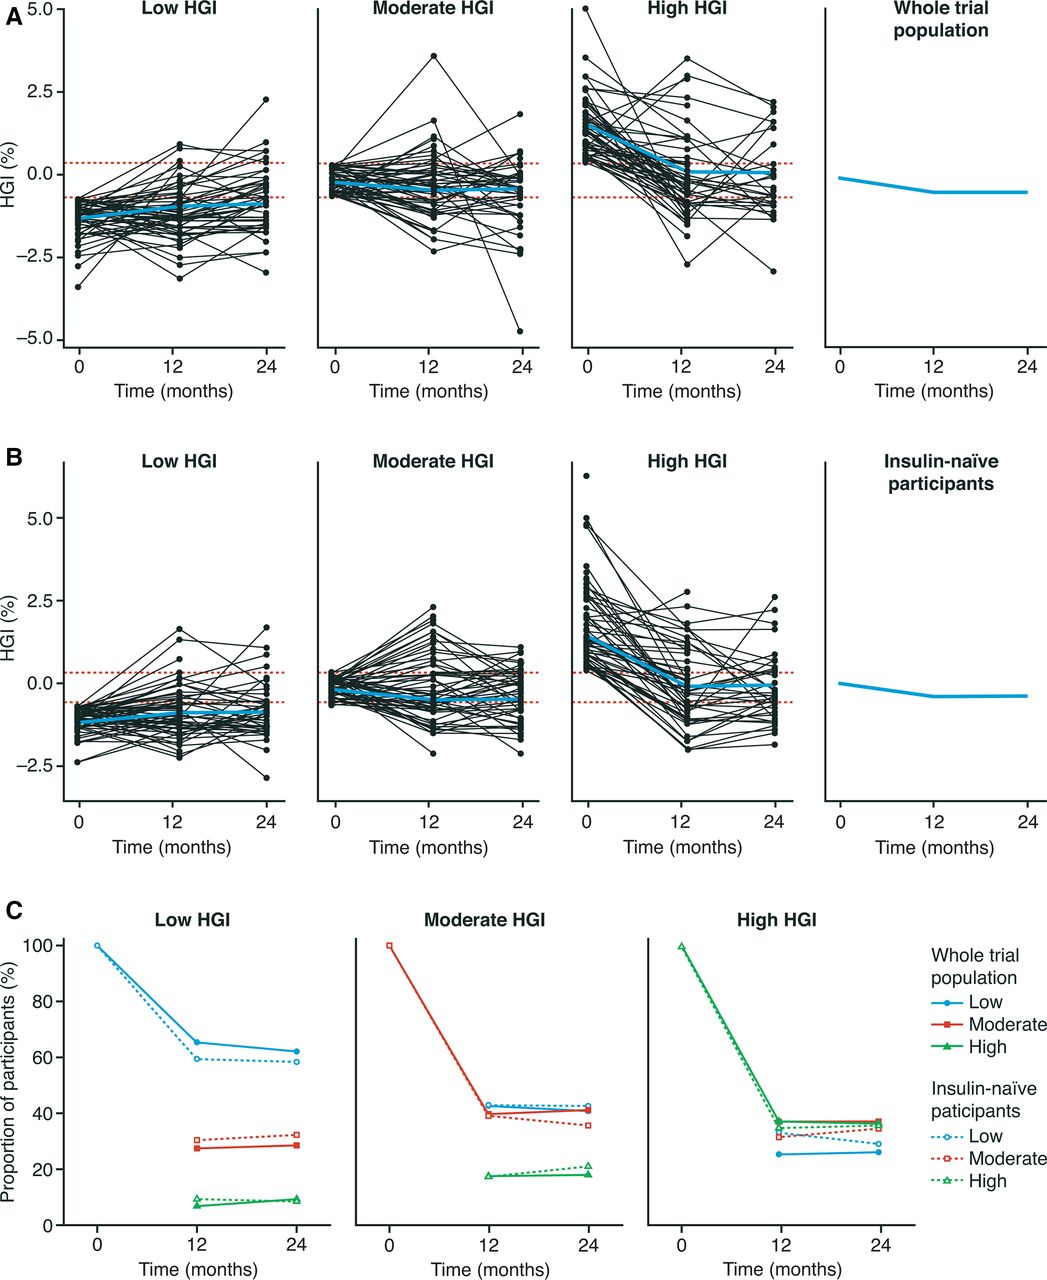
HGI variability over time in the whole trial population and in insulin-naive participants. (A) HGI variability over the trial period in the whole trial population. Data are mean±SEM. Red lines represent the boundaries of each HGI tertile. For HGI tertiles, black lines represent a random sample of 60 participants; blue lines represent a mean of the whole trial population in each tertile. (B) HGI variability over the trial period in insulin-naive participants. Data are mean±SEM. Red lines represent the boundaries of each HGI tertile. For HGI tertiles, black lines represent a random sample of 60 participants; blue lines represent a mean of the insulin-naive participants in each tertile. (C) Migration in HGI tertile groups over the trial period in the whole trial population and in insulin-naive participants. Data are observed proportions. HGI, hemoglobin glycation index.
HGI stability
As demonstrated in figure 1, HGI remained relatively stable at a population level over 24 months after trial entry among the whole trial population. However, a decrease in mean HGI appeared to occur largely within the first 12 months, before stabilizing; this was mediated primarily by a corresponding decrease in mean HGI in the high HGI tertile over this period, with that of the low and moderate tertiles remaining largely unchanged (figure 1A).
In the first 12 months, participants in all three baseline HGI tertiles frequently migrated between tertiles based on the baseline cut points (figure 1A and C; online supplemental table S1). Of DEVOTE participants in the low HGI tertile at baseline, 27.4% had migrated to the moderate HGI tertile at 12 months and 7.0% to the high HGI tertile. Correspondingly, 42.8% and 17.5% of those in the moderate HGI tertile at baseline migrated to the low HGI and high HGI tertiles at 12 months, respectively; in the high HGI tertile, 37.1% migrated to the moderate HGI and 25.5% to the low HGI tertiles. As demonstrated in figure 1A, these early changes appeared to be driven by relatively small changes in HGI, and HGI tertiles had stabilized at 24-month follow-up in all three subgroups.
Similar trends in HGI variability were observed with insulin initiation in insulin-naive study participants (figure 1B; online supplemental table S1). Using a regression model and tertiles specific to the insulin-naive subgroup, a slight decrease in mean HGI was observed over the first 12 months, which stabilized by 24 months. Again, this also appeared to be mediated by changes in HGI in the highest HGI tertile for insulin-naive patients, with relatively little change in the moderate and low HGI tertiles (figure 1B). Similarly, participants frequently changed HGI tertile in the first 12 months, with tertiles subsequently stabilizing at 24 months, following the trend observed in the whole trial population (figure 1C; online supplemental table S1). The same trends in mean HGI and HGI tertile variability were seen when the whole trial population prediction model was applied to insulin-naive participants.
HGI as a predictor of MACE
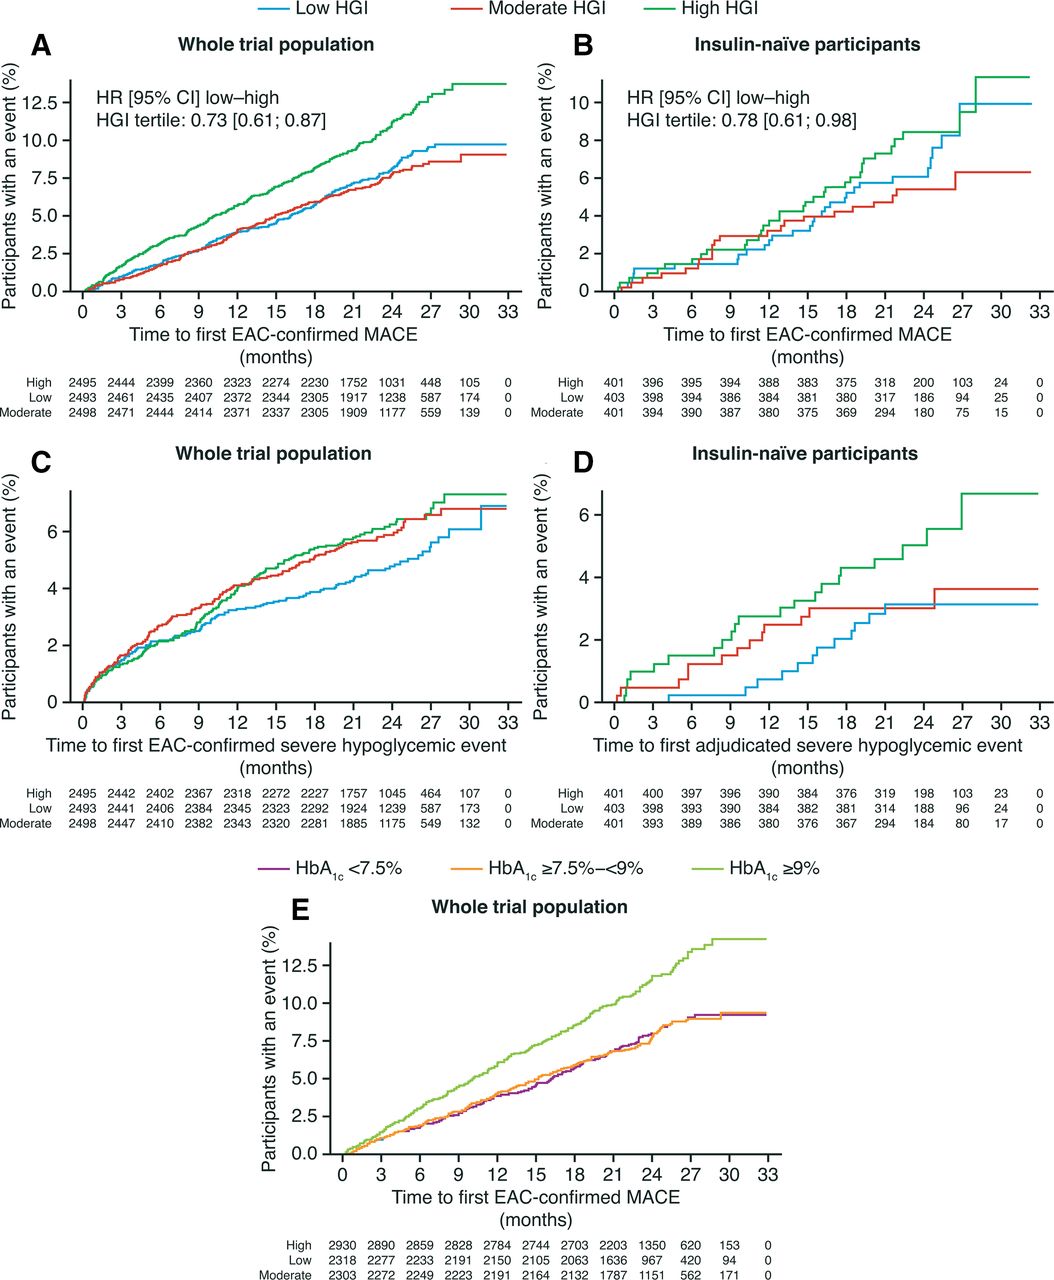
HGI was assessed as a predictor of MACE risk, with significant differences observed between groups (p<0.0001, figure 2A); participants in the high HGI tertile at baseline were at higher risk of MACE when compared with the moderate and low HGI tertiles (low vs high tertiles, HR: 0.73 (0.61 to 0.87)95% CI and moderate vs high tertiles, HR: 0.67 (0.56 to 0.81)95%CI, respectively, online supplemental table S2). Risk of MACE in the moderate and high baseline HGI tertiles did not differ. As there was some variability of HGI throughout the trial, we analyzed whether HGI as a time-varying covariate was a stronger predictor for MACE than HGI at baseline; however, in a model including both, p values showed that only HGI at baseline, and not as a time-varying covariate, predicted MACE (online supplemental table S3).
Kaplan–Meier curves for time to first MACE and severe hypoglycemia. (A) Time to first occurrence of EAC-confirmed MACE across the whole trial population; (B) time to first occurrence of EAC-confirmed MACE in insulin-naive participants; (C) time to first EAC-confirmed severe hypoglycemic event in the whole trial population; (D) time to first adjudicated severe hypoglycemic event in insulin-naive participants; (E) time to first occurrence of EAC-confirmed MACE by baseline HbA1c in the whole trial population. Numbers of patients at each time point are shown under each graph. EAC, event adjudication committee; HbA1c, glycated hemoglobin A1c; HGI, hemoglobin glycation index; MACE, major adverse cardiovascular event.
Few MACE occurred in insulin-naive participants during the trial; the trends observed in the Kaplan–Meier curves were consistent with the overall DEVOTE trial population, but were not statistically significant in insulin-naive participants (figure 2B).
HGI versus HbA1c as a predictor of MACE
As shown in figure 2E and table 2, participants with an HbA1c level ≥9% (75 mmol/mol) appeared to have a higher risk of MACE than participants with lower baseline HbA1c levels (baseline HbA1c ≥9% vs ≥7.5%−<9%, HR: 1.52 (1.28 to 1.82)95% CI; p<0.0001). When baseline HbA1c level was included within a model with HGI, HGI was no longer a significant predictor of time to first MACE (table 2).
Time to first occurrence of MACE,adjusted for baseline HGI tertile and HbA1c in the whole trial population
HGI and HbA1c as predictors of severe hypoglycemia
Despite a trend toward a reduced risk of severe hypoglycemic events in the low HGI tertile compared with those in the moderate and high HGI tertile (low vs high HGI tertiles, HR: 0.78 (0.61 to 0.98)95% CI; low vs moderate HGI tertiles, HR: 0.81 (0.64 to 1.03)95% CI online supplemental table S2), Kaplan–Meier curves demonstrated no significant difference between tertiles (p=0.0911, figure 2C). Similar nonsignificant results were observed among insulin-naive participants (p=0.1668, figure 2D). Among the whole trial population, higher HbA1c group at baseline was not a significant predictor of severe hypoglycemia in isolation (HbA1c <7.5% vs ≥7.5–<9% and ≥7.5–<9% vs ≥9%, p=0.34) nor when included within a model with HGI (p=0.75).
Discussion
Previous studies have demonstrated that some individuals have higher or lower HbA1c than predicted from PG measurement.13 16 The clinical significance of this finding, and the clinical utility of a measure of this difference, HGI, has long been debated.22 Indeed, even the proper way to calculate HGI has been a subject of controversy. When initially conceptualized, the predicted HbA1c was calculated based on observed mean blood glucose (MBG) over a period. However, Hempe et al1 later demonstrated that HGI derived from all available glucose meter data was highly significantly correlated with HGI calculated using pre-breakfast measurements alone. As such, they reasoned that a single FPG measurement, which would be easier to obtain and potentially more applicable in clinical practice, might be sufficient for HGI calculation. A similar technique is employed to calculate glycation gap (GG), except that the predicted HbA1c is calculated using a single fructosamine value instead of FPG.23 Fructosamine, though a single measurement, represents average glucose over a period of 3 weeks and thus inherently captures glucose variability. However, as HGI and GG are highly positively correlated, the cardiovascular outcomes trials that investigated the ability of HGI to predict clinical outcomes in participants with T2D at high risk for cardiovascular events used a single FPG value to determine HGI.13 16 In this analysis, in keeping with previous studies, we calculated HGI using a single FPG measurement in the DEVOTE population to assess first whether HGI was robust to initiation of insulin and whether HGI was predictive of adverse events.
The hypothesis explored by previous authors that variation in HGI may be due to biological differences is supported by the baseline characteristics in DEVOTE;10 12 more Black or African American, and Hispanic or Latino participants were in the high HGI tertile compared with the low HGI tertile, with conversely more white participants in the low compared with the high HGI tertile. Similarly, minority groups were disproportionately represented in the high HGI tertiles in the Action to Control Cardiovascular Risk in Diabetes (ACCORD) trial and in the Action in Diabetes and Vascular Disease: Preterax and Diamicron Modified Release Controlled Evaluation (ADVANCE) trial. These findings suggest that race/ethnicity and perhaps genetic factors may influence hemoglobin glycation. While these racial–ethnic differences in HGI are evident, whether these differences are genetic or are instead associated with socially mediated risk remains to be understood. Moreover, some controversy exists as to whether HGI is truly determined by differences in glycation. Riddle et al suggest instead that HGI is mediated by postprandial excursions and identifies individuals who require treatments that target daytime hyperglycemia.24 However, this notion is not supported by the HGI findings in the Diabetes Control and Complications Trial (DCCT), where individual glycemic variation in participants with T1D had a minimal impact on HGI.14 Consistently, in a recent analysis demonstrating a positive correlation between HGI calculated by either FPG or 72-hour continuous glucose monitoring (CGM) in participants with T2D, a significant difference between HbA1c levels was observed even between people with similar MBG as calculated by CGM, suggesting that postprandial glucose levels are unlikely to be a major source of HGI variation.25 Regardless of mechanism, we demonstrate that HGI identifies a group of individuals whose HbA1c remains elevated despite targeted lowering of their FPG with basal insulin.
It has been hypothesized that antihyperglycemic medications may affect HGI calculated by a single FPG; specifically, by lowering FPG to a greater extent than glucose levels throughout the rest of the day, basal insulin treatment should result in lower FPG levels than the average blood glucose (BG) in insulin-treated individuals.24 In this post hoc analysis, at a population level, HGI was relatively stable over the whole trial period. However, at an individual level, changes in HGI occurred in the initial 12-month trial entry with associated insulin initiation or titration, resulting in many participants changing HGI tertile. This stabilized at 24 months. In participants who were insulin naive, similar trends were seen with the introduction of exogenous insulin therapy. The implications of this are not clear. This initial variability may simply have reflected a data effect of regression toward the mean; may have resulted from relatively small changes in HGI corresponding to tertile migration due to narrow boundaries; or equally, may have owed to a true effect of insulin therapy on HGI stability. While this finding calls into question the utility of HGI calculated from a single FPG, it does not negate that HGI may have important clinical implications. Instead, this finding highlights the necessity to identify the proper way to measure HGI and the appropriate timing of the calculation. In this analysis, we found that high HGI predicts adverse cardiovascular events in the DEVOTE population. This finding is not surprising, as HbA1c is associated with increased microvascular and macrovascular risk in epidemiological analysis and HGI is mathematically derived from HbA1c.13 16 These findings are consistent with previous studies. For example, high HGI was associated with increased microvascular complications compared with low HGI in the DCCT,14 and other studies in patients with T2D have found a higher risk of adverse outcomes, including CVD and mortality, with high HGI or GG.13 15 16 26–30 In the ACCORD trial, high HGI was associated with greater risk for cardiovascular events when compared with low HGI,13 may have been a predictor of mortality,31 and in contrast to DEVOTE, was also associated with high risk of severe hypoglycemia.13 High HGI was also predictive of macrovascular and microvascular complications in ADVANCE16; intensive glucose control lowered the mortality risk for patients with high HGI exclusively, unlike ACCORD, wherein it was associated with improved outcomes in the low and moderate HGI groups only.13
In the DCCT, among the low MBG group, only those with high HGI were at risk of retinopathy, suggesting a residual high risk for microvascular events regardless of glycemic control.14 Multiple studies have also demonstrated that high HGI is associated with higher risk of atherosclerosis, kidney disease and hepatic steatosis in individuals without diabetes.29 30 32 33 These data suggest that HGI has predictive value of adverse outcomes even in the absence of hyperglycemia, though the mechanism of increased risk with high HGI is not understood.
As was shown in ADVANCE, our findings support that HbA1c is a better predictor of MACE than HGI; HGI was no longer predictive of MACE when included in a model with HbA1c, suggesting that the latter was a stronger predictive factor and that HGI may add little to the predictive power for outcomes to HbA1c when used in conjunction with HbA1c. This raises the question of the clinical utility of HGI calculated based on a single FBG in patients at high risk of CVD with an average diabetes duration of >16 years.20 It remains unknown if HGI calculated at the onset of diabetes would be predictive of long-term outcomes. As such, evaluation of whether HGI measured at the onset of T2D, calculated either by FPG or MBG prior to initiation of antihyperglycemic agents, predicts long-term outcomes may be warranted. Should high glycation index indicate poorer cardiovascular outcomes, as has been previously shown, more aggressive primary prevention strategies may be employed.
Conflicting data from DCCT, ACCORD, ADVANCE and now DEVOTE about the predictive nature of HGI are likely mediated by difference in trial design and analysis. Cross-trial comparison is made challenging by the use of trial-specific HGI tertiles rather than absolute HGI boundaries for grouping participants; moreover, the linear regression equations used to calculate HGI are specific to the trial population and further complicate generalizing and comparing results. In ACCORD, for example, the trial population-based linear regression equation (HbA1c = 0.009 FPG (mg/dL)+6.8) differed compared with the DEVOTE trial population (HbA1c = 0.01313 FPG (mg/dL)+6.17514), suggesting that on average, the ACCORD population had a higher HbA1c at a given FPG. HGI tertile cut points in ACCORD were ≤−0.520, –0.520 to 0.202 and >0.202 for the low, moderate and high tertiles, respectively, reflecting these population differences.13 The participants in DEVOTE represent a cohort with advanced diabetes and at high CV risk. Future analysis of outcomes by HGI in a wider patient population may be warranted to generate a regression equation more reflective of, and generalizable to, the spectrum of patients with diabetes. Calculation of HGI at the onset of diabetes would eliminate medication as a confounder.
The dichotomous effect of intensive treatment on cardiovascular outcomes in participants with high HGI in ACCORD and ADVANCE may be related to differences in trial design and hypoglycemia risk. In DEVOTE, neither HGI nor HbA1c were predictive of severe hypoglycemia when assessed in isolation, or when included together within a model, as might be expected given the close relationship between the two metrics. Of the three cardiovascular outcomes trials examined for HGI relationships, only ACCORD has shown increased risk of severe hypoglycemia in intensively treated participants with high HGI. Treatment intensification in ACCORD was primarily driven by HbA1c >6% and discounted self-monitored glucose values except at extremes. In DEVOTE and ADVANCE, titration of glucose-lowering medications was driven by a more balanced approach focused on FPG. Thus, the design of DEVOTE and ADVANCE may have protected participants with high HGI against increased hypoglycemia risk by focusing on glucose monitoring results to determine titration.
Beyond the limits of the generalizability of the DEVOTE study population, there were other limitations of this secondary analysis. The pragmatic design used in DEVOTE to optimize trial retention and recording of the primary endpoint meant that the number of available FPG values was limited. Additionally, the median follow-up time in DEVOTE was an intermediate duration of 2 years, so long-term trends in HGI variability cannot be established.
Published studies examining HGI do not currently address whether additional interventions to lower HGI, HbA1c or other risk factors can reduce the residual risk associated with high HGI. Suggestions from ACCORD and ADVANCE provide conflicting indications of where intensive glycemic control is associated with improvements in cardiovascular outcomes. Clarifying this issue is necessary to establish the clinical utility of HGI in practice. Further examination into existing data sets should be undertaken regarding whether newer antihyperglycemic agents, like sodium-glucose cotransporter-2 inhibitors and glucagon-like peptide 1 receptor agonists, provide unique benefits in people with high HGI given their apparent glucose-independent benefits on cardiorenal risk.
In summary, these results demonstrate that HGI exhibits initial variability with insulin titration or initiation, stabilizing at a population level over a long follow-up period. Baseline HGI showed a trend toward association with baseline microvascular disease markers and a significant association with prospective cardiovascular risk; moreover, these results support the initial findings of ADVANCE that HGI is not a better predictor of cardiovascular outcomes than HbA1c in a patient population with advanced diabetes at high risk for cardiovascular events. Further research is needed to clarify whether calculation of HGI from a single FPG is truly concordant with MPG calculated from CGM or SMBG, to elucidate the mechanisms underlying population-level differences in HGI, to assess the clinical utility of HGI compared with HbA1c and to determine the effect of interventions targeting HGI on cardiovascular risk.
Data availability statement
Data are available upon reasonable request. The datasets generated during and/or analyzed during the current study are available from the corresponding author on reasonable request.
Ethics statements
Patient consent for publication
Ethics approval
The protocol was approved by independent ethics committees or institutional review boards at each center; written informed consent was obtained from each patient before any trial-related activities were undertaken. JBB was a signatory investigator. At his site, the University of North Carolina at Chapel Hill Institutional Review Board approved study 14-0081 through a reliance agreement with the Sterling IRB (Atlanta, GA) with reference number 4375-212C.
Acknowledgments
The authors would like to acknowledge Trine J Abrahamsen, PhD, for her work on the initial data analysis. Medical writing and editorial support, under the guidance of the authors, were provided by Chloe Harrison, Jane Blackburn and Beverly La Ferla from Ashfield MedComms, an Ashfield Health company, funded by Novo Nordisk.
References
Supplementary materials
Supplementary Data
This web only file has been produced by the BMJ Publishing Group from an electronic file supplied by the author(s) and has not been edited for content.
Footnotes
Contributors All authors fulfill the ICMJE criteria for authorship, take responsibility for the integrity of the work as a whole and have given final approval for the version to be published. KRK is the guarantor of this work.
Funding The primary trial was supported by Novo Nordisk and grants (UL1TR001111 and UL1TR002489 to Dr Buse) from the National Institutes of Health (NIH). This secondary analysis was supported by Novo Nordisk A/S.
Competing interests KRK was supported in this work from the University of North Carolina, Department of Medicine and School of Medicine Physician Scientist Training Programs; EF has participated in advisory panels for AstraZeneca, Bioton, Boehringer Ingelheim and Novo Nordisk and has received honoraria for serving on speakers’ bureaus for AstraZeneca, Bioton, Boehringer Ingelheim, Eli Lilly, Merck, Merck Sharp; SM has received personal fees from Abbott Vascular, Novo Nordisk, University of Oxford, AstraZeneca and Bristol-Myers Squibb; and research support from Novo Nordisk, The Medicines Company and Terumo Medical; TRP has received research support from Novo Nordisk and AstraZeneca and personal fees as a consultant from Adocia, Arecor, AstraZeneca, Eli Lilly, Novo Nordisk and Sanofi. TRP is also the Chief Scientific Officer of CBmed (Center for Biomarker Research in Medicine), a public-funded biomarker research company; REP reports grants from Hanmi Pharmaceutical Co; grants from Janssen; consulting fees from Merck; grants, speaker fees and consulting fees from Novo Nordisk; consulting fees from Pfizer; grants from Poxel SA; grants and consulting fees from Sanofi; consulting fees from Scohia Pharma Inc; and consulting fees from Sun Pharmaceutical Industries. REP’s services were paid for directly to AdventHealth, a nonprofit organization; AG is a full-time employee of, and holds stock in, Novo Nordisk A/S; KK is a full-time employee of, and holds stock in, Novo Nordisk A/S; JBB reports contracted consulting fees and travel support for contracted activities, which are paid to the University of North Carolina, by Adocia, AstraZeneca, Eli Lilly, Intarcia Therapeutics, MannKind, Novo Nordisk, Sanofi, Senseonics and vTv Therapeutics; he reports grant support from AstraZeneca, Dexcom, Eli Lilly, Intarcia Therapeutics, Johnson & Johnson, Lexicon, 477 NovaTarg, Novo Nordisk, Sanofi, Theracos, Tolerion and vTv Therapeutics; he has received fees for consultation from Anji Pharmaceuticals, AstraZeneca, Boehringer Ingelheim, Cirius Therapeutics Inc, Dasman Diabetes Institute (Kuwait), Eli Lilly, Fortress Biotech, Glyscend, Janssen, Mellitus Health, Moderna, Pendulum Therapeutics, Praetego, Stability Health and Zealand Pharma; he holds stock/options in Mellitus Health, Pendulum Therapeutics, PhaseBio, Praetego and Stability Health; and he is supported by grants from the National Institutes of Health, ADA, JDRFI and PCORI.
Provenance and peer review Not commissioned; externally peer reviewed.
Supplemental material This content has been supplied by the author(s). It has not been vetted by BMJ Publishing Group Limited (BMJ) and may not have been peer-reviewed. Any opinions or recommendations discussed are solely those of the author(s) and are not endorsed by BMJ. BMJ disclaims all liability and responsibility arising from any reliance placed on the content. Where the content includes any translated material, BMJ does not warrant the accuracy and reliability of the translations (including but not limited to local regulations, clinical guidelines, terminology, drug names and drug dosages), and is not responsible for any error and/or omissions arising from translation and adaptation or otherwise.