Article Text

Abstract
Introduction A Swedish data-driven cluster study identified four distinct type 2 diabetes (T2D) clusters, based on age at diagnosis, body mass index (BMI), hemoglobin A1c (HbA1c) level, and homeostatic model assessment 2 (HOMA2) estimates of insulin resistance and beta-cell function. A Danish study proposed three T2D phenotypes (insulinopenic, hyperinsulinemic, and classical) based on HOMA2 measures only. We examined these two new T2D classifications using the Danish Centre for Strategic Research in Type 2 Diabetes cohort.
Research design and methods In 3529 individuals, we first performed a k-means cluster analysis with a forced k-value of four to replicate the Swedish clusters: severe insulin deficient (SIDD), severe insulin resistant (SIRD), mild age-related (MARD), and mild obesity-related (MOD) diabetes. Next, we did an analysis open to alternative k-values (ie, data determined the optimal number of clusters). Finally, we compared the data-driven clusters with the three Danish phenotypes.
Results Compared with the Swedish findings, the replicated Danish SIDD cluster included patients with lower mean HbA1c (86 mmol/mol vs 101 mmol/mol), and the Danish MOD cluster patients were less obese (mean BMI 32 kg/m2 vs 36 kg/m2). Our data-driven alternative k-value analysis suggested the optimal number of T2D clusters in our data to be three, rather than four. When comparing the four replicated Swedish clusters with the three proposed Danish phenotypes, 81%, 79%, and 69% of the SIDD, MOD, and MARD patients, respectively, fitted the classical T2D phenotype, whereas 70% of SIRD patients fitted the hyperinsulinemic phenotype. Among the three alternative data-driven clusters, 60% of patients in the most insulin-resistant cluster constituted 76% of patients with a hyperinsulinemic phenotype.
Conclusion Different HOMA2-based approaches did not classify patients with T2D in a consistent manner. The T2D classes characterized by high insulin resistance/hyperinsulinemia appeared most distinct.
- classification
- clusters
- cohort
- type 2 diabetes
Data availability statement
Data may be obtained from a third party and are not publicly available. More information about the DD2 cohort can be found at the DD2 website: www.dd2.nu. The DD2 project has a Steering Group that strongly encourages national and international collaboration. Interested researchers can contact Professor Kurt Højlund at Kurt.Hoejlund@rsyd.dk. According to Danish data protection legislation, linked individual-level register data analyzed in the study cannot be shared or made publicly available. Register data are stored at the Danish Health Data Authority and can be made available for research on reasonable request and with permission from the Danish Data Protection Agency.
This is an open access article distributed in accordance with the Creative Commons Attribution Non Commercial (CC BY-NC 4.0) license, which permits others to distribute, remix, adapt, build upon this work non-commercially, and license their derivative works on different terms, provided the original work is properly cited, appropriate credit is given, any changes made indicated, and the use is non-commercial. See: http://creativecommons.org/licenses/by-nc/4.0/.
Statistics from Altmetric.com
Significance of this study
What is already known about this subject?
A Swedish cluster analysis has identified four distinct type 2 diabetes (T2D) clusters based on age at diagnosis, body mass index, HbA1c, and HOMA2 estimates of insulin resistance and beta-cell function.
A Danish study has suggested three T2D phenotypes based only on HOMA2 measures: insulinopenic, hyperinsulinemic, and classical.
What are the new findings?
Using an identical data-driven cluster analysis in the Danish Centre for Strategic Research in Type 2 Diabetes cohort (n=3529 patients) and forcing k=4 clusters, we could replicate the four Swedish T2D clusters.
Nevertheless, an analysis open to alternative k-values suggested the existence of three rather than four clusters.
Neither the four nor the three clusters overlapped substantially with the Danish phenotype classification. The diabetes classes characterized by high insulin resistance/hyperinsulinemia showed the largest overlap and appeared most distinct.
How might these results change the focus of research or clinical practice??
Subclassification of patients with T2D at diagnosis may associate with individual prognosis and treatment. Our results suggest that there is a need to further refine T2D subclassifications.
Introduction
Type 2 diabetes (T2D) is the most frequent type of diabetes (~95% of patients)1 and is a heterogeneous disease. A recent Swedish data-driven cluster analysis of individuals with newly diagnosed diabetes in the Swedish All New Diabetics in Scania (ANDIS) cohort suggested a classification encompassing four distinct T2D clusters.2 These were labelled severe insulin-deficient (SIDD), severe insulin-resistant diabetes (SIRD), mild obesity-related diabetes (MOD), and mild age-related diabetes (MARD). A fifth cluster was labeled severe autoimmune diabetes (SAID) and composed of individuals with presence of glutamic acid decarboxylase antibodies (GADA) (ie, type 1 diabetes and latent autoimmune diabetes of adults). The four T2D clusters were identified based on GADA negativity and a data-driven de novo cluster analysis based on five variables: age at diabetes diagnosis, body mass index (BMI), hemoglobin A1c (HbA1c), and homeostatic model assessment 2 (HOMA2) estimates of insulin resistance (HOMA2-IR) and beta-cell function (HOMA2-B).
Based solely on HOMA2-sensitivity (HOMA2-S) and HOMA2-B measurements, a Danish study of recent-onset T2D patients in the Danish Centre for Strategic Research in Type 2 Diabetes (DD2) cohort proposed an easy-to-use classification.3 The investigators proposed the existence of three T2D phenotypes, labelled insulinopenic, classical, and hyperinsulinemic diabetes.3
Features common to the two proposed T2D classifications2 3 were clusters and phenotypes characterized by distinct and different clinical characteristics including heritability and genetics, as well as differential risk of diabetes complications.2–4 Thus, allocation of patients to more refined T2D classes at time of diabetes diagnosis may have the potential for more individualized diabetes treatment in the future, as well as for individualized strategies for prevention of complications.
In the current study, we investigated whether the four identified Swedish data-driven T2D clusters could be replicated in the Danish DD2 cohort. We also performed a de novo data-driven analysis open to an alternative number of clusters, and then compared the data-driven clusters to the Danish phenotypes, with respect to distributions and clinical characteristics including heritability and complications.
Methods
Setting
The DD2 project5 has enrolled newly or recently diagnosed T2D patients since November 2010. Enrollment takes place in hospital specialist outpatient clinics or general practitioners’ offices (53% and 47%, respectively) throughout Denmark. Denmark has a free tax supported healthcare system.6 7 All individuals aged ≥18 years with new clinically diagnosed T2D in Denmark after 1 January 2009, with or without initiation of glucose-lowering therapy, are eligible for inclusion in the DD2 cohort and biobank (online supplemental table S1). At enrollment, interview and clinical examination data for each patient are recorded, and blood and urine samples are obtained.5 The unique civil personal registration number assigned to all Danish citizens is used to link the DD2 research database to nationwide Danish health registries. These include the Danish National Patient Registry, which contains a complete hospital history including all hospital-diagnosed diabetes complications;7 8 the Danish National Health Service Prescription Database, which contains information on filled prescriptions;9 and the Danish Civil Registration System, which contains information on vital status and migration.10 For a subcohort of DD2 patients (~2/3 of the cohort), additional detailed clinical data including HbA1c levels and BMI are linked from the Danish Diabetes Database for Adults (online supplemental figures S1 and S2).11
Supplemental material
Additional information on the DD2 project is available in a publication12 and at www.dd2.nu.
Study cohort
The source population included the first 5987 consecutively enrolled DD2 participants from November 2010 to February 2015.
The study cohort was restricted to persons with at least one measure of each of the variables used in the original Swedish cluster analysis:2 age at diabetes diagnosis, BMI, HbA1c, fasting serum C-peptide, and fasting plasma glucose, as well as GADA. As in the Swedish study, we excluded those with extreme outliers (ie, values more than 5 SDs from the mean, n=78). We also excluded patients with secondary diabetes (n=43), rare types of diabetes (n=7), for example, Cushing’s disease (online supplemental table S2), and glucocorticoid-associated diabetes (n=109). In addition, we excluded GADA-positive patients (n=60), defined as those with a GADA titer ≥32 IU/mL.2
Biomarkers and cluster variables
Testing of GADA, fasting serum C-peptide, and fasting plasma glucose biomarkers was performed in the ISO 15189 accredited laboratory at University Hospital of Southern Denmark, Vejle, using the blood samples stored after DD2 enrollment (ie, median 1.5 years after diabetes diagnosis date). The analysis methods have been described in detail.3 We used the HOMA calculator (University of Oxford, Oxford, UK) to calculate HOMA2 measures based on fasting serum C-peptide and fasting plasma glucose concentrations. The diabetes diagnosis date (index date) was defined as the date of the first indication of diabetes from any available data source including date of first prescription redemption of a glucose-lowering drug (see online supplemental table S2 for details). Age was calculated based on this date. HbA1c and BMI values registered closest to this date were applied in the analyses (online supplemental figure S2).
These variables were used to classify patients using the k-means cluster method.
T2D phenotypes
In addition to the k-means cluster method, patients in the DD2 cohort were classified according to HOMA2 measures into an insulinopenic phenotype (high insulin sensitivity, low beta-cell function), a classic phenotype (low insulin sensitivity, low beta-cell function), and a hyperinsulinemic phenotype (low insulin sensitivity, high beta-cell function), as previously described.3 High and low insulin sensitivity and beta-cell function were defined by the median HOMA2-S and HOMA2-B values in a general population sample with normal glucose tolerance3 (online supplemental table S2).
A few individuals (n=15) had high insulin sensitivity and high beta-cell function. These were excluded in the previous DD2 phenotype study.3 In accordance with inclusion and exclusion criteria in the original Swedish cluster study, these 15 individuals were included in our cluster study.
Statistical analysis
De novo cluster analyses
All our data-driven cluster analyses were based on the same cluster variables included in the data-driven Swedish k-means cluster analysis: age, BMI, HbA1c, HOMA2-IR, and HOMA2-B. We also applied similar cluster rules.2 Thus, all values were centered to a mean value of 0 and an SD of 1. The cluster analyses were performed separately for males and females to account for any differences by biological sex, and the clusters then were combined. We used the kmeansruns function (runs=100) in the fpc package (V.2.2.8) in R to perform the de novo k-means clustering. We resampled the dataset 2000 times and computed Jaccard similarities to the original dataset in order to evaluate clusterwise stability.13
We performed the following de novo cluster analyses:
Replication of the Swedish T2D clusters, forced k-value=4
As one of our main aims was to replicate the Swedish T2D clusters in the Danish cohort, we did the cluster analysis forcing a k-value of four (ie, four clusters) as in the Swedish study. Cluster labels were assigned by comparing cluster variable means to those in the Swedish study.
New DD2 clusters, alternative k-value
To allow data to determine the number of clusters, rather than forcing a k-value of 4, we visually evaluated the optimal number of clusters. We selected the average silhouette method a priori because it was used in most previous diabetes cluster analyses2 14–16 and is considered the most objective method. We then reran the de novo k-means cluster analysis on the DD2 cohort using the alternative k-value. To test the robustness of the average silhouette method, we applied two commonly used alternative methods: the elbow method and the gap statistic method.
Additional analyses
We performed the following additional analyses:
Pretreatment HbA1c: we restricted the cohort to patients with available data on HbA1c prior to glucose-lowering drug initiation (if any), that is, pretreatment HbA1c. This was done to make the DD2 cohort more comparable with the Swedish ANDIS cohort, all of whose members had data on pretreatment HbA1c level. We used a k-value of 4.
DD2 enrollment date as index date: there may be a delay between the diabetes diagnosis date in clinical practice and enrolment/blood sampling for HOMA2 measurements in the DD2 cohort. We therefore performed a sensitivity analysis using the DD2 enrolment date as the index date, that is, the age at DD2 enrolment and the HbA1c and BMI values measured closest to DD2 enrolment. We used a k-value of 4.
Cluster assignment based on coordinates from the Swedish ANDIS cohort: in our main analysis, we assigned each DD2 patient to one of the four clusters based on centroids identified in the DD2 cohort (ie, de novo analysis). In addition, we replicated the four Swedish clusters by assigning each DD2 patient to the cluster in the Swedish ANDIS cohort to which each DD2 patient was most similar. All values were centered using the mean and SD observed in the ANDIS cohort, and patients were then assigned to a cluster using the centroid values from the ANDIS cohort.2
Omitting variables: we reran the main and the alternative k-value cluster analyses (de novo) while alternately omitting one variable in order to test cluster stability according to the used variables.
Characteristics of clusters
We provided characteristics for each of the four replicated Swedish clusters, for the three new alternative k-value DD2 clusters, and for the three DD2 phenotypes. If relevant, we included characteristics both as of the diabetes diagnosis date and as of the DD2 enrolment date (ie, date of HOMA2 measurement).
Patient flow across clusters
We used Sankey diagrams to compare patient flow across the clusters identified based on the different analyses, that is, from the four replicated Swedish clusters to the new alternative k-value DD2 clusters and from these two de novo cluster classifications to the T2D phenotypes. To allow comparisons with the phenotypes, we plotted HOMA2-B against HOMA2-S for each patient, marked the phenotype classification, and colored each patient by cluster allocation. Moreover, we compared the four replicated Swedish clusters identified using the de novo cluster method with those identified based on centroid/means from the ANDIS cohort.
All statistical analyses were conducted using SAS V.9.4 (SAS Institute Inc) and R V.4.0.3 (R Core Team, 2020).
Results
In total, 3825 (64%) of the 5987 patients enrolled in DD2 during the study period had data on all key cluster variables. Of these, 3529 (59%) patients were eligible for further analyses (online supplemental figure S3) (2074 males, 1455 females).
De novo cluster analyses
Replication of the four data-driven Swedish T2D clusters
The distribution of patients in the four clusters was similar for females and males. Overall, 8% of patients were in the SIDD cluster, 23% in the SIRD cluster, 26% in the MOD cluster, and 42% in the large MARD cluster (figure 1, online supplemental figure S4). The distribution of variables used for clustering showed a pattern similar to that in the Swedish ANDIS cohort. However, the mean HbA1c level was slightly lower in the SIDD cluster in the DD2 cohort (86 mmol/mol) compared with the SIDD cluster in the Swedish ANDIS cohort (101 mmol/mol). Moreover, the cluster most similar to the Swedish MOD cluster was characterized by less obesity and lower beta-cell function in the DD2 cohort compared with the ANDIS cohort (mean BMI: 32 kg/m2 vs 36 kg/m2; mean HOMA2-B: 81% vs 95%) (table 1, figure 1 and online supplemental figure S4). Overall, variables largely overlapped across the four clusters.

Patient and cluster variable distribution. (A) De novo replication of the four Swedish T2D clusters in the DD2 cohort and (B) New alternative k-value DD2 Clusters. BMI, body mass index; DD2, The Danish Centre for Strategic Research in Type 2 Diabetes Cohort; HbA1c, hemoglobin A1c; HOMA2-B, homeostatic model assessment 2 estimate of beta-cell function; HOMA2-IR, homeostatic model assessment 2 estimate of insulin resistance; MARD, mild age-related diabetes; MOD, mild obesity-related diabetes; SIDD, severe insulin-deficient diabetes; SIRD, severe insulin-resistant diabetes; T2D, type 2 diabetes.
Patient characteristics: de novo replication of the four Swedish T2D clusters in the DD2 cohort
Examination of patient characteristics showed that patients allocated to the SIRD and MARD clusters had the highest prevalence of macrovascular complications (table 1). SIRD cluster patients had the highest prevalence of kidney disease, whereas the highest prevalence of diabetic eye disease was observed in the MARD cluster. Family history of diabetes was most common among MOD cluster patients. The proportion of users of all types of glucose-lowering drugs at DD2 enrollment date was highest in the SIDD cluster.
New alternative k-value T2D clusters in the DD2 cohort
Visual evaluation (online supplemental figure S5) suggested a varying number of clusters. However, we considered a k-value of three, based on the average silhouette method, to be the optimal number of clusters. This yielded three clusters: New Cluster 1 included 433 patients (12%) and was characterized by insulin deficiency, poor glycemic control, low insulin resistance, and younger age (most similar to the SIDD cluster in ANDIS). New Cluster 2 included 1131 patients (32%) and was characterized by hyperinsulinemia, insulin resistance, and a high BMI (most similar to the SIRD cluster in the ANDIS cohort). New Cluster 3 included 1965 patients (56%). This cluster was characterized by high age and low insulin resistance (most similar to the MARD cluster in ANDIS) (table 2, figure 1 and online supplemental figure S6). Accordingly, the Sankey diagram (figure 2A) illustrates that patients allocated to the SIDD, SIRD, and MARD clusters, when forcing a k-value of four, primarily were reallocated to New Clusters 1, 2 and 3, respectively, when the cluster analysis was repeated with a k-value of three. In contrast, patients originally allocated to the MOD cluster were redistributed to all three New DD2 Cclusters, in particularly New Cluster 3, which also encompassed patients from the original MARD cluster.
Patient characteristics: New alternative k-value DD2 Clusters

Sankey diagrams showing the flow of patients between (A) the clusters identified in the de novo analysis replicating the Swedish clusters and the New DD2 Clusters; (B) the clusters identified while replicating the Swedish clusters and Danish phenotypes; (C) the New DD2 Clusters and the Danish phenotypes; and (D) the clusters identified in the de novo analysis replicating main analysis and those identified using information on centroids and means identified in the original Swedish ANDIS cohort. A total of 15 (SIDD: n=2, SIRD: n=1, MOD: n=5, MARD: n=7) individuals had high insulin sensitivity and high beta-cell function (ie, neither insulinopenic, classical, or hyperinsulinemic type 2 diabetes). In the previous DD2 phenotype study, this was considered to be HOMA2 values in the non-diabetes area, and the individuals were therefore not classified. We did not exclude these 15 individuals in our study; however, they are not shown in figure parts B and C. ANDIS, All New Diabetics in Scania; DD2, Danish Centre for Strategic Research in Type 2 Diabetes; HOMA2, homeostatic model assessment 2; MARD, mild age-related diabetes; MOD, mild obesity-related diabetes; SIDD, severe insulin-deficient diabetes; SIRD, severe insulin-resistant diabetes.
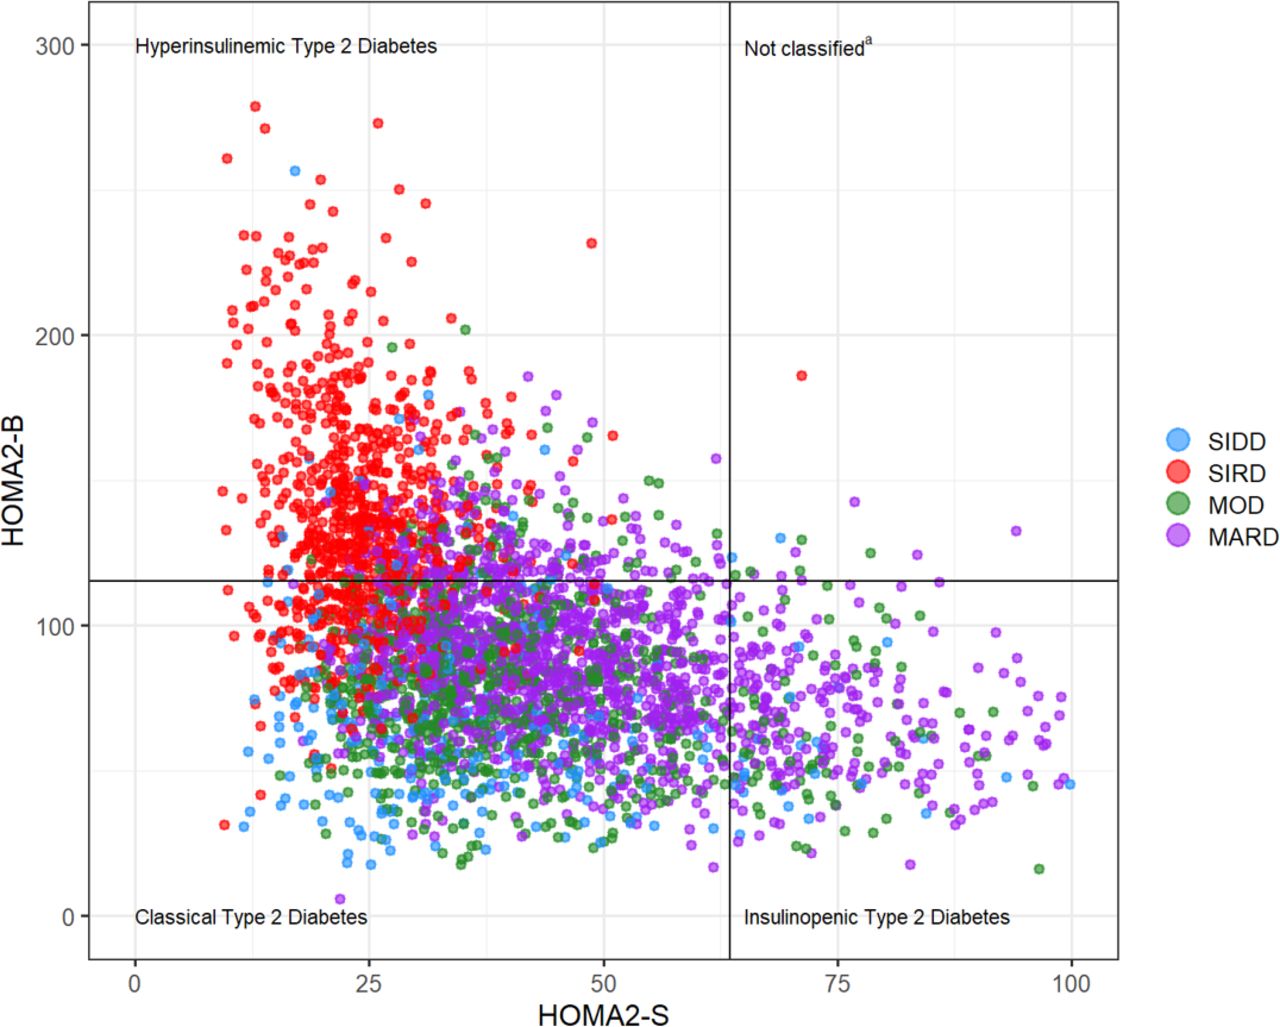
Plot of insulin sensitivity and beta-cell function. The lines mark the distinction between the three Danish phenotypes, and the colors mark the four clusters identified in the main analysis. aA total of 15 (SIDD: n=2, SIRD: n=1, MOD: n=5, MARD: n=7) individuals had high insulin sensitivity and high beta-cell function (ie, neither insulinopenic, classical, or hyperinsulinemic type 2 diabetes). In the previous DD2 phenotype study, this was considered to be HOMA2 values in the non-diabetes area, and the individuals were therefore not classified. We did not exclude these 15 individuals in our study. DD2, Danish Centre for Strategic Research in Type 2 Diabetes; HOMA2, homeostatic model assessment 2; MARD, mild age-related diabetes; MOD, mild obesity-related diabetes; SIDD, severe insulin-deficient diabetes; SIRD, severe insulin-resistant diabetes.
Table 2 shows that among the three New DD2 Clusters, patients allocated to New luster 2 (characterized by hyperinsulinemia) had the highest prevalence of macrovascular complications and kidney disease, while those in New Cluster 3 (characterized by high age) had the highest prevalence of eye disease. Patients in New Cluster 1 (characterized by insulin deficiency) more often had a family history of diabetes and most often were using glucose-lowering drugs as of the DD2 enrollment date.
For both the analysis replicating the Swedish clusters and the new alternative k-value DD2 cluster analysis, the Jaccard means were above 0.75, regardless of sex, indicating reasonably high cluster stability (online supplemental table S3).13
Comparison with the Danish T2D phenotypes
While comparing patient distribution across the four replicated Swedish clusters and the three Danish T2D phenotypes, 81% of the SIDD patients, 79% of the MOD patients, and 69% of the MARD patients all exhibited the classical phenotype. In comparison, 70% of the SIRD patients exhibited the hyperinsulinemic phenotype (figures 2B and 3). For the New alternative k-value DD2 Clusters, 60% of patients in the hyperinsulinemic cluster (New Cluster 2) represented 76% of patients with a hyperinsulinemic phenotype (figure 2C). In accordance, the highest prevalence of macrovascular complications and kidney disease were observed among those with the hyperinsulinemic phenotype (online supplemental table S4).
Additional analyses
In the sensitivity analysis restricted to patients with pretreatment HbA1c measurements (n=739), we observed a distribution of patients and cluster variables similar to that in the main analysis, with the exception that HbA1c was higher in the SIDD group in this analysis and as such was more comparable with the ANDIS cohort (online supplemental figure S7). Changing the index date to the DD2 enrollment date also did not change the allocation of patients or the distribution of cluster variables except for HbA1c values being slightly lower, particularly in the SIDD cluster (online supplemental figure S8).
Patient distributions changed moderately when patients were assigned to clusters based on coordinates from the ANDIS cohort (figure 2D). Most notably, 34% of patients assigned to the SIDD cluster and 38% of patients assigned to the SIRD cluster in the de novo cluster analysis were redistributed to the MOD cluster when the ANDIS centroids were used. Similarly, 32% of patients from the de novo MOD cluster were redistributed to the MARD cluster, while almost all (97%) MARD patients were also allocated to the MARD cluster while using ANDIS centroids (boxplots for the main de novo analysis and the cluster assignment based on coordinates are available in online supplemental figures S4 and S9, respectively).
It seemed like cluster assignment was especially sensitive to HbA1c and age, as omitting one of these variables changed the patient distribution markedly (online supplemental figure S10). Omitting HOMA2-IR, HOMA2-B, or BMI did not cause major changes to the patient distribution.
Discussion
Our study yielded two important findings. First, we were able to replicate the four T2D clusters identified in the Swedish ANDIS cohort in the Danish DD2 cohort,2 by applying a similar data-driven cluster analysis using the same key clinical variables—age, BMI, HbA1c, C-peptide, and plasma glucose—and a priori assuming four T2D clusters. However, the data seemed more compatible with three rather than four clusters. Second, when we compared the identified four (replication of the Swedish clusters) or three (alternative k-value) data-driven clusters with the previously ascertained three Danish HOMA2-based phenotypes, our data showed differences in the classification of patients.
HbA1c levels in the SIDD cluster were slightly lower in the Danish DD2 cohort than the Swedish ANDIS cohort,2 which is likely explained by the inclusion of patients both untreated and treated with glucose-lowering drugs in the DD2 cohort. Consequently, the Danish SIDD cluster accounted for only 8% of the patients (approximately 15% in the Swedish ANDIS cohort). However, in full agreement with the ANDIS results, the DD2 SIDD cluster distinguished patients with clearly higher HbA1c levels, compared with average HbA1c levels in the three other T2D clusters. Apart from HbA1c level in the SIDD cluster, there were strong overlaps between the replicated four T2D clusters with respect to the cluster variables. This may explain the uncertainty with respect to define and differentiate the right and/or clinically relevant number of T2D classes.
It is important to emphasize that the k-means clustering of patients is based on a simple data-driven method rather than a physiologically unique allocation of individuals into T2D classes. Moreover, the ‘true’ number of T2D clusters is not a fully objective assessment but depends on subjective choices, both on the ‘input side’ (ie, choice of cluster variables) and ‘output side’ (ie, determining the number of clusters). While all five clinical variables applied in the Swedish cluster analyses are clinically and physiologically justifiable, other meaningful clusters could have resulted from selecting another set of patient characteristics. In addition, the suggested optimal number of clusters, k, is generally based on simple inspection of graphical plots. Our main method, the average silhouette method, suggested that presence of three clusters in the DD2 cohort was most likely. This was closely followed by two clusters. The likelihood of four or more clusters was clearly lower (online supplemental figure S5A). Using the silhouette method, we therefore conclude that the optimal number of distinct clusters based on the Swedish input variables in our DD2 cohort is closer to three than to four. However, alternative cluster number evaluation methods pointed towards the existence of five or six clusters (online supplemental figure S5B,C), challenging the identification of a definitive number of distinct T2D classes. Moreover, the validity of the clusters for clinical predictions has not yet been established. In their analyses based on the A Diabetes Outcome Progression Trial (ADOPT) and the Action to Control Cardiovascular Risk in Diabetes (ACCORD) trial, Dennis et al17 concluded that age at diabetes diagnosis predicted glycemic progression just as well as the T2D clusters. Alternative simple models combining age, sex, baseline HbA1c, and BMI also predicted response to glycemic treatment better than the clusters per se.17
Other studies also have striven to identify novel T2D clusters in Asian,14 15 18 19 Latin American,19 and Caucasian16 19–21 diabetes patients using k-means cluster analysis. Some have used a fixed k-value of four in order to replicate the original Swedish clusters,17 18 whereas others14–16 20 21 have applied an analytical approach allowing for a wider range of clusters and/or included cluster variables other than those originally used. Our DD2 MOD cluster seemed less well defined, as patients from this cluster reallocated to all three new alternative k-value DD2 clusters. Consistent with this observation, Safai et al20 did not identify a MOD-like cluster in their de novo cluster analysis (which also included diabetes duration and GADA titer as cluster variables) and two of their four clusters were very similar except for diabetes duration. They possibly may have had ended up with three clusters if they had not added diabetes duration as cluster variable. Similarly, other studies did not find their MOD-like clusters to have the highest BMI15 22 or did not support k=4 as the most optimal number of T2D clusters.16
Using a pathophysiological insulin secretion and action based approach (HOMA2 estimates) as the core fundament for defining T2D classes is a feature common to both the Swedish cluster-based and the Danish phenotype classification proposals. For this reason, we considered it likely that our new three-cluster DD2 grouping would classify patients in a manner similar to the three phenotypes. However, this was not the case, as most patients in New Cluster 1 (insulin deficiency) and New Cluster 3 (high age) were allocated to the classical phenotype. New Ccluster 2 (hyperinsulinemia) appeared to be the most distinct across classification approaches, with the majority of patients reallocated to the hyperinsulinemic phenotype.
The pathophysiology of T2D involves multiple organs with or without influence on insulin secretion or sensitivity, and HOMA2 estimates are at best surrogate measures of the actual (but not completely understood) defects of pancreatic insulin secretion and/or insulin sensitivity. First, HOMA2-B and HOMA2-IR are calculated using the same unstimulated fasting plasma glucose and serum C-peptide levels and therefore are correlated and interrelated. Second, HOMA2 estimates in patients with diabetes may be flawed by use of glucose-lowering medications.23 Slieker et al21 included HDL cholesterol and C-peptide measurements instead of HOMA2 for subgrouping analyses in patients with T2D. They identified five instead of four T2D clusters, of which two mimicked the original MARD cluster but with different HDL levels. Whether the most correct and clinical meaningful T2D classification can be defined using pathophysiological features or rather etiological factors, biomarkers unrelated to the underlying cause of the disease, and/or disease trajectories needs further investigation.
Regardless, using the proposed insulin secretion/action based approaches, the SIRD cluster and the hyperinsulinemic phenotype appear to be among the most distinct classes. These T2D classes, characterized by high beta-cell function, are reported to have the highest prevalence of diabetic kidney disease.2 14 24 They also are associated with abdominal obesity3 and increased liver fat content24 and furthermore represent the T2D classes most likely to be associated with elevated cardiovascular risk, which is further supported by our results.2 3 Interestingly, the Swedish SIRD cluster stood out from the others, with lower heritability and a lower diabetes genetic risk score.2 25 This is supported by our findings. The SIRD cluster therefore may have a different etiological background than the other T2D classes. Further studies on the long-term prognostic utility of T2D classifications are needed.
Optimally, validation of the clusters proposed by Ahlqvist et al should be performed in treatment-naïve new-onset T2D patients. This has not been possible in most studies to date.14 15 19–22 24 Likewise, HbA1c and HOMA2 measurements were not available for all DD2 patients prior to initiation of glucose-lowering treatment. However, we obtained virtually identical results in the sensitivity analysis restricted to those with available pretreatment HbA1c measurements.
The DD2 cohort aims to enroll T2D patients. Consequently, the proportion of GADA-positive patients is small compared with the original Swedish cohort. However, the SAID cluster was defined solely on GADA positivity in the original Swedish study, that is, that cluster was identified before running the k-means cluster analysis. Thus, the low proportion of GADA-positive DD2 patients did not hamper our T2D cluster analysis.
More than one-third of the source population was excluded due to missing data on cluster variables. However, patient characteristics were comparable across included and excluded individuals (online supplemental table S5). Also, the DD2 cohort only included ~5% of Danish individuals diagnosed with T2D during the study period. However, characteristics of the DD2 patients are similar to those of average newly diagnosed Danish T2D patients.26
Finally, as in previous studies,2 14 15 17 18 20 24 25 we relied on fasting serum C-peptide for HOMA2 calculations, although use of fasting insulin concentrations may have been preferable for the determination of HOMA2-IR.23
In conclusion, we found evidence that different HOMA2-based approaches do not classify T2D patients consistently. There may be a need for additional biomarkers covering T2D etiology, pathophysiology, and outcomes in order to define robust and clinically relevant T2D classes.
Data availability statement
Data may be obtained from a third party and are not publicly available. More information about the DD2 cohort can be found at the DD2 website: www.dd2.nu. The DD2 project has a Steering Group that strongly encourages national and international collaboration. Interested researchers can contact Professor Kurt Højlund at Kurt.Hoejlund@rsyd.dk. According to Danish data protection legislation, linked individual-level register data analyzed in the study cannot be shared or made publicly available. Register data are stored at the Danish Health Data Authority and can be made available for research on reasonable request and with permission from the Danish Data Protection Agency.
Ethics statements
Patient consent for publication
Ethics approval
This study involves human participants and was approved by Denmark’s Regional Ethical Committee on Health Research (Record number S-20100082) and by the Danish Data Protection Agency /record number 2008-58-0035 and 2016-051-000001/2514). All DD2 participants volunteered to participate in the DD2 project and gave written informed consent.
Acknowledgments
We are grateful to all Danish Centre for Strategic Research in Type 2 Diabetes (DD2) participants as well as to the staff in outpatient hospital clinics, hospital clinical laboratories, and general practitioners participating in the enrollment. We would like to sincerely thank the DD2 staff.
References
Supplementary materials
Supplementary Data
This web only file has been produced by the BMJ Publishing Group from an electronic file supplied by the author(s) and has not been edited for content.
Footnotes
DHC and SKN are joint first authors.
DHC, SKN, RWT and AV contributed equally.
Contributors RWT, AV, EA, and CL conceived the study idea. DHC, SKN, EA, CL, SG-C, RWT, and AV designed the study. JSN is the principal manager of the DD2. SKN performed the statistical analysis. DHC, SKN, RWT, and AV prepared the first draft. All authors contributed to the interpretation of data, to the drafting of the manuscript as well as critically revised the manuscript draft. All authors gave final approval of the version to be published. SKN, DHC, RWT, and AV are the guarantors of this work and, as such, had full access to all the data in the study and takes responsibility for the integrity of the data and the accuracy of the data analysis. RWT and AV are joint last authors.
Funding The DD2 study was supported by the Danish Agency for Science (grant numbers 09-067009 and 09-075724), The Danish Health and Medicines Authority, The Danish Diabetes Association, Region of Southern Denmark, and the Novo Nordisk Foundation (grant numbers NNF17SA0030962-2 and NNF20O0063292). The DD2 biobank was supported by an unrestricted donation from Novo Nordisk A/S. Project partners are listed on the website www.DD2.nu.
Disclaimer The sponsors had no role in study design, in data collection, analysis, and interpretation, or in drafting, revising or approving the manuscript for submission.
Competing interests The Department of Clinical Epidemiology, Aarhus University Hospital, receives funding for other studies from companies in the form of institutional research grants to (and administered by) Aarhus University. None of these studies has any relation to the present study. JVS, KH, MHO, PV, NJ, CB, and AV are all affiliated with Danish Steno Diabetes centers. The Steno Diabetes centers are funded by the Novo Nordisk Foundation. EA was funded by grants from the Swedish Research Council (2017-02688, 2020-02191) and the Novo Nordisk foundation (NNF18OC0034408).
Provenance and peer review Not commissioned; externally peer reviewed.
Supplemental material This content has been supplied by the author(s). It has not been vetted by BMJ Publishing Group Limited (BMJ) and may not have been peer-reviewed. Any opinions or recommendations discussed are solely those of the author(s) and are not endorsed by BMJ. BMJ disclaims all liability and responsibility arising from any reliance placed on the content. Where the content includes any translated material, BMJ does not warrant the accuracy and reliability of the translations (including but not limited to local regulations, clinical guidelines, terminology, drug names and drug dosages), and is not responsible for any error and/or omissions arising from translation and adaptation or otherwise.