Article Text

Abstract
Introduction Type 2 diabetes mellitus (T2D) is highly heterogeneous in disease progression and risk of complications. This study aimed to categorize Thai T2D into subgroups using variables that are commonly available based on routine clinical parameters to predict disease progression and treatment outcomes.
Research design and methods This was a cohort study. Data-driven cluster analysis was performed using a Python program in patients with newly diagnosed T2D (n=721) of the Siriraj Diabetes Registry using five variables (age, body mass index (BMI), glycated hemoglobin (HbA1c), triglyceride (TG), high-density lipoprotein cholesterol (HDL-C)). Disease progression and risk of diabetic complications among clusters were compared using the Χ2 and Kruskal-Wallis test. Cox regression and the Kaplan-Meier curve were used to compare the time to diabetic complications and the time to insulin initiation.
Results The mean age was 53.4±11.3 years, 58.9% were women. The median follow-up time was 21.1 months (9.2–35.2). Four clusters were identified: cluster 1 (18.6%): high HbA1c, low BMI (insulin-deficiency diabetes); cluster 2 (11.8%): high TG, low HDL-C, average age and BMI (metabolic syndrome group); cluster 3 (23.3%): high BMI, low HbA1c, young age (obesity-related diabetes); cluster 4 (46.3%): older age and low HbA1c at diagnosis (age-related diabetes). Patients in cluster 1 had the highest prevalence of insulin treatment. Patients in cluster 2 had the highest risk of diabetic kidney disease and diabetic retinopathy. Patients in cluster 4 had the lowest prevalence of diabetic retinopathy, nephropathy, and insulin use.
Conclusions We were able to categorize Thai patients with newly diagnosed T2D into four clusters using five routine clinical parameters. This clustering method can help predict disease progression and risk of diabetic complications similar to previous studies using parameters including insulin resistance and insulin sensitivity markers.
- type 2 diabetes
- classification
Data availability statement
Data are available upon reasonable request.
This is an open access article distributed in accordance with the Creative Commons Attribution Non Commercial (CC BY-NC 4.0) license, which permits others to distribute, remix, adapt, build upon this work non-commercially, and license their derivative works on different terms, provided the original work is properly cited, appropriate credit is given, any changes made indicated, and the use is non-commercial. See: http://creativecommons.org/licenses/by-nc/4.0/.
Statistics from Altmetric.com
WHAT IS ALREADY KNOWN ON THIS TOPIC
The clustering method that uses age at diagnosis, body mass index (BMI), glycated hemoglobin (HbA1c), insulin resistance, and insulin sensitivity markers can identify subgroups of newly diagnosed patients with type 2 diabetes (T2D) and predict disease progression and treatment outcomes.
WHAT THIS STUDY ADDS
Using five routine clinical parameters, including age at diagnosis, BMI, HbA1c, triglyceride, and high-density lipoprotein cholesterol, we were able to categorize Thai patients with newly diagnosed T2D into four clusters and predict diabetic complications and glycemic progression.
HOW THIS STUDY MIGHT AFFECT RESEARCH, PRACTICE OR POLICY
Longer follow-up studies and validation of our findings in other Asian T2D cohorts are required.
Introduction
Type 2 diabetes mellitus (T2D) is caused by combinations of insulin resistance and β-cell dysfunction.1 Asians with T2D tend to develop diabetes at a lower body mass index (BMI) than Caucasians,2 and a β-cell function defect occurs in the early stage of Asians with T2D.3 Patients with T2D are highly heterogeneous in disease progression, difficulty in glycemic controls, and the risk of developing chronic diabetic complications.4 Untangling the heterogeneity of T2D can improve prediction of clinical outcomes and facilitate precision medicine, thus leading to better care of patients with T2D.5
Ahlqvist et al proposed subgrouping newly diagnosed patients with T2D using six variables in five clusters tested in the All New Diabetics in Scania cohort.6 The parameters used were antiglutamic acid decarboxylase (GAD) antibody, age at diagnosis, baseline BMI, glycated hemoglobin (HbA1c), and homeostatic model evaluation (HOMA) 2-measured insulin resistance and β-cell function calculated by the C peptide. Their five clusters were cluster 1, severe autoimmune diabetes; cluster 2, severe insulin-deficient diabetes (SIDD); cluster 3, severe insulin-resistant diabetes (SIRD); cluster 4, mild obesity-related diabetes (MOD); cluster 5, mild age-related diabetes (MARD). The five clusters had different microvascular complication progression trajectories, thus showing potentially clinically important differences in disease progression and risk of complications between clusters. There was a faster progression of kidney disease and a higher prevalence of non-alcoholic fatty liver disease in the insulin-resistant group (SIRD), while retinopathy was more prevalent in the insulin-deficiency group (SIDD).6 7 In addition, clustering has also been reported to predict treatment response to specific oral antidiabetic drugs.8
This novel clustering was tested in Chinese and US patients9 using data from the China National Diabetes and Metabolic Disorders Study (CNDMDS) and the 1988–1994 National Health and Nutrition Examination Survey (NHANES III) using five variables proposed by Ahlqvist et al but excluding anti-GAD. They were able to subgroup newly diagnosed T2D into four clusters (cluster 2–5 according to the study by Ahlqvist et al). However, the fact that anti-GAD and HOMA are not routinely measured in patients with T2D has limited the generalizability of this method. A recent study using NHANES III data has compared the two clustering methods using five parameters proposed by Ahlqvist et al and using only three simple parameters (age, BMI, HbA1c). The study found that this simple classification, which is accessible in most patients, could be used to identify T2D with several health and mortality risks.10 Even without HOMA measurements, the MARD, MOD and SIDD subgroups can be identified. The SIDD group had significantly higher HbA1c than other subgroups; MARD was older; and MOD had a higher BMI. However, these three simple parameters had difficulty identifying the SIRD group due to the absence of clinical parameters to identify insulin-resistant patients without using HOMA insulin resistance (HOMA2-IR).
Ferrannini et al found that insulin sensitivity declined linearly with BMI. However, the degree of insulin resistance was different among obese subjects.11 The characteristic of dyslipidemia in patients with insulin resistance and metabolic syndrome is hypertriglyceridemia and low plasma high-density lipoprotein cholesterol (HDL-C) levels.12 Furthermore, elevation of plasma triglyceride (TG) to HDL ratio has been observed in patients with T2D who had chronic diabetic complications13 and patients with poorly controlled hypertension.14 Therefore, this study aimed to classify newly diagnosed T2D using variables that are commonly available based on routine clinical parameters and add more parameters (TG, HDL) to help identify patients with insulin resistance, thus resulting in better grouping of patients. The parameters used were age at diagnosis, baseline BMI, HbA1c, TG and plasma HDL-C levels. Furthermore, the response to treatment and the prevalence of chronic complications among different clusters were evaluated. The comparison between the T2D subgroup using five simple parameters and using HOMA2-β and HOMA2-IR was also analyzed.
Methods
Study protocol
This study was carried out at Faculty of Medicine Siriraj Hospital, a tertiary care center located in Bangkok, Thailand. Adults with T2D from the Siriraj Diabetes Registry were screened for eligibility. The registry has been in operation since February 2015. The inclusion criteria were patients with diabetes, ≥18 years old, diagnosed with T2D within 2 years of the registration date, having all the required parameters, including age at the time of diagnosis, baseline BMI, HbA1c, TG and HDL-C. The exclusion criteria were patients with type 1 diabetes or any other type of diabetes.
Fasting plasma glucose (FPG) and HbA1c were measured by the enzyme method and the turbidimetric inhibition immunoassay, respectively. Plasma total cholesterol and TG were measured by an enzymatic calorimetric assay, while plasma HDL-C was measured using a homogeneous enzymatic calorimetric assay (Roche diagnostic, Mannheim, Germany). The C peptides were measured using an electrochemiluminescence immunoassay (Roche Diagnostic, Mannheim, Germany). HOMA2-β and HOMA2-IR were calculated using FPG and C peptide with the HOMA calculator (University of Oxford, Oxford, UK).15
Of the 2800 patients with T2D screened, newly diagnosed T2D within 2 years was identified in 815 patients in the registry. Patients who had completed the baseline data were enrolled (n=721). Demographic data, body weight, FPG, HbA1c, comorbid diseases, and medications were collected at baseline. Glycemic progression and diabetic complications that occurred during the study period were collected until December 31, 2021.
Sample size calculation
A previous study from the NHANES III cohort has reported that the cluster that had the lowest proportion of patients in the study was 7.9%.9 Using these data, an allowable error (d) of 0.02, and a 3% increase to compensate for incomplete data, a sample size of 720 was required for clustering.
Outcomes
Definitions of diabetic complications and glycemic progression
The screening for chronic diabetic complications should be performed at least annually according to Thai Clinical Practice Guideline for Diabetes 2017.16 The tests were requested by the doctors who regularly follow up with the patients. The numbers of chronic complications screened in our study were 96.8% for diabetic retinopathy, 98.2% for estimated glomerular filtration rate (eGFR) testing, 92.5% for albuminuria, and 99.6% for monofilament testing. The eGFR was calculated using the Chronic Kidney Disease Epidemiology Collaboration equation.17 Chronic kidney disease (CKD) was defined as an eGFR of less than 45–60 (stage 3A), less than 30–45 (stage 3B) and less than 15–30 (stage 4) mL/min/1.73 m² for more than 90 days (onset of CKD was established as the beginning of this period). End-stage renal disease (stage 5) was defined as at least one eGFR below 15 mL/min/1.73 m2. Macroalbuminuria was defined as an albumin excretion rate of 300 mg/day or greater, or a urine protein creatinine ratio >0.2 g/g creatinine. Diabetic retinopathy was defined as mild, moderate, and severe non-proliferative diabetic retinopathy and proliferative diabetic retinopathy. The diagnosis was confirmed by an ophthalmologist or fundus camera using the Siriraj artificial intelligence algorithm for the detection of diabetic retinopathy screening.18 Peripheral neuropathy was defined as having an abnormal monofilament test or diabetic foot ulcer. Coronary events and stroke were defined by the International Classification of Diseases-10. Glycemic progression was defined as mean HbA1c during the study period from the date of the registry to year 7.
Cluster analysis
K-means analysis using the Python program, V.3.0 (Amsterdam, The Netherlands)19 was used to classify patients into subgroups using five variables, including age at diagnosis, baseline BMI, HbA1c, TG, and HDL-C. Continuous measures were mean centered and standardized. Continuous measures greater than 5 SD from the mean were excluded. The first step of clustering was to estimate the optimal number of clusters on the basis of the silhouette width and the elbow method in Python. After clustering using five variables, we checked the similarity within each cluster and the difference between the clusters using a three-dimensional plot in the Python program. Robust tests of equal means (p<0.001) and the Games-Howell post hoc test were performed in SPSS V.23.
Statistical analysis
We compared characteristic, glycemic progression and the risk of diabetic complications between clusters using one-way analysis of variance or Kruskal-Wallis test for continuous data as appropriate. Χ2 test was used to compare categorical data between clusters. Cox regression, Hazard ratio (HR), and Kaplan-Meier curve were used to compare time to diabetic complications and time to medication. Mixed linear models (random effect) were used to analyze the glycemic controls of the four clusters. Pairwise deletion was used for missing data. Statistical analysis was performed using SPSS V.23.
Results
The mean age of the study patients (n=721) was 53.4±11.3 years, 58.9% were women. The median follow-up time (IQR) was 21.1 (9.2–35.2) months. The median follow-up time (IQR) of cluster 1–4 was 20.2 (11.6–35.7), 18.4 (9.7–35.0), 21.8 (10.3–33.3), and 21.5 (9.2–37.0) months, respectively. The median HbA1c (IQR) at baseline was 7.6% (6.7%–10.4%). The antidiabetic medications used were metformin (74.3%), sulfonylurea (26.6%), pioglitazone (3.5%), dipeptidyl peptidase 4 inhibitor (3.5%), and insulin (7.8%). To classify patients into diabetes subgroups, a K-means analysis was performed using five clustering variables. The optimum number of clusters on the basis of the silhouette width and elbow method was four. The characteristics of the four clusters are as follows:
Cluster 1 (severe insulin-deficiency diabetes: SIDD), 18.6% (n=134): high HbA1c, low BMI.
Cluster 2 (metabolic syndrome diabetes: MSD), 11.8% (n=85): high TG, low HDL-C, average age, and BMI.
Cluster 3 (mild obesity-related diabetes: MOD), 23.3% (n=168): high BMI, lower HbA1c, young age.
Cluster 4 (mild age-related diabetes: MARD), 46.3% (n=334): older age and relatively lower HbA1c at diagnosis.
The distribution of patients and the characteristics of the cluster are shown in figure 1.

Distribution of patients (A) and group characteristics (B) according to age at diagnosis, baseline BMI, HbA1c, TG, and HDL-C for each cluster. BMI, body mass index; HbA1c, glycated hemoglobin; HDL-C, high-density lipoprotein cholesterol; MARD, mild age-related diabetes; MOD, mild obesity-related diabetes; MSD, metabolic syndrome diabetes; SIDD, severe insulin-deficient diabetes; TG, triglyceride.
The baseline characteristics of the patients among the four clusters are shown in table 1.
Baseline characteristics at diagnosis of the study patients divided by clusters
Comparison of clustering methods between using HOMA2 and using simple clinical parameters
Data from HOMA2-β and HOMA2-IR calculated by the C peptide were available in 221 patients in this cohort. Using five variables, including age, BMI, HbA1c, HOMA2-β, and HOMA2-IR, patients can be classified into four subgroups. Using this method, 68% of the patients were in the same clusters as those using simple clinical parameters for the clustering.
Outcomes
The disease progression, treatment, and development of diabetic complications between clusters were compared (table 2). Cluster 1 (SIDD) had the highest risk of insulin treatment (25.6%) and a high risk of diabetic retinopathy (20.0%). Cluster 2 (MSD) had the highest risk of macroalbuminuria (15.6%) and diabetic retinopathy (20.7%). Cluster 4 (MARD) has the lowest prevalence of diabetic retinopathy (5.3%), macroalbuminuria (5.6%) and prevalence of insulin use (2.1%). The difference in the prevalence of macrovascular events was not significant between different clusters (table 2).
Prevalence of insulin usage and chronic diabetic complications among the four clusters
The HR for the development of chronic diabetic complications in the clusters was calculated using cluster 4 (MARD), which has the lowest incidence of chronic diabetic complications and disease progression as a reference (table 3). The risk ratio for having diabetic retinopathy was highest in cluster 2 (MSD) (4.68 (2.36 to 9.27), p<0.001), followed by cluster 1 (SIDD) (4.62 (2.36 to 9.27), p<0.001), respectively. Diabetic nephropathy was more common in cluster 2 (MSD). HR for macroalbuminuria in cluster 2 was 2.92 ((1.40 to 6.12), p=0.004); HR for CKD stage 3B or macroalbuminuria in cluster 2 was 2.04 ((1.05 to 3.99), p=0.037). Patients in cluster 1 (SIDD) had a 12.8 times higher risk of insulin use, followed by cluster 2 (MSD) and cluster 3 (MOD) (table 3). The median survival curve for chronic diabetic complications in the four clusters is shown in figure 2. The time to diabetic retinopathy, macroalbuminuria, and insulin use was significantly different between the four clusters (log rank test p<0.05), while there were no significant differences in the time to peripheral neuropathy, coronary artery disease, and stroke.
Risk of chronic diabetic complications and insulin use by cluster
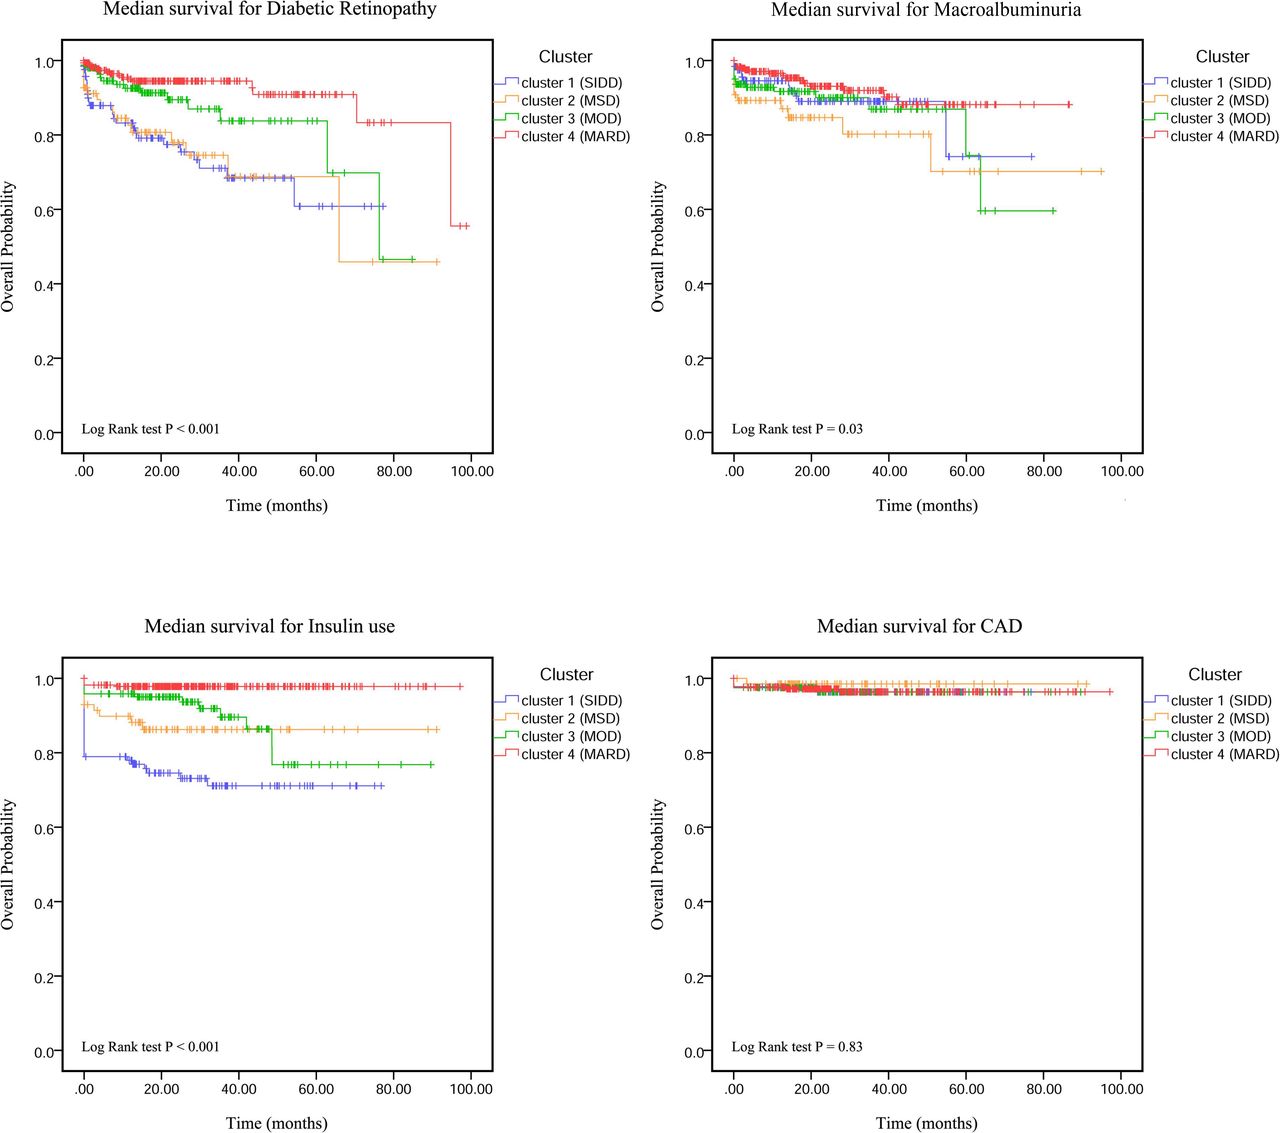
The Kaplan-Meier curve showing median survival of events. CAD, coronary artery disease; MARD, mild age-related diabetes; MOD, mild obesity-related diabetes; MSD, metabolic syndrome diabetes; SIDD, severe insulin-deficient diabetes.
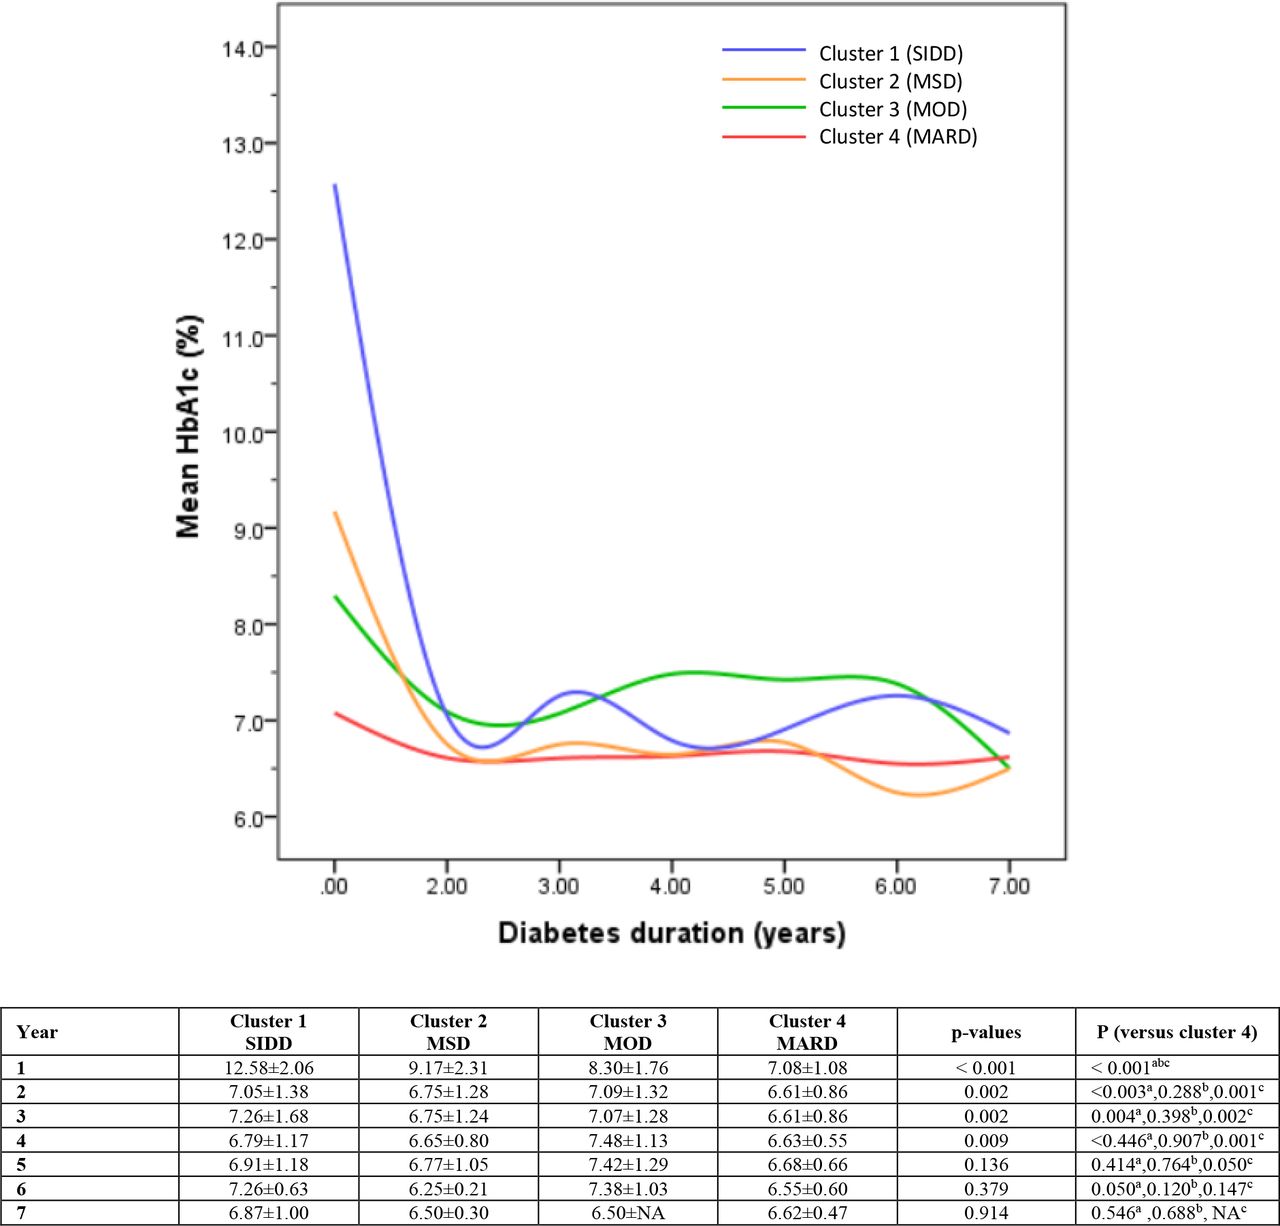
The glycemic progression determined by mean HbA1c during the follow-up period was significantly different between the four clusters from baseline to year 4. Cluster 1 (SIDD) and cluster 3 (MOD) had the poorest glycemic controls, while cluster 4 (MARD) has a mean HbA1c less than 7% from the first year to the seventh year (figure 3). The duration of diabetes had a significant effect on the HbA1c level (p<0.001) but the slope of the difference in HbA1c level between four clusters also showed significant differences (p<0.001). The interaction between the cluster and the duration of diabetes had an effect on the HbA1c level (p<0.001).

Mean HbA1c of the four clusters during the study period. aComparison between clusters 1 and 4. bComparison between clusters 2 and 4. cComparison between clusters 3 and 4. HbA1c, glycated hemoglobin; MARD, mild age-related diabetes; MOD, mild obesity-related diabetes; MSD, metabolic syndrome diabetes; SIDD, severe insulin-deficient diabetes.
Discussion
The results of our study suggest that using five commonly measured clinical parameters, which are age at diagnosis, baseline BMI, HbA1c, plasma TG, and HDL-C, can help classify newly diagnosed adult-onset Thai T2D into four clusters. These four subgroups of diabetes have different progression of the disease and the risk of developing chronic diabetic complications.
Clustering of newly diagnosed T2D has been tested in Caucasians both in the European6 8 and American9 adult-onset diabetes cohort. In the East Asian population,9 this clustering method resulted in the same subgroups of newly diagnosed T2D as in the Caucasian population, while providing a different clustering in the South Asian population.20 Although the pathophysiology of Asians with T2D could be slightly different from Caucasians, because T2D occurs at a lower BMI in Asians than Caucasians, we have demonstrated that Thai patients with newly diagnosed T2D can be classified into four clusters similar to the Caucasian cohort using five simple clinical parameters. Cluster 1 (SIDD) had significantly higher baseline HbA1c and lower BMI than other clusters. This cluster was characterized by a low HOMA2-β index or β-cell deficiency by Ahlqvist et al.6 Patients in this cluster had a higher rate of insulin use and a high incidence of diabetic retinopathy, which was consistent with previous studies.6 7 Cluster 2 (MSD), which was characterized by a high plasma TG and a low plasma HDL-C in our study, had the highest risk of developing macroalbuminuria. This finding was similar to SIRD or insulin resistance cluster which had the highest HOMA2-IR index as described by Ahlqvist et al.6 The characteristic of patients in cluster 4 (MARD) was older age at diagnosis. This cluster had a mild progression of the disease and was less likely to develop microvascular complications, similar to what was reported in an earlier study.6 7 We found that the glycemic progression determined by the mean HbA1c during the follow-up period was significantly different between the clusters. Cluster 4 (MARD) had mild disease progression, while cluster 1 (SIDD) and cluster 2 (MSD) had poorer glycemic controls. Our findings were similar to those of the Caucasian cohort, which reported that older age at diagnosis was associated with a lower rate of glycemic progression.6 8 Furthermore, in the Caucasian cohort, the SIDD group had a higher HbA1c at diagnosis than the other groups, a difference that persists throughout follow-up. The MOD also has a higher rate of glycemic progression than other clusters in the ADOPT21 and RECORD22 cohorts.8
The risk of peripheral neuropathy, coronary events, and stroke did not show statistically significant differences in this study. Swedish cohorts have also not reported significant differences between clusters in age-adjusted and sex-adjusted risk of coronary events and stroke.6 Longer follow-up could be necessary to discriminate these outcomes between clusters. In addition, other risk factors, for example, lipids, family history of premature coronary artery disease, smoking, and hypertension, could play an important role in the risk of developing cardiovascular events.
Our findings have confirmed the study of NHANES III that using three simple parameters (age, BMI, and HbA1c at baseline) can help classify patients in clusters of SIDD, MARD, and MOD.10 However, we found that by using plasma levels of TG and HDL-C, which are common dyslipidemias found in patients with metabolic syndrome and insulin resistance, we can classify patients in the MSD cluster. The MSD cluster in our study had the highest risk of developing diabetic nephropathy similar to the SIRD group which was classified using high HOMA2-IR values by Ahlqvist et al.6
Although our study can classify newly diagnosed patients with T2D into subgroups similar to the Ahlqvist et al study,6 there are some different characteristics between the studies. Patients in our study had younger age, lower BMI, and higher HbA1c at the time of diagnosis of diabetes mellitus in all clusters. The differences were clearly demonstrated in the insulin-resistance group (MSD in our study and SIRD in the Ahlqvist et al study6) including age (49.7±10.3 vs 65.3±93 years), BMI (27.3±4.0 vs 33.9±5.2 kg/m2) and HbA1c (9.2±2.3% vs 7.1±3.5%). Furthermore, the Chinese cohort in the CNDMDS registry9 also had a younger age (52±12 years) and a lower BMI (25.9±3.9 km/m2) at diagnosis compared with the Ahlqvist et al study. These differences could be caused by the difference in T2D pathophysiology between Caucasians and Asians.3
Clustering patients with newly diagnosed T2D into these new subgroups could help clinicians in some aspects. Patients with SIDD who have decreased β-cell function and high risk of diabetes retinopathy should be prescribed insulin without hesitation when patients cannot achieve glycemic control with essential antidiabetic drugs. Patients in MSD have high insulin resistance and increased prevalence of diabetic nephropathy. The association of insulin resistance and CKD has been shown in patients without diabetes.23 Therefore, in addition to controlling blood glucose, the use of specific drugs to reduce insulin resistance, such as metformin or thiazolidinedione (TZD), or drugs to prevent the progression of CKD, such as sodium glucose transporter 2 inhibitor, could be beneficial in this subgroup of patients. Furthermore, the ADOPT trial database showed an overall benefit for HbA1c with TZD therapy in SIRD.8
Our study has several strengths. First, we have tested the clustering of newly diagnosed T2D in the Asian population, which has not been widely tested before. Second, our study shows that without HOMA measurements, the SIDD, MSD, MOD and MARD subgroups proposed by Ahlqvist et al6 can be identified using five simple parameters. SIDD, MSD, and MARD have also been clustered using three simple parameters (age, BMI, HbA1c) that have been reported by Xie et al using data from NHANES III.10 Our study has some limitations. First, not all patients were screened for chronic diabetic complications. The numbers of chronic complications screened in our study were 96.8% for diabetic retinopathy, 98.2% for eGFR testing, 92.5% for albuminuria, and 99.6% for monofilament testing. Second, the follow-up period is relatively short and the number of macrovascular events that occurred is low. Therefore, the interpretation of the difference in macrovascular events between clusters should be performed with caution. Longer follow-up studies and validation of our findings in other cohorts are required.
In conclusion, we were able to stratify four clusters of newly diagnosed patients with T2D using five variables based on routine clinical parameters. This clustering method can help predict disease progression and risk of complications similar to previous studies using parameters that include insulin resistant and insulin sensitivity markers.
Data availability statement
Data are available upon reasonable request.
Ethics statements
Patient consent for publication
Ethics approval
This study involves human participants and was approved by the Siriraj Institutional Review Board (COA no Si 171/2563(IRB4). All subjects provided their informed written consent to enroll in the Siriraj Diabetes Registry.
Acknowledgments
The authors gratefully acknowledge the Siriraj Diabetes Center of Excellence and Siriraj Diabetes Center Registry Team, including Sarawut Uprarat, Varisara Lapinee, Supatinee Tedtum, Napapas Supupramai, Surisa Arlai, Chanoknan Luksameejaroenchai for data collection, the patients who agreed to participate in this study, and Dr James Mark Simmerman for English language editing.
References
Footnotes
Contributors LP contributed to study design, data collection, data analysis, and manuscript writing. NK contributed to data collection, data analysis, and manuscript writing. VB contributed to data collection, data analysis, and manuscript writing. WT contributed to data collection. WS contributed to the study design. AS contributed to the study design. NP contributed to the study design. SL contributed to the study design. NT contributed to study design, data analysis, manuscript writing, and proofreading. NT is the guarantor.
Funding This research project was supported by the Siriraj Research Fund, grant number IO (R016333047), Siriraj Hospital Faculty of Medicine, Mahidol University.
Competing interests None declared.
Provenance and peer review Not commissioned; externally peer reviewed.