Article Text

Abstract
Introduction Uncertainties exist on whether the main determinant of abnormal glucose tolerance (Abnl-GT) in Africans is β-cell failure or insulin resistance (IR). Therefore, we determined the prevalence, phenotype and characteristics of Abnl-GT due to β-cell failure versus IR in 486 African-born blacks (male: 64%, age: 38±10 years (mean±SD)) living in America.
Research design and methods Oral glucose tolerance test were performed. Abnl-GT is a term which includes both diabetes and prediabetes and was defined as fasting plasma glucose (FPG) ≥5.6 mmol/L and/or 2-hour glucose ≥7.8 mmol/L. IR was defined by the lowest quartile of the Matsuda Index (≤2.98) and retested using the upper quartile of homeostatic model assessment of insulin resistance (HOMA-IR) (≥2.07). Abnl-GT-IR required both Abnl-GT and IR. Abnl-GT-β-cell failure was defined as Abnl-GT without IR. Beta-cell compensation was assessed by the Disposition Index (DI). Fasting lipids were measured. Visceral adipose tissue (VAT) volume was obtained with abdominal CT scan.
Results The prevalence of Abnl-GT was 37% (182/486). For participants with Abnl-GT, IR occurred in 38% (69/182) and β-cell failure in 62% (113/182). Compared with Africans with Abnl-GT-IR, Africans with Abnl-GT-β-cell failure had lower body mass index (BMI) (30.8±4.3 vs 27.4±4.0 kg/m2), a lower prevalence of obesity (52% vs 19%), less VAT (163±72 vs 107±63 cm2), lower triglyceride (1.21±0.60 vs 0.85±0.42 mmol/L) and lower FPG (5.9±1.4 vs 5.3±0.6 mmol/L) and 2-hour glucose concentrations (10.0±3.1 vs 9.0±1.9 mmol/L) (all p<0.001) and higher DI, high-density lipoprotein (HDL), low-density lipoprotein particle size and HDL particle size (all p<0.01). Analyses with Matsuda Index and HOMA-IR yielded similar results. Potential confounders such as income, education, alcohol and fiber intake did not differ by group.
Conclusions Beta-cell failure occurred in two-thirds of participants with Abnl-GT and may be a more frequent determinant of Abnl-GT in Africans than IR. As BMI category, degree of glycemia and lipid profile appeared more favorable when Abnl-GT was due to β-cell failure rather than IR, the clinical course and optimal interventions may differ.
Trial registration number NCT00001853.
- diagnosis
- developing countries
- prediabetic state
- diabetes mellitus
- type 2
Data availability statement
Data are available upon reasonable request.
This is an open access article distributed in accordance with the Creative Commons Attribution Non Commercial (CC BY-NC 4.0) license, which permits others to distribute, remix, adapt, build upon this work non-commercially, and license their derivative works on different terms, provided the original work is properly cited, appropriate credit is given, any changes made indicated, and the use is non-commercial. See: http://creativecommons.org/licenses/by-nc/4.0/.
Statistics from Altmetric.com
Significance of this study
What is already known about this subject?
It is anticipated that between 2019 and 2045, Africa will experience a 143% increase in the prevalence of abnormal glucose tolerance, a term which combines diabetes and prediabetes.
Yet the balance between insulin resistance and β-cell failure as the main determinant of abnormal glucose tolerance in Africans is unknown.
What are the new findings?
For two-thirds of Africans with abnormal glucose tolerance, β-cell failure rather than insulin resistance was the main etiological determinant.
The phenotype and metabolic presentation of abnormal glucose tolerance depends on etiology so that Africans with abnormal glucose tolerance due to β-cell failure had (a) a lower prevalence of obesity; (b) less severe hyperglycemia and (c) a better lipid profile than Africans with abnormal glucose tolerance due to insulin resistance.
Insulin resistance was determined by Matsuda Index and homeostatic model assessment of insulin resistance (HOMA-IR) and insulin secretion assessed by the Insulin Secretion Index and HOMA-β, yielded similar results.
This confirms that the use of HOMA-IR and HOMA-β, requiring only one blood sample, provide quality results.
Significance of this study
How might these results change the focus of research or clinical practice?
The clinical course and optimal intervention for abnormal glucose tolerance may vary by etiology.
Prospective clinical protocols of abnormal glucose tolerance should incorporate baseline assessment of insulin resistance and β-cell function.
In resource-limited circumstances, HOMA-IR and HOMA-β are sufficient for determining insulin resistance and β-cell function.
As the majority of Africans with abnormal glucose tolerance due to β-cell failure were non-obese, body mass index criteria for both screening paradigms and prospective clinical trials need to be modified.
Introduction
In the 21st century, type 2 diabetes has become a global challenge and people of African descent may be disproportionately affected.1 Yet, obtaining accurate data specifically on the prevalence of diabetes in sub-Saharan Africa is problematic. According to the International Diabetes Federation (IDF), two-thirds of countries in sub-Saharan Africa do not have high-quality data on diabetes prevalence.1 Nonetheless, IDF estimates in 2019, 45.3 million Africans had prediabetes and 19.4 million had diabetes. The IDF predicts that by 2045 sub-Saharan Africa will experience a 143% increase in prevalence of both prediabetes and diabetes, the highest anticipated increase in the world.1 Prediabetes and diabetes represent a glycemic continuum and both are associated with vascular complications as well as a high all-cause mortality rate.2 The term abnormal glucose tolerance (Abnl-GT) is used when people with prediabetes and diabetes are analyzed together.3
To address the challenge of Abnl-GT in Africa, more information is needed on both etiology and presentation.1 4 In short, Abnl-GT represents an imbalance between degree of insulin resistance (IR) and β-cell secretion of insulin.5 As there are many pathways which lead to Abnl-GT, the initiating factors may vary between and within populations.6 While the data on Abnl-GT in Africans may be relatively scant, a considerable amount of data on other African descent populations such as African-Americans and African-Caribbeans are available.6 However, data from African-Americans and African-Caribbeans may not be translatable to Africans.6 In African-Americans and African-Caribbeans, Abnl-GT is most often characterized by obesity and IR.7 8 Yet emerging data from African countries, as well as low-income and middle-income countries globally, suggest that Abnl-GT may be occurring with increasing frequency in the non-obese with β-cell failure as the initiating cause.9 10
The role of β-cell failure as a trigger for Abnl-GT in Africans is understudied. To address this deficit, we examined the prevalence, phenotype and metabolic characteristics of Abnl-GT due to IR versus β-cell failure in African-born blacks living in America. Metabolic characteristics included the degree of glycemia, visceral adipose tissue (VAT) volume and lipid profile, specifically triglyceride (TG), high-density lipoprotein (HDL), low-density lipoprotein particle size (LDL-size) and HDL particle size (HDL-size).
Research design and methods
Population
The Africans in America cohort assess cardiometabolic risk in African-born blacks living in the USA.11–13 Recruitment was achieved by advertisements in newspapers, flyers, social media and posters at community events.
First, a telephone interview was conducted. To be invited for a screening visit at the NIH Clinical Center, the prospective enrollee had to self-identify as healthy, deny a previous history of diabetes, and confirm that both they and their parents were born in sub-Saharan Africa and self-identified as black.
Five hundred and thirty-six African-born blacks living in metropolitan Washington, District of Columbia completed the telephone interview and proceeded to the screening visit for a history, physical, ECG and routine blood tests.
Forty-one individuals did not proceed from the screening visit to the oral glucose tolerance test (OGTT). Reasons for exclusion were: anemia (n=12), elevated liver transaminases (n=1), declined blood draw (n=2), pregnancy (n=3), hypothyroidism (n=1), intravenous access issues (n=4) and scheduling conflicts (n=18).
After the OGTT, nine individuals were excluded. One person had a fasting insulin concentration of 172 pmol/L (normal <30 pmol/L) and was diagnosed with extreme IR. Eight individuals had a missing value for glucose or insulin during the multisampled OGTT.
Results from the remaining 486 participants were analyzed (male: 64%; age: 38±10 years (mean±SD), range 20–65 years, body mass index (BMI) 27.6±4.4 kg/m2, range 18.4–42.2 kg/m2).
Oral glucose tolerance test visit
After an overnight 12 hours fast, participants came to the NIH Clinical Center at 07:00 hours. Weight, height, waist circumference (WC) and blood pressure (BP) were measured. BMI was calculated by dividing weight in kilograms by height in meters squared. Obesity was defined as BMI ≥30 kg/m2 and non-obese as BMI <30 kg/m2.14 WC was measured at the superior border of the iliac crest at the end of expiration.15 The mean of three values was recorded.
Baseline blood samples for glucose, insulin, lipids, A1C and hemoglobin electrophoresis were obtained. Postglucola consumption (Trutol 75, Custom Laboratories) blood samples were taken at 0.5 hour, 1 hour and 2 hours for determination of glucose and insulin concentrations.
After the OGTT, a CT scan (Siemens and Somatom Force Scanner) with adipose windows designed to measure VAT was performed.16
Glucose tolerance status
Abnl-GT was defined as fasting plasma glucose (FPG) ≥5.6 mmol/L and/or 2-hour glucose ≥7.8 mmol/L.4 A diagnosis of diabetes required: FPG ≥7.0 mmol/L and/or 2-hour glucose ≥11.1 mmol/L; and prediabetes: FPG ≥5.6 mmol/L and <7.0 mmol/L and/or 2-hour glucose ≥7.8 mmol/L and <11.1 mmol/L.4
Determination of insulin resistance status (two methods)
Method 1: Matsuda Index:17
As Matsuda Index decreases, IR increases. IR, as a diagnostic category, was defined as values below the threshold of the lowest quartile for our population distribution of Matsuda Index (≤2.98).
Method 2: Homeostatic model assessment of insulin resistance (HOMA-IR):18
As HOMA-IR increases, IR increases. IR using HOMA-IR was defined as the cut-off of the highest quartile of our population distribution for HOMA-IR (≥2.07).
Measurement of insulin secretion (two methods)
Method 1: the Insulin Secretion Index (ISI)= .19
.19
Method 2: HOMA-β =  .18
.18
Assessment of β-cell compensation
Beta-cell compensation, assessed by the Disposition Index (DI), is a measure of β-cell function adjusted for insulin sensitivity.5 It is the product of insulin secretion and insulin sensitivity.5 The formula for oral-DI using Matsuda Index is: (ISI)×(Matsuda Index). The formula for oral-DI using HOMA-IR is: (HOMA-β)×(1/HOMA-IR).
Group assignment by glucose tolerance and insulin resistance status
Four groups were created by categorizing the participants in two ways: presence or absence of Abnl-GT and presence or absence of IR (online supplemental figure 1).
Supplemental material
Group 1: normal glucose tolerant (NGT-reference)
This group had NGT and were insulin-sensitive (Matsuda Index >2.98).
Group 2: NGT and insulin-resistant (NGT-IR)
This group had NGT and were insulin-resistant (Matsuda Index ≤2.98).
Group 3: Abnl-GT and insulin-resistant (Abnl-GT-IR)
This group had Abnl-GT and were insulin-resistant (Matsuda Index ≤2.98).
Group 4: Abnl-GT and β-cell failure (Abnl-GT-β-cell failure)
The group was defined as having β-cell failure because Abnl-GT occurred in the absence of IR (Matsuda Index >2.98). A specific insulin concentration was not required.
Behavioral and social demographics
Data on smoking, alcohol intake, health insurance status, income, college graduation rate and duration of US residence were available for all participants. Information on exercise status was available in 281 consecutively enrolled individuals. Exercise was determined by International Physical Activity Questionnaire categories and dichotomized as sedentary (IPAQ Category Low) or active (IPAQ Category Moderate or High).20 Fruit and vegetable consumption data were available in 243 consecutively enrolled individuals. Information on reason for immigration was available in 207 consecutively enrolled individuals who came to the USA at 18 years or older. High stress reasons for immigration were coming to the USA for work or seeking asylum/refugee status.12 Low stress reasons for immigration were coming to the USA for education, family reunification or the diversity lottery.12
Assays
Hemoglobin and hematocrit were measured in EDTA-anticoagulated whole blood (Sysmex XE-5000).12 Insulin was measured in serum and glucose, cholesterol, TG, HDL in plasma using a Roche Cobas 6000 analyzer (Roche Diagnostics, Indianapolis, Indiana). LDL was calculated using the Friedewald equation.21 A1C values were determined by HPLC using National Glycohemoglobin Standardization Program-certified instruments manufactured by BioRad Laboratories (Hercules, California, USA). Size of HDL and LDL particles were determined by NMR using the Lp3 algorithm on the Vantera Analyzer (LabCorp, Burlington, North Carolina, USA).
Statistical analyses
Unless stated otherwise, data are presented as mean±SD. Comparisons to the NGT-Reference Group were adjusted by multiple regression for age. One-way analysis of variance with Tukey’s test for multiple comparisons were used to compare the three African regions of origin (online supplemental table 1). Unpaired t-tests were used to compare the two groups with Abnl-GT. Categorical variables were compared by χ2 and the Dunn test. Area under the curve for glucose (AUC-glucose) was calculated using the trapezoidal rule. P values ≤0.05 were considered statistically significant. Analyses were performed with STATA V.16 (College Station, Texas, USA).
Results
The regional distribution in Africa of the countries of birth of the participants were: West (52%, 250/486), Central (18%, 91/486), East (29%, 141/486) and South (1%, 4/486). The four people born in Southern African countries were analyzed with the Central African group (online supplemental table 1). Consistent with known immigration patterns, most of the participants were male and from West Africa.22 23 The prevalence of sickle cell trait and hemoglobin C trait were higher in West and Central Africans than East Africans.
There was no difference by African region of origin in either the prevalence of Abnl-GT or the prevalence of Abnl-GT due to β-cell failure (online supplemental table 1). In addition, BMI, WC, VAT, FPG, 2-hour glucose, AUC-glucose and A1C did not differ by African region of origin. As these are our variables of interest, the cohort of 486 was analyzed as a single group.
Group prevalence
Group 1: NGT-reference 52% (252/486).
Group 2: NGT-IR 11% (52/486).
Group 3: Abnl-GT-IR 14% (69/486).
Group 4: Abnl-GT-β-cell failure 23% (113/486).
The ages of the participants in the four groups were: 36±10, 36±8, 42±9, 42±10 years, respectively (table 1). As the groups with Abnl-GT (groups 3 and 4) were significantly older than the NGT-reference (group 1) (both p<0.001), comparisons were adjusted for age (table 1, figures 1 and 2).
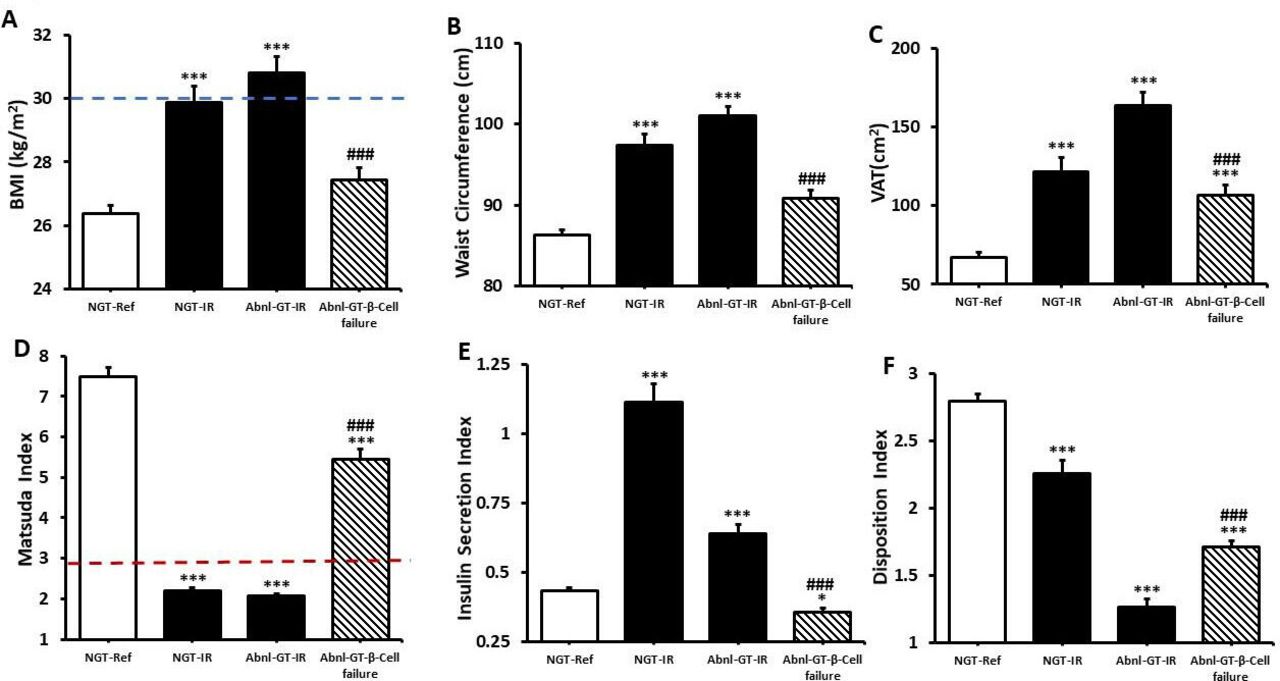
Phenotype and glucometabolic parameters by glucose tolerance group. (A) Body mass index (BMI), (B) waist circumference, (C) visceral adipose tissue (VAT), (D) Matsuda Index, (E) Insulin Secretion Index, (F) Disposition Index. In each panel, the four bars in sequence represent: normal glucose tolerant-reference (NGT-Ref), NGT-insulin resistant (NGT-IR), abnormal glucose tolerance-insulin resistant (Abnl-GT-IR), Abnl-GT-β-cell failure. Raw data are presented as mean±SE. Asterisks are for differences adjusted for age and are in comparison to NGT-reference. *p≤0.05, **p≤0.01, ***p≤0.001. Hashtags are for differences between the two groups with Abnl-GT. #p≤0.05, ##p≤0.01, ###p≤0.001. The blue dash line in panel A demarcates the BMI threshold for obesity (BMI ≥30 kg/m2). The red dash line in panel D demarcates insulin resistance (Matsuda Index ≤2.98).
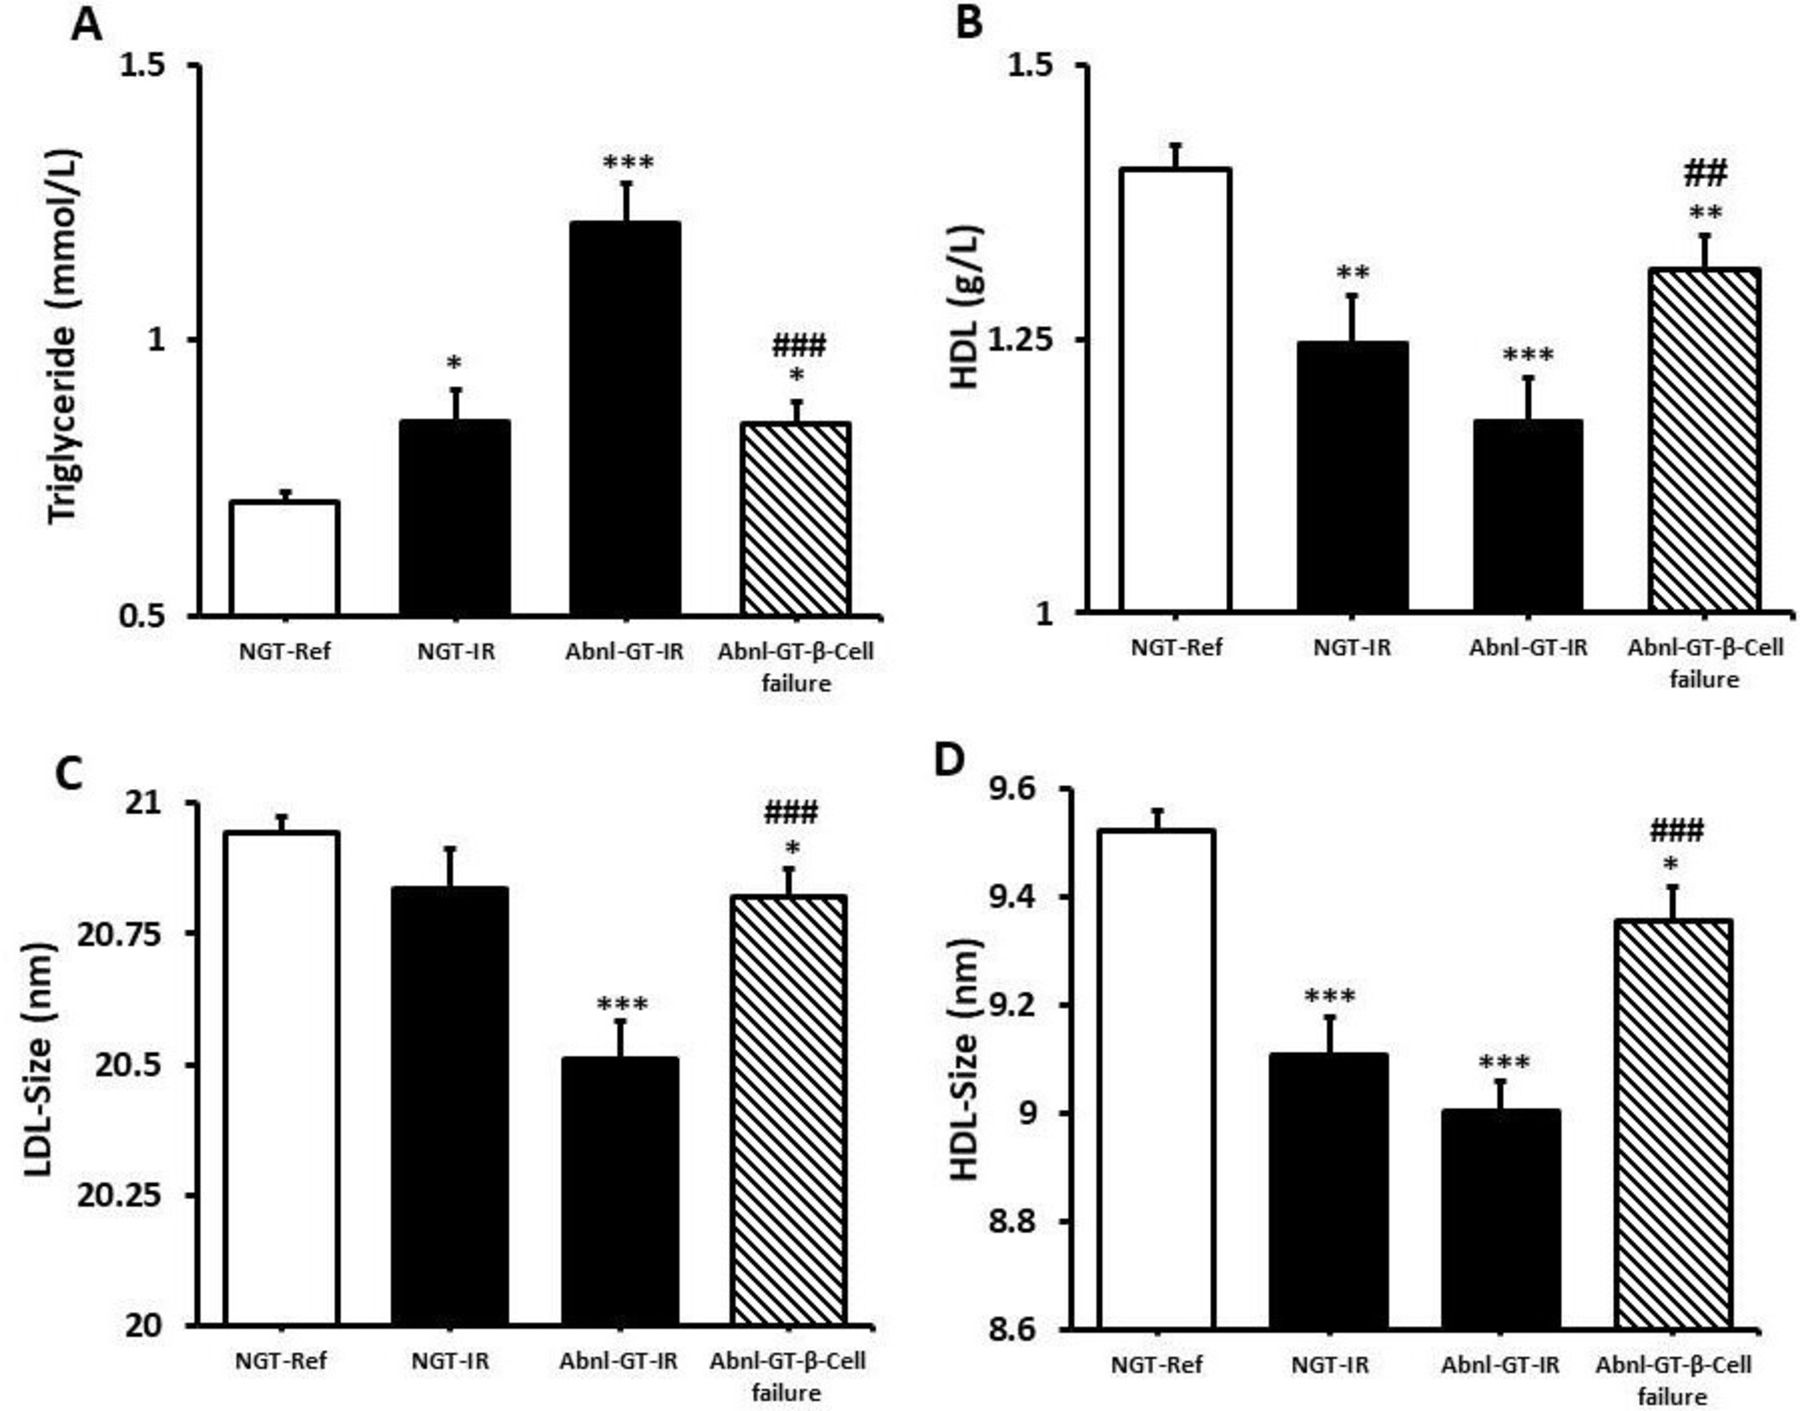
Lipid parameters by glucose tolerance group. (A) Triglyceride, (B) high-density lipoprotein (HDL), (C) low-density lipoprotein (LDL)-size, (D) HDL-size. In each panel, the four bars in sequence represent: normal glucose tolerant-reference (NGT-Ref), NGT-insulin resistant (NGT-IR), abnormal glucose tolerance-insulin resistant (Abnl-GT-IR), Abnl-GT-β-cell failure. Raw data are presented as mean±SE. Asterisks are for differences adjusted for age and are in comparison to NGT-reference. *p≤0.05, **p≤0.01, ***p≤0.001. Hashtags are for differences between the two groups with Abnl-GT. #p≤0.05, ##p≤0.01, ###p≤0.001.
Population characteristics according to glucose tolerance group
Body size parameters
BMI was higher in the two IR groups than the reference group (both p<0.001) (figure 1A, table 1). Whereas BMI did not differ in the NGT-reference and Abnl-GT-β-cell failure groups (p=0.321). The prevalence of obesity in groups 1, 2, 3 and 4 was: 18%, 50%, 52% and 19%, respectively. Obesity prevalence was higher in the IR groups than the reference group (both p<0.001) but did not differ between the NGT-reference and Abnl-GT-β-cell failure groups (table 1). In contrast, VAT was higher in groups 2, 3 and 4 than the reference group (NGT-reference) (all p<0.001).
BMI, WC and VAT were lower in the Abnl-GT-β-cell failure group than the Abnl-GT-IR group (all p<0.001) (table 1 and figure 1A–C).
Glucose metabolism
Results from the Matsuda Index and ISI are reported in the main paper (table 1, figures 1–2) and for HOMA-IR and HOMA-β in online supplemental table 2. Independent of whether IR was measured by Matsuda Index or HOMA-IR or insulin secretion was assessed by the ISI or HOMA-β, the results were similar.
Matsuda Index was lower in groups 2, 3 and 4 than group 1 (all p<0.001) (figure 1D, table 1). While the Abnl-GT-β-cell failure group had a significantly lower Matsuda Index than the NGT-reference group, the degree of IR in the Abnl-GT-β-cell failure group was considered minimal as the criterion for IR was not met (Matsuda Index ≤2.98).
Insulin secretion was higher in the two groups with IR than the NGT-reference group both p<0.001) (figure 1E, table 1). In contrast, insulin secretion was lower in the Abnl-GT-β-cell failure group versus the NGT-reference group (0.64±0.29 vs 0.36±0.15, p<0.05, figure 1E).
DI was significantly lower in groups 2, 3 and 4 than the NGT-reference group (all p<0.001) (figure 1F, table 1). However, compared with the Abnl-GT-IR group, the Abnl-GT-β-cell failure group had a higher Matsuda Index, lower ISI and higher DI (all p<0.001, figure 1D–F, table 1).
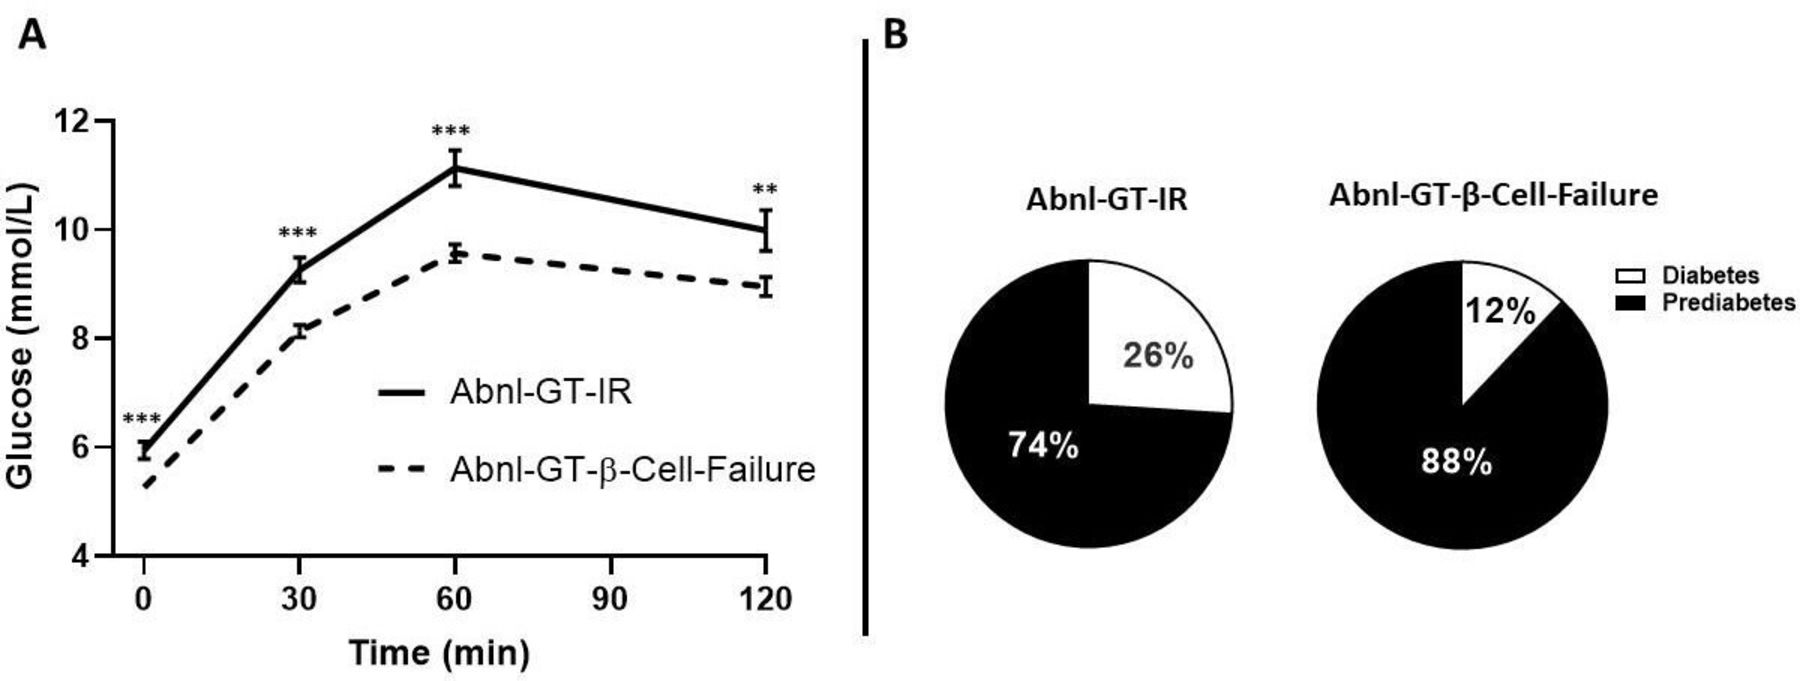
Degree of glycemia as measured by FPG, 2-hour glucose, AUC-glucose and A1C was higher in the two groups with Abnl-GT than the NGT-reference group (all p<0.01 to p<0.001) (table 1). Additionally, except for A1C, all these measures were lower in the Abnl-GT-β-cell failure than the Abnl-GT-IR group (all p<0.01 to p<0.001) (table 1, figure 3A). When the Abnl-GT groups were subdivided into its two components, diabetes and prediabetes, the prevalence of diabetes was also lower in Abnl-GT-β-cell failure group than the Abnl-GT-IR group (26% vs 12%, p<0.01) (figure 3B).
Glucose concentrations and diabetes prevalence in the abnormal glucose tolerance-insulin resistant (Abnl-GT-IR) and Abnl-GT-β-cell failure groups. (A) Glucose concentrations at each timepoint during the oral glucose tolerance test. (B) Prevalence of diabetes and prediabetes in each group. *p≤0.05, **p≤0.01, ***p≤0.001.
Diagnostic value of FPG versus 2-hour glucose in the Abnl-GT groups
Elevated 2-hour glucose (≥7.8 mmol/L) with normal FPG (<5.6 mmol/L) occurred with greater frequency in the Abnl-GT-beta-cell failure group than the Abnl-GT-IR group, 68% (77/113) vs 35% (24/69), p<0.001, respectively.
Lipid profiles
TG, HDL, apolipoprotein B, LDL-size and HDL-size were more adverse in groups 2, 3 and 4 than the NGT-reference (table 1, figure 2). However, when the Abnl-GT-β-cell failure and Abnl-GT-IR groups were compared, the lipid parameters most closely linked to IR were more optimal in the Abnl-GT-β-cell failure than the Abnl-GT-IR group. Specifically, TG was lower, and HDL, LDL-size and HDL-size were higher in the Abnl-GT-β-cell failure group (p<0.01 to p<0.001) (figure 2).
BMI categories in the Abnl-GT-IR and Abnl-GT-β-cell failure groups
The prevalence of obesity was lower in the Abnl-GT-β-cell failure group than the Abnl-GT-IR group (52% vs 19%, p<0.001) (table 1).
Behavioral and social characteristics
Sedentary behavior was more common in the two groups with IR than the NGT-reference and Abnl-GT-β-cell failure groups (both p<0.01) (online supplemental table 3). Fruit and vegetable intake tended to be lower in the two IR groups than the NGT-reference and Abnl-GT-β-cell failure groups (p=0.158). However, smoking and alcohol use did not vary by group, nor did the social variables of health insurance, income, reason for immigration or duration of residence in the USA.
Discussion
This is the first study to examine in Africans whether the prevalence, phenotype and metabolic characteristics of Abnl-GT differs if the main etiological determinant is β-cell failure rather than IR. Our main finding was that two-thirds of Africans with Abnl-GT had β-cell failure and only one-third had IR. In addition, compared with Africans with Abnl-GT due to IR, Africans with Abnl-GT-β-cell failure had (a) a lower prevalence of obesity and less VAT; (b) less severe hyperglycemia and (c) a better lipid profile.
Prevalence and etiology of β-cell failure
Beta-cell failure was defined as Abnl-GT in the absence of IR. As previously stated, β-cell failure occurred in two-thirds of Africans with Abnl-GT and IR in only one-third. In the Abnl-GT-β-cell failure group, insulin secretion was lower than in the NGT-reference group (figure 1E); however, insulin was still present, and ketoacidosis was not. Therefore, type 1 diabetes is unlikely, but a definitive diagnosis would require anti-islet cell antibodies.
Overall, our data contribute to an increasing awareness of β-cell failure as an important cause of hyperglycemia in Africans.24 Furthermore, β-cell failure in low-income countries is emerging globally as an important cause of Abnl-GT and is particularly well characterized in Asian Indians.10
Our observation that β-cell failure was more common than IR in African-born blacks in the USA differs from conclusions made by Research on Obesity and Diabetes in African Migrants investigators about the major cause of hyperglycemia in first-generation and second-generation Ghanaians living in Amsterdam, Berlin and London.25 Meeks et al reported that IR rather than β-cell failure was the predominant etiology of hyperglycemia in Ghanaian immigrants living in Europe.25 While there could be many complex reasons for this difference including epigenetic differences, one quantifiable reason is methodologic. Meeks et al relied on FPG to diagnose hyperglycemia rather than the OGTT.25 FPG underestimates the number of people with hyperglycemia and this problem is magnified in the presence of β-cell failure. In our study, elevated 2-hour glucose (≥7.8 mmol/L) with normal FPG (<5.6 mmol/L) was twice as common in the Abnl-GT-β-cell failure group than the Abnl-GT-IR group. Working in Kenya, Christensen et al also found that relying on FPG rather than 2-hour glucose post-OGTT led to a significant underestimation of the number of Africans with hyperglycemia.26
The etiology of β-cell failure in Africans is complex and includes genetic, infectious and nutritional factors.27–30 For example, a genome-wide analysis of type 2 diabetes in 5231 Nigerians, Ghanaians and Kenyans was performed and an African-specific locus, ZRANB3, associated with β-cell mass and insulin response was discovered.27 In addition, pancreatic infection by human herpesvirus 8 (HHV-8) may be implicated.29 Analyzing the antibody profile of a cohort of African-born blacks who were living in France and had a history of both transient hypoinsulinemia and ketosis-prone diabetes, Sobngwi et al found that the rate of exposure to HHV-8 was unexpectedly high.29 In addition, food shortages due to war or natural disasters have occurred in Africa.6 At any time in the life-cycle, exposure to undernutrition can lead to damage to β-cell development and function.28 30 31 Furthermore, epigenetic changes may occur in response to malnutrition and lead to compromised β-cell function in future generations.28
Insulin resistance
Both groups with Abnl-GT were more IR than the NGT-reference group and, this is closely linked to the observation that both Abnl-GT groups had higher VAT volume than the NGT-reference group.32 IR affects the lipid profile and therefore, both groups with Abnl-GT had higher TG concentrations and lower HDL, HDL-size and LDL-size than the NGT-reference group. However, the group with Abnl-GT- β-cell failure had only minimal IR (Matsuda Index >2.98) and all four lipid parameters were less adverse in the β-cell failure group than the IR group (all p<0.01, table 1, figure 2). Based on their lipid profiles, the risk for cardiovascular disease may be lower in the Abnl-GT-β-cell failure group than the Abnl-GT-IR group.
Similar to the lipid profile, both groups with Abnl-GT had more hyperglycemia than the NGT-reference group (figure 3A), but the degree of hyperglycemia as measured by FPG, 2-hour glucose and AUC-glucose curve was lower in the Abnl-GT-β-cell failure group than the Abnl-GT-IR group (all p<0.01, figure 3, table 1). As the participants enrolled in the β-cell failure group with Abnl-GT had lower glucose concentrations than the participants in the IR group with Abnl-GT, we speculate that progression from prediabetes to diabetes could be slower in the Abnl-β-cell failure group than the Abnl-GT-IR group. In support of this hypothesis, we note that the prevalence of diabetes was lower in the Abnl-GT-beta-cell failure group than the Abnl-GT-IR group (12% vs 26%, p<0.01) (figure 3B).
Beta-cell compensation
Beta-cell compensation, represented by the DI, is a measure of insulin secretion adjusted for IR.5 There is an inverse relationship between DI and the risk of progression to diabetes.5 In our study, the Abnl-GT-β-cell failure group had higher DI than the Abnl-GT-IR group (figure 1F). This occurred because even though the Abnl-GT-β-cell failure group had lower insulin concentrations than the NGT-reference group, they only had minimal IR (Matsuda Index >2.98). Our work with β-cell failure, lower VAT and higher DI mirrors the observations of Christensen et al in their work with the Luo and Kamba tribes in Kenya.33
BMI of risk
As BMI is often used in screening paradigms to decide who should undergo testing for asymptomatic hyperglycemia, decisions regarding the BMI of risk have public health implications. The BMI of risk may vary by race, ethnicity and country of origin. In contrast to high-income countries, in low-income and middle-income countries in Africa and elsewhere, diabetes in non-obese populations is common.9 For example, in a study of diabetes conducted in Eastern Ethiopia, 60% of the people with diabetes were normal weight, 27% were overweight, while only 6% were obese.34 Interestingly, another 6% were underweight. In a study conducted in rural Ghana, 50% of the people with diabetes were normal weight.35
In our study, the prevalence of obesity in the Abnl-GT-β-cell failure group was lower than in the Abnl-GT-IR group (52% vs 19%, p<0.01). Therefore, if the criteria for screening or lifestyle intervention were set at BMI of ≥30 kg/m2, the Abnl-GT-β-cell failure group would be disproportionately affected.
Behavioral and social factors
Behavioral factors and stress triggered by psychosocial and economic status can activate the hypothalamic-pituitary-adrenal and sympathetic-medullary-adrenal axes and promote the development of diabetes or cardiovascular disease.12 Therefore, it was important to determine if any of the differences between the Abnl-GT-IR and Abnl-GT-β-cell failure groups were confounded by behavioral or socioeconomic factors. The only difference we could detect was related to exercise. Sedentary behavior was more common in both groups with IR than the NGT-reference group but did not differ in the two groups with Abnl-GT. As there were no significant differences in alcohol intake, smoking, educational attainment, income or biographical factors, such as reason for immigration or duration of US residence, differences in the prevalence and etiology of diabetes in the two groups with Abnl-GT cannot be attributed to social rather than biological factors.
Strengths and limitations
This study of African immigrants has both strengths and weaknesses. A major strength is that IR was determined by both Matsuda Index and HOMA-IR and insulin secretion was determined by both the Insulinogenic Index and HOMA-β. As the results were similar, we confirmed that the use of HOMA-IR and HOMA-β in studies of Africans will provide quality results. Furthermore, as HOMA-IR is widely used in epidemiological studies, we could compare the threshold value we used for IR by HOMA-IR with similar assessments in National Health and Nutrition Examination Survey (NHANES), Jackson Heart Study and Pathobiology of Prediabetes in a Biracial Cohort (POP-ABC).36–38 Our threshold for IR at value for HOMA-IR ≥2.07 was consistent with these studies.
Another strength is the measurement of VAT, which is an important physiological correlate of IR. The Abnl-β-cell failure group had less IR, and a better lipid profile than the Abnl-GT-IR group and this may be because the Abnl-β-cell failure group had less VAT. VAT promotes IR through multiple pathways including providing free fatty acids (FFA) substrate for hepatic production of TG and energy for the hepatic production of glucose.32
In addition, when we examined the dyslipidemia of IR, we relied on TG and HDL and on LDL-size and HDL-size.
Limitations of our study include the use of a convenience sample. But even though we used a convenience sample, there are reasons to feel confident that our cohort is representative of African-born blacks. First, consistent with known immigration patterns, the majority of the participants were men from West Africa.22 39 Second, as both sickle cell trait and hemoglobin C trait were more commonly observed in West and Central Africa than East Africa, the size of the cohort was sufficient to detect known genetic differences by African region of origin. Third, in contrast to the USA, the Canadian government collects data on the prevalence of diabetes in immigrants by country of origin.40 In our cohort, the prevalence of diabetes was 7% and this is similar to the 8% prevalence of diabetes reported in African-born blacks living in Canada.40
In addition, we did not have access to islet-cell antibodies. Therefore, we cannot prove the participants with β-cell failure did not have type 1 diabetes. However, while our participants with β-cell failure had lower than normal insulin secretion, insulin secretion was still present. In addition, all participants felt well and had no current or past history of diabetic ketoacidosis.
A challenge with our analyses of physical activity and dietary intake is that the data were collected by questionnaires. In short, both variables were not measured directly and therefore, subject to recall bias.
This is a cross-sectional study, but we do not consider this to be a limitation. Our study established the principle that in African immigrants it is important to determine the presence of Abnl-GT and the etiology, specifically β-cell failure versus IR. Our study can now be used for pilot data and sample size calculations in the design of both prospective studies and lifestyle interventions for Africans in the USA and the African continent. Having determined that β-cell failure is a frequent determinant of Abnl-GT in Africans, it is critical to determine if the clinical course and optimal interventions for Abnl-GT varies by etiology. Furthermore, we are cost-conscious and we proved that HOMA-IR and HOMA-β provided similar results to the more expensive Matsuda Index and ISI.
Conclusions
Beta-cell failure is a common cause of Abnl-GT in Africans. Overall, both the prevalence of obesity and the metabolic consequences, including degree of hyperglycemia and lipid profile, were more favorable in the β-cell failure group than the IR group. As screening paradigms for Abnl-GT tend to focus on risk factors related to IR, it is likely that Africans with Abnl-GT due to β-cell failure are diagnosed later in the course of their disease, when opportunities for maintaining or improving β-cell function are less viable. Furthermore, interventions such as degree of weight loss, exercise, nutrient quality and caloric intake, which reverse or prevent progressive disease in Africans with Abnl-GT due to IR and β-cell failure may differ. In short, to understand the prognosis and optimize interventions, for African-born blacks living in the diaspora and on the African continent, there must be prospective studies with the etiology of Abnl-GT determined at baseline.
Data availability statement
Data are available upon reasonable request.
Ethics statements
Patient consent for publication
Ethics approval
The study was approved by the NIDDK Institutional Review Board. Prior to enrollment, written informed consent was obtained (reference number on October 8, 2020 was 548142).
References
Footnotes
MCSI and AW are joint first authors.
Presented at This study was presented in abstract form at the American Diabetes Association 81st Scientific Sessions, June 2021.
Contributors MCSI, AW and AES did the literature search. MCSI, AW and AES designed the study. MCSI, EMS, NHO-T, TH, CWD, LSM and AES contributed to enrollment. MCSI, AW, EMS, NHO-T, TH, ACP, HB, CWD, LSM and AES collected the data. MSCI, AW, NHO-T, TH, EMS, JH, AS and AES analyzed the data. MCSI, AW and AES made the figures. MCSI, AW and AES wrote the first draft. MCSI, AW, EMS, NHO-T, TH, ACP, HB, CWD, LSM, JH, AS and AES provided critical rewrites of the manuscript. AES is the guarantor of this work and had full access to all the data in the study and takes responsibility for the integrity of the data and the accuracy of the data analysis.
Funding The study was funded by the intramural research program of two NIH institutes: NIDDK, NIMHD and the NIH Clinical Center. MCSI and AES are supported by the intramural programs of both NIDDK and NIMHD. MCSI is also supported by the University of Global Health Equity, Rwanda. AW, EMS, NHO-T, TH, ACP, HB, CWD, LSM, JH and AS are supported by the intramural program of NIDDK. HB is supported by the NIH Clinical Center.
Competing interests None declared.
Provenance and peer review Not commissioned; externally peer reviewed.
Supplemental material This content has been supplied by the author(s). It has not been vetted by BMJ Publishing Group Limited (BMJ) and may not have been peer-reviewed. Any opinions or recommendations discussed are solely those of the author(s) and are not endorsed by BMJ. BMJ disclaims all liability and responsibility arising from any reliance placed on the content. Where the content includes any translated material, BMJ does not warrant the accuracy and reliability of the translations (including but not limited to local regulations, clinical guidelines, terminology, drug names and drug dosages), and is not responsible for any error and/or omissions arising from translation and adaptation or otherwise.