Article Text

Abstract
Introduction We sought to investigate the relationship between serum 25-hydroxyvitamin D (25(OH)D) level and the risk of type 2 diabetes mellitus (T2DM) in adults who participated in the Trøndelag Health Study (HUNT), and the possible effect modification by family history and genetic predisposition.
Research design and methods This prospective study included 3574 diabetes-free adults at baseline who participated in the HUNT2 (1995–1997) and HUNT3 (2006–2008) surveys. Serum 25(OH)D levels were determined at baseline and classified as <50 and ≥50 nmol/L. Family history of diabetes was defined as self-reported diabetes among parents and siblings. A Polygenic Risk Score (PRS) for T2DM based on 166 single-nucleotide polymorphisms was generated. Incident T2DM was defined by self-report and/or non-fasting glucose levels greater than 11 mmol/L and serum glutamic acid decarboxylase antibody level of <0.08 antibody index at the follow-up. Multivariable logistic regression models were applied to calculate adjusted ORs with 95% CIs. Effect modification by family history or PRS was assessed by likelihood ratio test (LRT).
Results Over 11 years of follow-up, 92 (2.6%) participants developed T2DM. A higher risk of incident T2DM was observed in participants with serum 25(OH)D level of<50 nmol/L compared with those of ≥50 nmol/L (OR 1.72, 95% CI 1.03 to 2.86). Level of 25(OH)D<50 nmol/L was associated with an increased risk of T2DM in adults without family history of diabetes (OR 3.87, 95% CI 1.62 to 9.24) but not in those with a family history (OR 0.72, 95% CI 0.32 to 1.62, p value for LRT=0.003). There was no effect modification by PRS (p value for LRT>0.23).
Conclusion Serum 25(OH)D<50 nmol/L was associated with an increased risk of T2DM in Norwegian adults. The inverse association was modified by family history of diabetes but not by genetic predisposition to T2DM.
- epidemiology
- vitamin D
- genetic predisposition to disease
This is an open access article distributed in accordance with the Creative Commons Attribution Non Commercial (CC BY-NC 4.0) license, which permits others to distribute, remix, adapt, build upon this work non-commercially, and license their derivative works on different terms, provided the original work is properly cited, appropriate credit is given, any changes made indicated, and the use is non-commercial. See: http://creativecommons.org/licenses/by-nc/4.0/.
Statistics from Altmetric.com
Significance of this study
What is already known about this subject?
Lower serum 25-hydroxyvitamin D (25(OH)D) level is associated with an increased risk of type 2 diabetes in adults.
What are the new findings?
Lower serum 25(OH)D level is associated with an increased risk of type 2 diabetes in adults without family history of diabetes.
The association between serum 25(OH)D level and risk of type 2 diabetes is not modified by the Polygenic Risk Score that represents genetic predisposition to type 2 diabetes.
How might these results change the focus of research or clinical practice?
Our findings suggest that keeping a sufficient vitamin D level might reduce the risk of type 2 diabetes mellitus among individuals who do not have a family history of diabetes.
Introduction
More than 400 million people live with diabetes nowadays and the number of prevalent cases is projected to rise to 642 million by 2040.1 Among them, approximately 90% have type 2 diabetes mellitus (T2DM), which is one of the top 10 leading causes of death globally.2 The number of deaths due to T2DM has been dramatically increasing in the most populous countries, such as India, China and Indonesia.2
T2DM is a result of the interplay among lifestyle, environmental and genetic factors.1 Adiposity and physical inactivity are the most important modifiable factors.3 4 Other behavioral risk factors include smoking habits and dietary patterns.5 6 Observational studies have investigated the relationship between serum 25-hydroxyvitamin D (25(OH)D) level and the risk of T2DM,7–10 but the relationship has not been explored in populations stratified by family history of diabetes or genetic predisposition to T2DM.
There is compelling evidence that the individual risk of T2DM is strongly influenced by genetic factors.11–13 A recent meta-analysis study that combined data from 32 genome-wide association studies (GWAS) provided new insight into this complex disorder by identifying 243 susceptibility loci in European-descent individuals.11 In the latest multiancestry meta-analysis, Vujkovic et al further identified 318 new risk loci in 1.4 million participants.13 These loci are related to genes that mostly influence energy metabolism and regulation of insulin secretion. Family history of diabetes has been used as a proxy for genetic predisposition.14 15 The reported family history of diabetes was associated with diagnosed diabetes, undiagnosed diabetes and pre-diabetes.15 16
The aim of the current study was to investigate the relationship between serum 25(OH)D level and the risk of T2DM in adults who participated in the Trøndelag Health Study (HUNT) with an 11-year follow-up. We also evaluated possible effect modification by family history of diabetes and genetic predisposition to T2DM on this relationship.
Methods
Study design and population
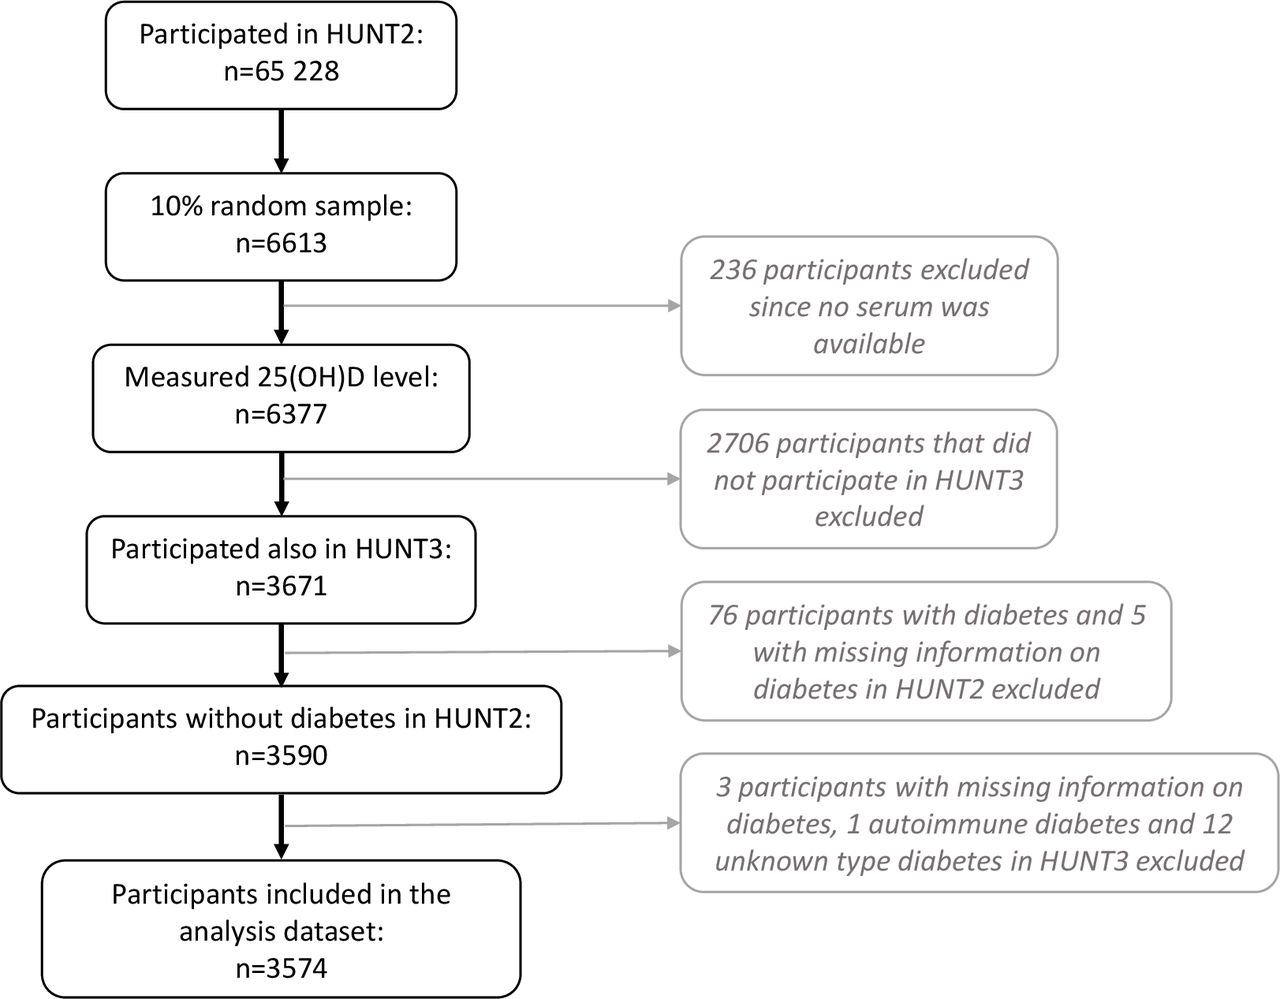
HUNT is one of the largest collections of health data in Norway.17 The study has enrolled about 123 000 participants aged 20 years or older in four surveys: HUNT1 (1984–1986), HUNT2 (1995–1997), HUNT3 (2006–2008) and HUNT4 (2017–2019). In this study, we linked data from HUNT2 (n=65 228) to HUNT3 for an average 11-year follow-up. Of the participants in HUNT2, a 10% random sample (n=6613) was selected for measurement of serum 25(OH)D levels. Baseline levels were established for participants with sufficient blood sample volume (n=6377). Among them, 3671 participated in HUNT3 (participation rate 57.6%). The final analysis dataset included 3574 participants without diabetes at baseline and with complete information on classification of T2DM in HUNT3. Figure 1 presents a flowchart outlining the selection process of the analysis dataset.
Flowchart of selection process for the analytical sample in HUNT. Analytical sample comprised participants who participated in HUNT2 and HUNT3, with complete data on serum 25(OH)D, without diabetes at baseline and with complete information for classification of T2DM in HUNT3. HUNT, Trøndelag Health Study; 25(OH)D, 25-hydroxyvitamin D; T2DM, type 2 diabetes mellitus.
Measurement of serum 25(OH)D level
Blood samples collected in HUNT2 were stored at −80°C. LIAISON 25-OH vitamin D TOTAL (DiaSorin, Saluggia, Italy) was used to measure serum 25(OH)D levels. It is a fully automated antibody-based chemiluminescence assay. The detection range of the assay is 10–375 nmol/L. A cosinor model based on month of blood draw was used to calculate season-standardized 25(OH)D level (nmol/L) in order to reduce the effect of seasonal fluctuations due to the high-latitude geographical position of Trøndelag, Norway (latitude 63.5° N). The cosinor model fits a linear regression in which the 25(OH)D measurements are regressed onto sine and cosine terms of transformations of the time variable that is the month of blood draw. The terms give a linear representation of a sine curve with amplitude and a phase, which can be used to describe a seasonal pattern of the study sample.18 The season-standardized 25(OH)D was calculated using the package cosinor V.1.1 in R V.3.6.3. This season-standardized 25(OH)D level represents the annual average value of serum 25(OH)D for each participant. The season-standardized 25(OH)D levels were treated as a continuous variable as well as a categorical variable of two categories (<50 and ≥50 nmol/L) based on the widely accepted definition of vitamin D insufficiency.19
Information on covariates
Baseline variables were collected by questionnaires or at clinical examination in HUNT2. Sociodemographic variables included age (as a continuous variable), sex (female or male), years of education (<10, 10–12, and ≥13 years), and economic difficulties in the past year (yes or no). Body mass index (BMI) was calculated as weight divided by the square value of height and was used as a continuous variable (kg/m²). Lifestyle factors included daily smoking (never, former, and current), frequency of alcohol consumption per month (never, 1–4 times, or ≥5 times), level of physical activity (inactive, low, moderate, or high), and average hours of sitting time per day as a marker for sedentary behavior (≤4, 5–7, and ≥8). Family history of diabetes was identified by asking the following question concerning the participant’s relatives (mother, father, sister, and brother): ‘Do they have or have they had diabetes?’ (yes or no). Chronic diseases were determined by the question ‘Do you suffer from any long-term illness or injury of a physical or psychological nature that impairs your functioning in your everyday life?’ (yes or no). Participants with missing information on education, economic difficulties, smoking, alcohol consumption, physical activity, sitting time per day, family history of diabetes or history of chronic diseases were regarded as an ‘unknown’ category for each variable and included in the primary analyses. The same categorization of covariates has been used in previous HUNTs.20 21
Polygenic Risk Score (PRS) for T2DM
Approximately 72 000 participants in HUNT were genotyped and single-nucleotide polymorphisms (SNPs) were imputed, which was described elsewhere.22 The latest T2DM GWAS of European ethnicity by Mahajan et al identified 403 SNPs.11 These SNPs were further refined by excluding variants that were identified after adjustment for BMI only and by pruning out variants that were in linkage disequilibrium (R2>0.001), leaving 167 SNPs that were independently associated with T2DM.23We generated a PRS for T2DM based on 166 of the 167 SNPs (information on rs601945 is unavailable in HUNT). Detailed information about the 166 T2DM-associated SNPs is presented in online supplemental table 1. The risk allele was coded as 1 and the non-risk allele as 0. The PRS for each participant was calculated by multiplying the dose of risk allele by the weight and summing across the 166 SNPs.24 The weights are effect sizes derived from the GWAS results of Mahajan et al.11
Supplemental material
T2DM incidence
Participants were defined as having diabetes if they answered yes to a question: ‘Have you had or do you have diabetes?’ and/or had a non-fasting blood glucose level above 11 mmol/L. Participants with incident diabetes were those who were free of diabetes at baseline and developed diabetes between HUNT2 and HUNT3. The questionnaire-based diabetes diagnoses in HUNT have been validated by comparing with medical records and verified in 96% of the cases.25 Autoimmune and type 2 diabetes were defined based on the values of serum glutamic acid decarboxylase antibodies (GADA).26 Antibody levels are expressed as an antibody index (ai) relative to a standard serum. The incident cases were classified as autoimmune diabetes if the value of GADA is ≥0.08 ai (n=1 who was excluded from the analysis cohort) and as T2DM if the value of GADA is <0.08.26 We then calculated the 11-year risk (cumulative incidence) of T2DM.
Statistical analysis
The relationship between serum 25(OH)D and the 11-year risk of T2DM was evaluated using logistic regression models. Crude and adjusted ORs with 95% CIs were estimated. The multivariable regression analysis was performed to control for potential confounders including age, sex, education, economic difficulties, BMI, smoking status, alcohol consumption, physical activity, sitting time per day, family history of diabetes and chronic diseases. These covariates were selected a priori as potentially important confounders in the adjusted model.3–5 The 25(OH)D level of ≥50.0 nmol/L was used as the reference group.
The possible association between 25(OH)D level and the risk of T2DM was also evaluated in strata by family history of diabetes (yes and no categories) or by PRS for T2DM as a binary variable using different cut-off values. Potential effect modification by family history or PRS on the association was assessed by the likelihood ratio test (LRT), and a p value of <0.05 was considered significant.
Multiple imputation was used to address possible bias due to missing data of the covariates, assuming missing at random. As missing data in the analysis dataset were around 10%, 10 imputations were performed to follow the recommendations.27 All statistical analyses were performed with STATA/MP V.16.
Results
Baseline characteristics of the study population
The study population was more represented by women than men (54.7% vs 45.3%), with approximately the same distribution within the two categories of serum 25(OH)D level (table 1). More participants had a baseline serum 25(OH)D level of <50 nmol/L than ≥50 nmol/L (57.6% vs 42.4%). Study participants at baseline were 46.6 years old on average; they were relatively older in the 25(OH)D≥50 nmol/L group compared with the 25(OH)D<50 nmol group (mean age 47.9 vs 45.7 years). Compared with those with 25(OH)D levels≥50 nmol/L, the study participants with a level <50 nmol/L had a higher average BMI value and greater proportions of the following characteristics: <10 years of education, current smoker, alcohol abstainer, little physical activity and economic difficulties. There was no clear pattern for the distribution of chronic diseases, family history of diabetes or PRS for T2DM between the two 25(OH)D categories.
Baseline characteristics of participants overall and by baseline serum 25(OH)D levels in the HUNT2 survey, 1995–1997
Serum 25(OH)D level and the risk of T2DM
A total of 92 (2.6%, of which one did not report having diabetes but had a non-fasting blood glucose level above 11 mmol/L) participants were identified to have developed T2DM during the 11-year follow-up period (table 2). The 11-year risk of T2DM was 3.3% in the 25(OH)D<50.0 nmol/L group compared with 1.7% in the ≥50.0 nmol/L group. A 72% (95% CI 1.03 to 2.86) higher risk of incident T2DM was observed in people with serum 25(OH)D level <50 nmol/L compared with those with a level ≥50 nmol/L in the adjusted model. Every 25-unit decrease in serum 25(OH)D seemed to be associated with a 30% higher risk of T2DM, but the estimate was imprecise (OR 1.30, 95% CI 0.88 to 1.93). The association estimates did not change materially in the multivariable regression models without including family history of diabetes as a covariate (data not presented). The analyses after performing multiple imputations for missing data of covariates showed similar results (online supplemental table 2).
Association between baseline seasonal-standardized serum 25(OH)D level and the 11-year risk of T2DM
Potential effect modification by family history of diabetes or genetic predisposition to T2DM
The level of 25(OH)D<50 nmol/L was associated with an increased risk of T2DM in the participants without a family history of diabetes (OR 3.87, 95% CI 1.62 to 9.24), whereas there was little evidence of an association in the participants with a family history of diabetes (OR 0.72, 95% CI 0.32 to 1.62) (table 3). The LRT showed evidence of an effect modification by the family history (p=0.003).
Association between baseline seasonal-standardized serum 25(OH)D level and the 11-year risk of T2DM, stratified by family history of diabetes (N=3080*)
We further examined if the association between vitamin D and T2DM risk was modified by PRS (table 4). The LRT provided little statistical evidence suggesting that the OR in the top 1/3 PRS stratum differed from that in the bottom 2/3 PRS stratum (p value for LRT=0.23). There was also little evidence for effect modification by PRS when other cut-off values of PRS were applied (online supplemental figure 1, p>0.23 for all LRTs).
Association between baseline seasonal-standardized serum 25(OH)D level and the 11-year risk of T2DM, stratified by PRS for T2DM (N=3467*)
Discussion
Main findings
In an 11-year follow-up study, we found that serum 25(OH)D<50.0 nmol/L was associated with a 72% increased risk of T2DM in the Norwegian adults overall. The inverse association was evident among people who did not have a family history of diabetes but not in those with a family history. The association between serum 25(OH)D and T2DM, however, was not modified by the genetic predisposition to T2DM measured by PRS.
Comparison with previous studies
Our results are consistent with those from a Danish study that found a 20% increased risk of T2DM per 25 nmol/L decrease in serum 25(OH)D.8 Contrastingly, another Danish study did not find an association between low 25(OH)D status and incident diabetes.9 This may be due to a shorter follow-up duration of the latter study. Forouhi et al designed a nested case-cohort from the European Prospective Investigation into Cancer (EPIC)-Norfolk study, including 621 incident T2DM cases7; compared with participants with 25(OH)D<50 nmol/L, the risk of T2DM was halved in those with 25(OH)D>80 nmol/L.7 The variation in the estimated magnitude for the risk of T2DM between the previous study and our study (50% vs 42% lower risk) could be partially explained by the difference in categorization of serum 25(OH)D.
A meta-analysis study of Song et al combined data from 21 prospective studies, including 4996 incident T2DM cases from diverse populations.28 They found a summary relative risk for T2DM of 0.62 (95% CI 0.54 to 0.70) comparing the highest to lowest category of 25(OH)D levels. In a more recent meta-analysis study using data from 22 longitudinal studies of European descent and including 8492 cases of T2DM, a 25 nmol/L decrease in 25(OH)D concentration was associated with a 21% significantly increased risk of T2DM.10
A recent randomized controlled trial showed that vitamin D supplementation did not result in a significantly lower risk of diabetes than placebo,29 which challenges any causal inference. However, the study had a relatively short follow-up duration (median 2.5 years). Latest research has also applied Mendelian randomization (MR) to study the potential causal relationship between low vitamin D and the risk of T2DM. MR approach attempts to overcome issues of confounding and reverse causation that are usually present in observational studies.30 31 A recent MR study, based on data from European and Chinese adults, found that a genetically determined 25 nmol/L higher 25(OH)D was associated with a 14% (95% CI 3% to 23%) lower risk of T2DM.32 Similarly, another MR analysis based on 898 130 individuals of European ancestry from 32 studies revealed a significant inverse association of genetically predicted serum 25(OH)D levels with risk of T2DM.33 Both studies used genetic variants affecting the synthesis of vitamin D as instrumental variables. In contrast, an earlier MR study found no association between genetically predicted serum 25(OH)D and the incidence of T2DM.10 The causal association remains to be confirmed in future studies.
Our results demonstrated that the vitamin D–T2DM association was modified by family history of diabetes but not by genetic predisposition to T2DM. The discord implied that these two variables might not be used interchangeably. This may be because family history of diabetes is not only a reflection of genetic predisposition but also of shared environmental and lifestyle factors.34 35 Another explanation for the discrepancy may be because family history was self-reported, and there is a possibility of information bias. On the other hand, although the PRS was generated using the genetic variants from the latest GWAS, it explained only a small part of the risk of T2DM. This may also partially explain the inconsistent results stratified by family history or PRS.
Potential biological mechanisms
The biological mechanism by which low serum 25(OH)D level might lead to an increased risk of T2DM has not been well elucidated. Most tissues and cells in the body, including beta-cells of the pancreas, have vitamin D receptors and respond to the active form of vitamin D 1,25(OH)₂D that controls the expression of more than 200 genes.36 37 Vitamin D insufficiency may directly result in decreased pancreatic insulin secretion and indirectly influence calcium metabolism that regulates insulin synthesis and secretion.38 In addition, vitamin D displays anti-inflammatory properties and may inhibit cytokine-induced beta-cell death during inflammatory processes.39 Finally, a recent study showed that people who were genetically liable to T2DM had lower lipids in high-density lipoprotein (HDL) subtypes before the clinical onset of the disease.23 Vitamin D may directly affect the lipid metabolism that might mediate the pathway from vitamin D status to T2DM. Recently, an MR study has demonstrated a causal positive association between serum 25(OH)D and HDL levels.21 Results in the current study suggested that keeping a sufficient vitamin D level might reduce the risk of T2DM in adults with no family history of diabetes. The null association in those with family history may be due to the reason that the family history neutralizes the protective effect of vitamin D.
Strengths and limitations
To our knowledge, this prospective cohort study is the first to provide an insight into the potential influences of family history and genetic predisposition on the relationship between serum 25(OH)D and the risk of T2DM. Serum 25(OH)D was measured in a large random sample of Norwegian adults aged over 20 years in HUNT2. Use of the cosinor model to calculate season-standardized serum 25(OH)D rather than adjustment for season of blood draw in the models minimized the mean squared error, as mentioned previously. In addition, the study had a long follow-up duration. We used 166 T2DM susceptibility loci23 instead of the full set of 403 SNPs from the latest T2DM GWAS for European ancestry11 to construct the PRS. The PRS based on the 166 SNPs collectively explained about 5.2% of the risk of T2DM in our study (pseudo R2 0.052 from logistic regression), whereas 396 of the 403 SNPs (information on 7 SNPs is unavailable in HUNT) explained a less proportion (pseudo R2 0.044 from logistic regression).
There are several limitations related to our study. The participation rate from HUNT2 to HUNT3 was 57.6%, increasing the possibility of selection bias. Participants in the HUNT studies have been shown to be healthier than non-participants.40 In the current study, those who did not participate in HUNT3 were older, less educated and more likely to have chronic diseases than those who participated (online supplemental table 3). However, the distribution of 25(OH)D levels in the analysis dataset was similar to that in the 10% random sample (online supplemental figure 2). Due to the small sample size in the analysis cohort, serum 25(OH)D could only be classified into two categories. Data on lifestyle factors were subject to misclassification due to self-reporting, and missing data on baseline characteristics were classified as unknown category. Both could have resulted in residual confounding. Nonetheless, results before and after multiple imputation of missing data showed a similar pattern. Residual confounding by unmeasured lifestyle factors such as diet or unknown confounders cannot be excluded either. The definition of diabetes was based on self-report information and non-fasting blood glucose values. There is a possibility of information bias for the diagnosis as we did not have data on fasting plasma glucose values41 of the participants. However, 96% of the questionnaire-based diabetes diagnoses of HUNT were previously verified through a linkage with medical records.25 Misclassification of diabetes types was less likely as cases of T2DM were defined by including GADA<0.08 ai in the definition. Participants were mainly Caucasian, reducing the generalizability to other ethnic populations. Indeed, the genetic susceptibility for T2DM may differ between populations. For instance, additional SNPs associated with T2DM have been identified in Eastern Asians.12
Conclusion
Overall, we observed that lower serum 25(OH)D level was associated with an increased risk of T2DM in Norwegian adults. The association was modified by family history of diabetes but not by genetic predisposition to T2DM. Our findings should be replicated in future studies in European and other ethnic populations with a larger sample size.
Acknowledgments
The Trøndelag Health Study (HUNT) is a collaboration between the HUNT Research Centre (Faculty of Medicine and Health Sciences, NTNU, Norwegian University of Science and Technology), Trøndelag County Council, Central Norway Regional Health Authority, and the Norwegian Institute of Public Health. The genotype quality control and imputation have been conducted by the K.G. Jebsen Center for Genetic Epidemiology, Department of Public Health and Nursing, Faculty of Medicine and Health Sciences, NTNU, Norwegian University of Science and Technology.
References
Supplementary materials
Supplementary Data
This web only file has been produced by the BMJ Publishing Group from an electronic file supplied by the author(s) and has not been edited for content.
Footnotes
Contributors MD, XMM and YQS performed the literature search and contributed to the study design. XMM, BOÅ, EPS and YQS were responsible for data collection. MD and YQS conducted statistical analyses, interpreted the results and wrote the initial draft of the manuscript. MD, XMM, BOÅ, EPS, YC and YQS participated in the data interpretation, contributed to the statistical analyses and manuscript writing with important intellectual content and approved the final version of the manuscript.
Funding The project was supported by The Norwegian Cancer Society (project ID 1 82 688–2016) and The Research Council of Norway ‘Gaveforsterkning’. YQS was supported by a Researcher grant from The Liaison Committee for education, research and innovation in Central Norway (project ID 2018/42794).The genotyping in HUNT was financed by the National Institutes of Health, University of Michigan, The Research Council of Norway, and Central Norway Regional Health Authority and the Faculty of Medicine and Health Sciences, NTNU, Norwegian University of Science and Technology.
Competing interests None declared.
Patient consent for publication Not required.
Ethics approval All participants gave their informed consent for participation in HUNT. The current study was approved by the Norwegian Regional Committees for Medical and Health Research Ethics (2015–1562 REK sør-øst C).
Provenance and peer review Not commissioned; externally peer reviewed.
Data availability statement Data from the Trøndelag Health Study (HUNT) that is used in research projects will, when reasonably requested by others, be made available on request to the HUNT Data Access Committee (hunt@medisin.ntnu.no). The HUNT data access information describes the policy regarding data availability (https://www.ntnu.edu/hunt/data).
Supplemental material This content has been supplied by the author(s). It has not been vetted by BMJ Publishing Group Limited (BMJ) and may not have been peer-reviewed. Any opinions or recommendations discussed are solely those of the author(s) and are not endorsed by BMJ. BMJ disclaims all liability and responsibility arising from any reliance placed on the content. Where the content includes any translated material, BMJ does not warrant the accuracy and reliability of the translations (including but not limited to local regulations, clinical guidelines, terminology, drug names and drug dosages), and is not responsible for any error and/or omissions arising from translation and adaptation or otherwise.