Article Text

Abstract
Objective Previous studies have demonstrated associations between higher normal fasting plasma glucose levels (NFG) (<6.1 mmol/L), type 2 diabetes (T2D) and hippocampal atrophy and other cerebral abnormalities. Little is known about the association between plasma glucose and the striatum despite sensorimotor deficits being implicated in T2D. This study aimed to investigate the relationship between plasma glucose levels and striatal and hippocampal morphology using vertex-based shape analysis.
Design A population-based, cross-sectional study.
Setting Canberra and Queanbeyan, Australia.
Participants 287 cognitively healthy individuals (mean age 63 years, 132 female, 273 Caucasian) with (n=261) or without T2D (n=26), selected from 2551 participants taking part in the Personality & Total Health (PATH) Through Life study by availability of glucose data, MRI scan, and absence of gross brain abnormalities and cognitive impairment.
Outcome measures Fasting plasma glucose was measured at first assessment, and MRI images were collected 8 years later. Shape differences indicating outward and inward deformation at the hippocampus and the striatum were examined with FMRIB Software Library-Integrated Registration and Segmentation Toolbox (FSL-FIRST) after controlling for sociodemographic and health variables.
Results Higher plasma glucose was associated with shape differences indicating inward deformation, particularly at the caudate and putamen, among participants with NFG after controlling for age, sex, body mass index (BMI), hypertension, smoking and depressive symptoms. Those with T2D showed shape differences indicating inward deformation at the right hippocampus and bilateral striatum, but outward deformation at the left hippocampus, compared with participants with NFG.
Conclusions These findings further emphasize the importance of early monitoring and management of plasma glucose levels, even within the normal range, as a risk factor for cerebral atrophy.
- Fasting Blood Glucose
- MRI
- Brain
This is an Open Access article distributed in accordance with the Creative Commons Attribution Non Commercial (CC BY-NC 4.0) license, which permits others to distribute, remix, adapt, build upon this work non-commercially, and license their derivative works on different terms, provided the original work is properly cited and the use is non-commercial. See: http://creativecommons.org/licenses/by-nc/4.0/
Statistics from Altmetric.com
Key messages
Higher normal plasma glucose levels and diabetes are associated with striatal shape differences that predict smaller striatum 4 years later.
Higher plasma glucose levels affect striatal morphology not only in type 2 diabetes but also within the normal range in non-diabetics.
Results suggest that shape analysis is an informative measure to detect brain morphological differences associated with plasma glucose along with traditional volumetric measures.
Introduction
Type 2 diabetes is a complex metabolic disorder which has been associated with ‘accelerated brain ageing’, cerebral atrophy, vascular lesions, cognitive impairment and dementia.1–3 Recent studies have demonstrated associations between higher plasma glucose levels and neuroinflammation,4 abnormal coagulation function5 ,6 and chronic stress associated with increased hypothalamic–pituitary–adrenal (HPA) axis activation.7 These factors are thought to contribute to the association between plasma glucose levels and cerebral structural changes. For example, recent studies have shown that higher plasma glucose within the normal range (<6.1 mmol/L) is associated with smaller brain volumes,8 and hippocampal and amygdalar atrophy.9 Importantly, diabetes and higher plasma glucose levels within the normal range (<6.1 mmol/L) have been shown to be associated with cognitive decline.10–12 However, whether higher plasma glucose levels are related to changes in subcortical structures other than the hippocampus and amygdala has not been investigated in detail. A structure of particular interest in this context is the striatum, as known complications of type 2 diabetes involve abnormal motor control and deficits in fine motor skills.13
Impairment of corpus striatum (including caudate, putamen, globus pallidus; hereafter, striatum) is involved in several neurodegenerative conditions such as Huntington's disease, progressive supranuclear palsy and Parkinson's disease, which exhibit striatal functional and structural abnormalities.14 Of note, previous studies on type 2 diabetes demonstrated motor symptoms such as hemiballism–hemichorea due to striatal abnormalities, which can be termed ‘diabetic striatopathy’ as a late-stage complication.15 Furthermore, MRI studies demonstrated hyperintense lesions in the striatum among patients with type 2 diabetes,15–17 while postmortem histological studies observed neuroinflammation and vascular proliferation in these structures.15 How such striatal abnormalities develop is not completely understood. However, early structural changes leading to late-stage clinical cases of diabetic striatal disorders may occur well before clinical type 2 diabetes develops. Importantly, at least one study showed that type 2 diabetes was associated with impairment in fine motor skills in community-living individuals in their 60s.13 It is unclear whether such deficits in fine motor skills are due to the effects of advanced diabetic neuropathy or whether progressive striatal neurodegeneration linked to high glucose levels, which may be developing among participants with and without diabetes, is to blame. It would therefore be of great interest to better understand the association between striatal structure and plasma glucose levels in participants without type 2 diabetes and to contrast it with that found in type 2 diabetes. In addition, earlier studies on brain structural changes associated with high plasma glucose levels and/or type 2 diabetes focused mainly on volumetric changes, while patterns of shape differences showing local outward and inward deformation, thought to indicate more localized structural differences, have not been investigated. Striatal shape changes have been identified in several neurodegenerative diseases and potentially indicate functional changes associated with local neurons interconnecting cortical areas, the striatum and the thalamus.18 Thus, it is hypothesized that structural deformation may be useful as a distinct biomarker of different neurological conditions that affect the same structure, and may assist in demonstrating an association between local morphological changes and corresponding variation in function.
This study aimed to explore the relationship between plasma glucose levels and striatal and hippocampal shape differences as well as volumetric differences in cognitively healthy individuals living in the community with or without type 2 diabetes. The study also investigated structural differences between participants with normal fasting glucose levels and participants with diabetes.
Methods
Study population
Participants of the Personality & Total Health (PATH) Through Life study were randomly recruited from senior residents (aged 60–64 years) of the cities of Canberra and Queanbeyan, Australia, through the electoral roll. Voting is compulsory for Australian citizens. Of those individuals invited to take part, 2551 participants accepted and were included at baseline (2001) representing a 58.3% response rate and 2076 agreed to be contacted regarding MRI assessment. A subsample of 622 randomly selected participants was offered a brain scan, and 479 completed a structural MRI scan; however, scans from 2 participants were lost. Of these, 312 participants (198 men; age range 69–74) were rescanned at the follow-up assessment 8 years later. Twenty five (8%) were excluded from the present analyses due to gross brain abnormalities (eg, tumors, hydrocephalus; n=9), Parkinson's disease (n=3) or stroke (n=6), a blood glucose level below 3.0 mmol/L (n=1), or a Mini-Mental State Examination (MMSE) score below 27 (n=5). Thus, a total of 287 participants were available for analysis. The study was approved by the Australian National University Ethics Committee, and all participants provided written informed consent.
Sociodemographic and health measures
Sociodemographic and health data for this study were collected at wave 1. Total years of education, stroke, depression and smoking were assessed by self-report. Blood pressure was measured twice while seated after a rest of at least 5 min. Participants were classified as hypertensive if their systolic or diastolic blood pressure measures averaged over two readings were higher than 140 and 90 mm Hg, respectively, or if they took antihypertensive medication. Depression levels were assessed with the Goldberg Depression Scale (GDS).19 Body mass index (BMI) was computed with the formula weight (kg)/height (m2) based on self-reports of weight and height.
Diabetes and plasma glucose
Fasting plasma glucose was collected and measured at wave 1. Venous blood was collected following an overnight fast of at least 10 hours. Plasma and serum aliquots were frozen at −80°C. Plasma glucose was measured on a Beckman LX20 Analyzer by an oxygen rate method (Fullerton, California, USA). Participants were considered to have diabetes if they reported their diagnosis, were treated by medication for type 2 diabetes or if their fasting glucose plasma level was ≥7.0 mmol/L. For participants without diabetes, a cut-off of 6.1 mmol/L (110 mg/dL) was used to identify participants with normal fasting plasma glucose levels (NFG) as per WHO guidelines. Those with fasting plasma glucose levels between 6.1 and 6.9 mmol/L were considered to have impaired fasting glucose (IFG), in accordance with the WHO threshold.
MRI scan acquisition
MRI scans used in this study were taken at wave 3, 8 years after wave 1. Participants were scanned on a Siemens 1.5T Avanto scanner (Siemens Medical Solutions) for T1-weighted three-dimensional structural MRI. The T1-weighted MRI was acquired in sagittal orientation using the following parameters: repetition time (TR)/echo time (TE)=1.16/0.8 ms; flip angle=15°; matrix size=512×512; slice thickness=1.0 mm, resulting in a final voxel size of 1×0.5×0.5 mm.
Image processing
For all participants, images were first preprocessed with the FreeSurfer software package, V.5.3.0,20 including removal of non-brain tissue and intensity correction. Segmentation of regions of interest (ROIs) including the globus pallidus, putamen, caudate nucleus and hippocampus was conducted with FMRIB Software Library (FSL)-Integrated Registration and Segmentation Toolbox (FSL-FIRST 5.0) software (http://www.fmrib.ox.ac.uk/fsl/first/index.html). Affine registration to the MNI152 1 mm template was applied to T1-weighted images prior to undergoing automated segmentation of ROIs with FSL's default parameters and with boundary correction to produce mesh models and volumetric estimates.21 All segmentations were manually checked and reprocessed where necessary. Volumetric data were extracted using an FSL script (fslstat).
Statistical analysis
Associations between plasma glucose levels at wave 1 and vertex changes of ROIs at wave 3 MRI scans were investigated in all participants, in participants without diabetes with NFG (3–6.1 mmol/L) and in participants with diabetes. Further analyses were conducted to contrast groups with diabetes and groups with NFG. Covariates in these analyses included age (years), gender and intracranial volume (ICV; mm3) in a first model and age, gender, hypertension, BMI (kg/m2), smoking, GDS and ICV in a second model (and diagnosis of diabetes in analyses including all participants). Correlation and group analyses were conducted using general linear models (GLMs) with FSL-FIRST by assessing association between vertex displacement from the average ROI surface and plasma glucose or group variable, and significance was assessed through permutation testing in the FSL statistical engine ‘Randomise’ using 10 000 permutations.21 ,22 A statistical threshold of t>1.96 (p<0.05) was applied to check for shape differences indicating outward deformation, that is, vertex locations outside the average surface reflecting larger local volume, and t<−1.96 (p<0.05) for shape differences indicating inward deformation, that is, vertex locations inside the average surface reflecting smaller local volume. Non-FSL analyses were conducted with IBM SPSS 21 to test associations and group differences in health and demographic characteristics, and volumetric estimates. Data were tested for normal distribution before implementing parametric tests. Descriptive analyses were conducted using χ2 tests for categorical data and t-tests to test associations and compare groups on continuous variables. α Was set at p<0.05.
Results
Health and demographic characteristics
Table 1 presents the participants' demographic and health measures. Fasting plasma glucose ranged from 3.20 to 14.20 mmol/L (mean 5.19, SD=1.12) across all participants (n=287) and from 3.20 to 6.00 mmol/L (mean 4.92, SD=0.56) among participants without diabetes with NFG (n=249; not including 12 participants with IFG) and from 4.30 to 14.20 mmol/L (mean 7.17, SD=2.41) among participants with diabetes (n=26).
Participants' demographic and health characteristics
Vertex-based shape analysis
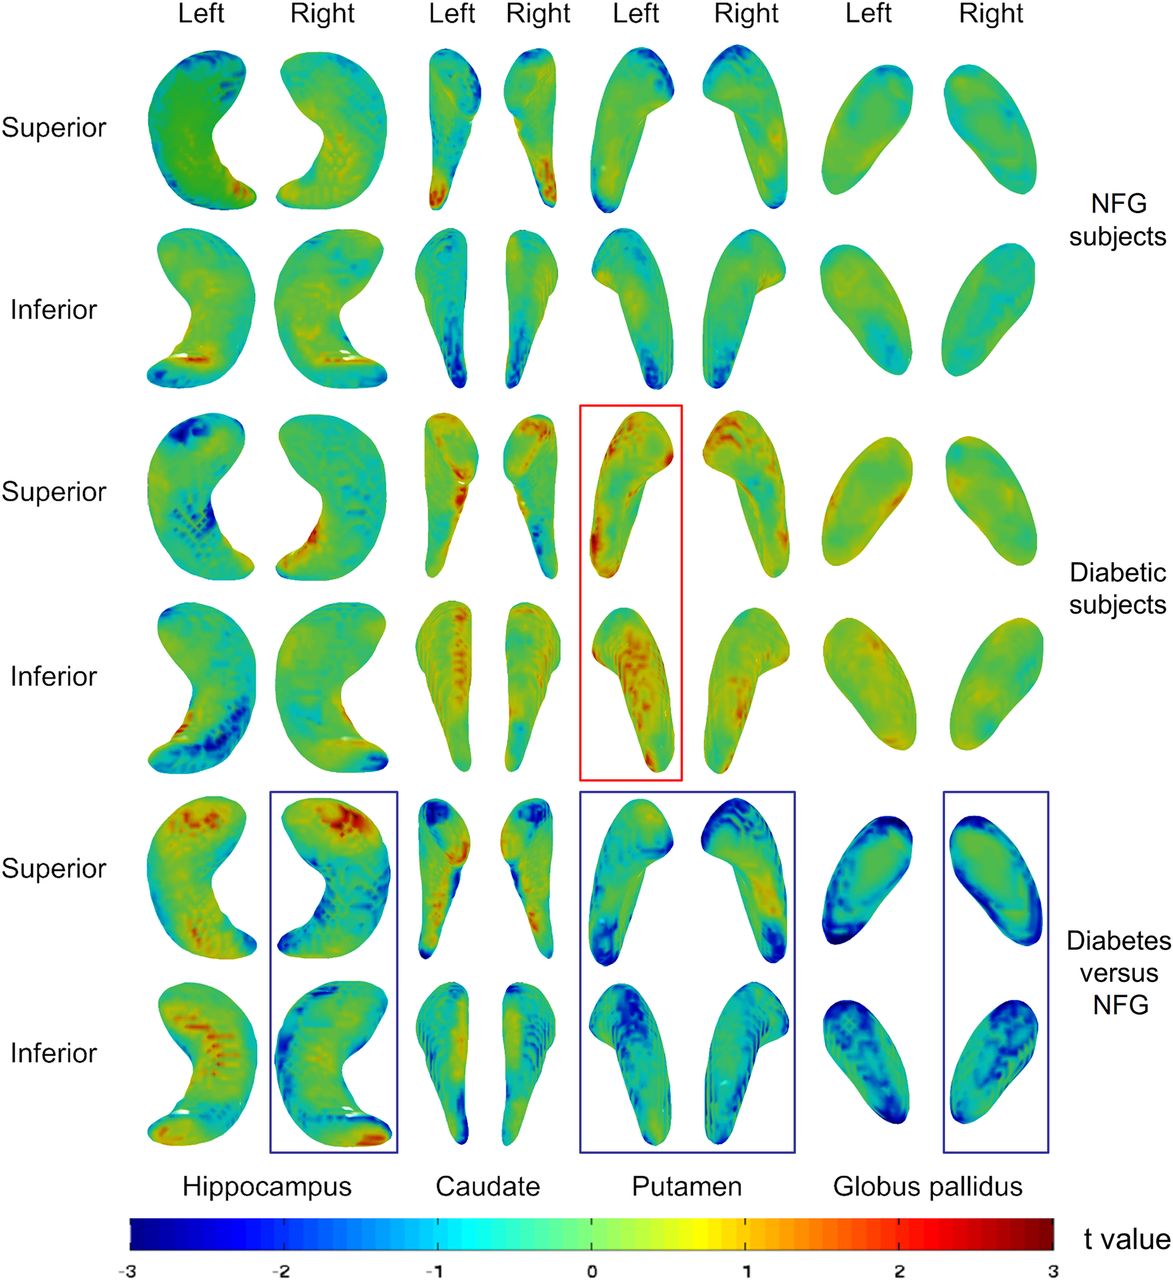
Group differences and associations between glucose levels and regional shape differences (p<0.05) are shown in figure 1. While both shape differences showing outward and inward deformation were detected, in all but few exceptions, the number, size and significance of clusters were greater for shape differences indicating inward deformation (see also table 2 and online supplementary figure 1 for summary of clusters representing shape differences and online supplementary table S1 for detailed data). Analyses with all participants (n=287), including those with type 2 diabetes and IFG, showed mostly shape differences indicating inward deformation particularly in the hippocampus. When participants with NFG (n=249) were considered alone, regional shape differences indicating inward deformation were also mostly associated with higher plasma glucose levels but to a lesser degree, and more so in the putamen and caudate nuclei. Weaker associations were observed in the hippocampus.
Supplemental material
Summary of results from vertex-based shape analysis*

Three-dimensional summary images of results from shape analysis of hippocampus, caudate, putamen and globus pallidus from superior and inferior views, showing association between plasma glucose levels and shape differences among participants with normal fasting plasma glucose levels (NFG) (top rows) and with type 2 diabetes (T2D) (middle rows). Bottom rows show shape differences between participants with T2D and participants with NFG (diabetes vs NFG). The color bar indicates the t statistic values presented on the surface maps. Results are statistically significant (p<0.05) at t<−1.96 for inward deformation and t>1.96 for outward deformation associated with plasma glucose levels or classification of T2D. Results were adjusted for all covariates. Structures with significant (p<0.05) volumetric differences indicating smaller volume are marked with blue squares, while those with volumetric differences indicating greater volume are marked with red squares.
To further compare how participants with type 2 diabetes (n=26) differed in striatal and hippocampal structure from participants with NFG, analyses comparing shape differences between the two groups of participants were conducted. Results demonstrated that participants with diabetes generally exhibited shape differences indicating inward deformation at the right hippocampus, caudate, putamen and globus pallidus, while more shape differences indicating outward deformation were observed in the left hippocampus, compared with participants with NFG. This was in contrast with results of analyses including only participants with diabetes, which demonstrated more shape differences showing inward deformation in the left hippocampus, but more showing outward deformation at bilateral caudate and putamen associated with glucose levels. Results from additional analyses controlling only for age, gender and ICV were consistent with those including all covariates.
In addition, to assess the relative sensitivity of the shape analyses used in the present study compared with more typical measures of global structure, we conducted volumetric analyses using similar models to determine how striatal and hippocampal volumes correlate with glucose levels and differ between groups. Results showed some significant volumetric differences consistent with localized shape differences, but only in a small subset of analyses showing significant shape differences (see table 3 for result summary and online supplementary table S2 for detailed data).
Summary of results from volumetric analysis*
Discussion
This study is, to our knowledge, the first to apply vertex-based shape analysis to investigate associations between higher plasma glucose levels in normal and clinical range and striatal and hippocampal structures of participants without diabetes with NFG as well as in participants with type 2 diabetes. The main findings of this study were that higher glucose levels were associated mostly with shape differences indicating inward deformation, which are suggestive of smaller regional volumes, in the hippocampus and the striatum. These associations held in participants without diabetes and across the whole sample including participants with abnormal glucose levels, providing further evidence of negative impact of higher plasma glucose levels across the normal and clinical range. Moreover, to investigate whether these effects were specifically attributable to glucose levels or to other individual characteristics and particularly health status, we conducted analyses including and excluding important covariates in addition to age and sex, which have known impact on type 2 diabetes occurrence and brain atrophy.23 ,24 Findings were very similar across these analyses, thus strengthening the case for glucose levels as the main factor underlying these effects.
Important differences were detected when participants without diabetes were investigated separately. Interestingly, shape differences indicating inward deformation associated with higher glucose levels appeared to be more pronounced in the hippocampus bilaterally when all participants were included for analysis. Since clinical diabetes appears to be more prominently associated with positive left hippocampal shape differences, while glucose levels among participants with diabetes are associated with shape differences showing inward deformation (as seen in figure 1 when comparing participants without diabetes with NFG with participants with diabetes, and when testing association between glucose levels and shape differences in participants with diabetes), together this pattern of results might suggest that, in the hippocampus, poor glucose level regulation may be to blame. Furthermore, apparent shape differences indicating inward deformation at the striatum were present in participants with diabetes compared with participants without diabetes. Yet, higher glucose levels are more associated with differences indicating outward deformation at the striatum among these participants with diabetes. These findings further suggest that while shape differences associated with type 2 diabetes may have developed from long-term higher glucose levels, they may not be consistently associated with the measured glucose levels because participants with type 2 diabetes may receive medical intervention for better glucose regulation. The presence of shape differences indicating outward deformation in type 2 diabetes and suggestive of larger regional volume is nevertheless surprising. Possible explanations for these findings are that inflammatory processes, which are known to be upregulated in type 2 diabetes,25 lead to increases in regional volume. Alternatively, it is possible that factors such as diabetic medication use or other factors specific to participants with type 2 diabetes, such as complications and comorbidities, may underlie these findings. Unfortunately, cell sizes and statistical models did not allow for such hypotheses to be tested in the present investigation but should be followed up in future research. For instance, comorbidities of type 2 diabetes cannot be totally disambiguated from the effects of diabetes. For instance, although we controlled for hypertension at wave 1 in our model, hypertension is often comorbid with diabetes and its development over the follow-up may partly explain effects observed. To disambiguate the effects of hypertension and other potential comorbidities, investigating hypertension in a longitudinal design using multilevel models is required.
When interpreting structural differences related to glucose levels, it is important to consider their possible functional implications. The present findings suggest that the inward deformation at the striatum begins at the rostral and caudal ends of the putamen, and dorsal caudate head and ventromedial caudate body among participants with NFG. The affected rostral areas are known to have connections with the medial prefrontal cortex and orbitofrontal cortex; therefore, impaired structure in these regions could be expected to impact executive function and emotional control. In contrast, the caudal areas have connections with the premotor and motor cortices; hence, structural differences in this region may potentially lead to motor function deficits.26–28
In comparison, shape differences indicating inward deformation associated with participants with diabetes when compared with participants without diabetes seem to extend along the striatum and particularly on the ventral and dorsal putamen as well as across the whole globus pallidus. These differences could affect frontostriatal connections projecting to the dorsolateral prefrontal and anterior cingulate cortex, which could in turn affect related functions such as motivated behavior. The pattern of results could suggest that shape differences indicating inward deformation at the striatum might develop in a progressive manner since participants with diabetes exhibit more shape differences showing inward deformation than participants with NFG. Beyond the striatum, shape differences were mainly observed in the CA1 and subiculum subregions of the hippocampus. A possible implication of these findings is that hippocampal output via CA1 and subiculum to other cortical and subcortical structures may be more impaired in participants with diabetes. As a whole, and in light of the animal literature, these findings appear consistent with the view that high glucose levels may lead to structural changes that may differ in their magnitude and localization during type 2 diabetes disease progression. The functional implications of shape differences are not completely clear and further studies investigating the association between striatal functions and shape changes are needed.
These results are also consistent with previous findings showing that higher plasma glucose levels within the normal range are associated with greater hippocampal atrophy in the same cohort but at earlier assessments9 and with regional volumetric differences in cortical gray matter and white matter,8 and that type 2 diabetes is associated with global brain atrophy.2 ,12 However, unlike the present study, these earlier investigations did not specifically address the localization of shape differences within the striatum and hippocampus. This method provides important information about the brain networks and functions that may be affected by these differences, and it is also more sensitive to subtle structural variations. Indeed, to investigate this point, we conducted volumetric analyses using similar statistical models and found that, whereas significant localized differences were identified for most structures and most comparisons using shape analyses, a very small number of volumetric tests reached significance. Although it is also possible that local inward shape deformation may be counterbalanced by as much outward shape deformation across the surface resulting in little or no volumetric difference, our findings showed more clusters indicating inward deformation in structures where no volumetric difference was detected. These findings support an alternative explanation that shape analysis is more sensitive to earlier morphological differences which cannot yet be detected with volumetric measures.
This study has a number of limitations. While the subsample of participants under investigation has been randomly sampled from a larger cohort, which was randomly sampled from the community, it is not completely representative of the population at large. Participants were mainly Caucasian, limiting the representativeness of results in a broader population. The cross-sectional design used in the present study can only demonstrate associations and not a causal link between higher glucose levels and striatal shape differences. Fasting plasma glucose was collected at wave 1 when participants were in their early 60s; further studies using data from younger adults and elderly participants are needed. In addition, longitudinal analyses could have provided further benefits over the cross-sectional design used here. However, the present study used a relatively new automated vertex-based shape analysis for which robust longitudinal pipelines have not yet been implemented. The smaller sample size in the group with diabetes provides reduced statistical power, which in turn may have influenced the results and somewhat reduced their representativeness in this clinical population. Finally, glucose metabolism and diabetic status were assessed based on self-report of type 2 diabetes and fasting plasma glucose levels, which may have been less precise than diagnostic assessments based on glycosylated hemoglobin (HbA1c) and full clinical interviews. However, this community-based study was conducted in a large sample which makes it more representative than studies elsewhere which are often composed of self-selected volunteers or patients. Importantly, analyses were controlled for a number of relevant covariates, and individuals with and without type 2 diabetes were carefully compared.
In conclusion, this study provides further evidence linking high blood glucose levels and cerebral morphology, particularly in type 2 diabetes but also within the normal range in non-diabetics, and suggesting that the adverse effects of higher glucose levels might start developing relatively early in the disease process. Therefore, there is a pressing need to identify the early risk factors and predictors of increasing glucose levels in midlife and before as well as for the development of preventative and risk reduction strategies at the population level.
Acknowledgments
Dr NC is the guarantor of the study and takes full responsibility for the work as a whole, including the study design, access to data and the decision to submit and publish the manuscript. The authors are grateful to Anthony Jorm, Helen Christensen, Andrew MacKinnon, Peter Butterworth, Simon Easteal, and the PATH project team. This research was partly undertaken on the National Computational Infrastructure (NCI) facility in Canberra, Australia, which is supported by the Australian Commonwealth Government.
References
Footnotes
Contributors TZ contributed to the design of the study, provided methodological input and theoretical expertise, conducted the statistical analyses and all aspects of manuscript preparation and submission. MS provided methodological input and theoretical expertise and contributed to statistical analyses and writing and editing of the manuscript. JH contributed to statistical analyses and writing and editing of the manuscript. KJA contributed to the design of the study, provided methodological input and theoretical expertise, advised on statistical analyses and contributed to writing and editing of the manuscript. PS contributed to the design of the study, provided methodological input and theoretical expertise and contributed to writing and editing of the manuscript. NC contributed to the design of the study, provided methodological input and theoretical expertise and contributed to statistical analyses and writing and editing of the manuscript.
Funding The study was supported by the National Health and Medical Research Council (NHMRC) of Australia (Grant No. 973302, 1002160 and 1063907). NC and KA are funded by the Australian Research Council (ARC) Fellowship No. 12010227 and NHMRC Fellowship No. 1002560.
Competing interests None declared.
Patient consent Obtained.
Ethics approval Australian National University Ethics Committee.
Provenance and peer review Not commissioned; externally peer reviewed.
Data sharing statement No additional data are available.