Article Text

Abstract
Introduction Risk of non-obese or lean non-alcoholic fatty liver disease (NAFLD) for cancer in patients with type 2 diabetes mellitus (T2DM) is less known. We aimed to evaluate independent associations of NAFLD, especially non-obese or lean NAFLD, and body mass index (BMI) on risks of cancer in patients with T2DM.
Research design and methods Cross-sectional analyses of baseline information on a cohort of 233 patients with T2DM were conducted in Xiamen, China. NAFLD was identified by hepatic ultrasonography diagnosis of hepatic steatosis without excessive alcohol consumption, viral or autoimmune liver disease. Fibrosis-4 (FIB-4) score was calculated to quantify severity of hepatic fibrosis.
Results All types of cancers were diagnosed on 19 (8.2%) patients. Prevalence of cancer was significantly higher in those with NAFLD than those without (15.5% vs 4.0%, p=0.002), but were not significantly different among BMI categories (6.8%, 13.7% and 6.5% for those with underweight or normal weight (n=74), overweight (n=51) and obesity (n=108), respectively, p=0.258). With adjustment for potential confounding factors in the multivariable logistic regression models, NAFLD was significantly associated with increased risk of cancer with the adjusted OR (95% CI) of 5.969 (1.349 to 26.413, p=0.019). Stratified analyses across BMI categories found similar association of NAFLD with risk of cancer for those non-obese or lean (the adjusted OR (95% CI) 17.446 (1.690 to 180.095, p=0.016)) but not for those with either overweight (OR (95% CI) 11.642 (0.832 to 162.963, p=0.068) or obesity (OR (95% CI) 0.917 (0.170 to 4.954, p=0.920). FIB-4 score was not significantly associated with risk of cancer for all subjects or stratified across BMI categories. BMI was not significantly associated with risk of cancer for all patients or stratified by NAFLD.
Conclusions NAFLD, even non-obese or lean NAFLD, was independently associated with increased risk of cancer in patients with T2DM. Screening and management of NAFLD, especially for those with underweight or normal weight, should be strengthened from the perspective of improving prevention and management of cancer in patients with T2DM.
- cancer
- obesity
- diabetes mellitus, type 2
- non-alcoholic fatty liver disease
Data availability statement
Data are available on reasonable request. Data are available from the corresponding author on reasonable request.
This is an open access article distributed in accordance with the Creative Commons Attribution Non Commercial (CC BY-NC 4.0) license, which permits others to distribute, remix, adapt, build upon this work non-commercially, and license their derivative works on different terms, provided the original work is properly cited, appropriate credit is given, any changes made indicated, and the use is non-commercial. See: http://creativecommons.org/licenses/by-nc/4.0/.
Statistics from Altmetric.com
WHAT IS ALREADY KNOWN ON THIS TOPIC
Risk of non-obese or lean non-alcoholic fatty liver disease (NAFLD) for cancer in patients with type 2 diabetes mellitus (T2DM) is less known.
WHAT THIS STUDY ADDS
The prevalence rate of cancer was significantly higher in those with NAFLD than those without (15.5% vs 4.0%, p=0.002), but were not significantly different among body mass index (BMI) categories.
NAFLD was independently associated with increased risk of cancer with the adjusted OR (95% CI) of 5.969 (1.349 to 26.413, p=0.019).
Stratified analyses across BMI categories found similar association of NAFLD with risk of cancer for those non-obese or lean.
HOW THIS STUDY MIGHT AFFECT RESEARCH, PRACTICE OR POLICY
Screening and management of NAFLD, especially for those with underweight or normal weight, should be strengthened from the perspective of improving prevention and management of cancer in patients with T2DM.
The global prevalence of diabetes was estimated to be 9.3% (463 million people) in 2019 and would rise to 10.2% (578 million) by 2030 and 10.9% (700 million) by 2045.1–3 Type 2 diabetes mellitus (T2DM) accounts for 90% of diabetes, which arouses a heavy public health burden worldwide.1–4 Accumulated evidence has shown that T2DM is a risk factor for certain types of cancer, such as liver, colon and breast cancer.5 6 Although it is known that T2DM and cancer share some common risk factors, such as aging, smoking, physical inactivity and unhealthy diet7 and that hyperglycemia, insulin resistance, elevated insulin, inflammatory cytokines and dyslipidemia attribute to the increased risk of cancer in patients with diabetes,8 identifying risk factors and mechanisms linking T2DM and cancer are still big challenges from the perspective of improving prevention and management of these comorbidities.9
Growing evidence has shown that non-alcoholic fatty liver disease (NAFLD) is a kind of chronic liver disease and contributes to extrahepatic diseases, such as T2DM, cardiovascular disease (CVD) and certain sites of cancer.10–12 NAFLD is closely associated with metabolic/insulin resistance syndrome, which may therefore predict T2DM incidence.13 Meanwhile, NAFLD has been becoming the most important cause of hepatocellular carcinoma (HCC), and it is expected the annual incidence of NAFLD-related HCC is about to increase by 45%–130% by 2030.14–16 More and more evidence has documented the associations of NAFLD with other extrahepatic cancers, such as colon, esophagus, stomach, pancreas, kidney in men and breast cancer in women,17 18 but less is known about the independent association of NAFLD with risks of all types of cancer in patients with T2DM.
Obesity has been well documented to contribute a broad array of chronic diseases, including diabetes, hypertension, CVD, chronic kidney disease and certain sites of cancer.19–21 Since NAFLD usually occurs simultaneously when obesity happens, the risk of NAFLD for cancer development may further increase when associated with other metabolic traits, such as obesity, hypertension and dyslipidemia,16 and little evidence is available on the independent effects of NAFLD and obesity for cancer, especially in patients with T2DM.
Although NAFLD is commonly associated with obesity, NAFLD in non-obese or lean individuals is increasingly being identified.22 Around 40% of the global NAFLD population was classified as non-obese and almost a fifth was lean.23 However, the risk of non-obese or lean NAFLD for cancer in patients with T2DM is less known. Therefore, in the present study with 233 patients with T2DM, we mainly aimed to evaluate the independent associations of NAFLD, especially non-obese or lean NAFLD, and BMI on risks of all types of cancer in patients with T2DM.
Research design and methods
Study design and subjects
From January 2018 to April 2020, a total of 251 patients with T2DM from the Department of Endocrinology, Zhongshan Hospital, Fudan University (Xiamen Branch) (Xiamen, China) had been recruited into the present ongoing cohort. Patients were diagnosed as diabetes based on American Diabetes Association 2018 criteria: (1) a self-reported history of diabetes previously diagnosed by healthcare professionals; (2) fasting plasma glucose (FGP) ≥126 mg/dL (7.0 mmol/L); (3) 2-hour plasma glucose (2-hour PG, oral glucose tolerance test) ≥200 mg/dL (11.1 mmol/L) or (4) glycosylated hemoglobin A1c (HbA1c) ≥6.5% (48 mmol/mol).24 T2DM was identified for diabetes cases with the age of 20 years or older who are overweight or obese and/or have a family history of diabetes. Finally, 18 patients were excluded due to incomplete data and 233 patients were left for the present analyses. This study was designed as a cross-sectional analysis of this T2DM patient cohort.
Measurements
Face-to-face interview was conducted for each patient to collect sociodemographic status, lifestyle habits, present and previous history of health and medications, including histories of diabetic complications and treatment. Subjects underwent weight and height measurements by using a calibrated scale after removing shoes and heavy clothes. Body mass index (BMI) was calculated as the weight in kilograms divided by the square of the height in meters. Arterial blood pressure was measured with OMRON electronic sphygmomanometer after sitting for at least 15 min. Three readings were taken at 5 min intervals and the mean of them was recorded.
After a 12-hour overnight fasting, blood samples were collected to measure FPG, HbA1c, liver function, renal function and lipid profiles. All biochemical measurements were tested in the clinical laboratory of the Zhongshan Hospital, Fudan University (Xiamen Branch). Serum creatinine, uric acid (UA), triglyceride (TG), total cholesterol (TC) and high-density lipoprotein cholesterol (HDL-C), aspartate aminotransferase (AST), alanine aminotransferase (ALT) were determined on an analyzer (Roche Elecsys Insulin Test, Roche Diagnostics). Low-density lipoprotein cholesterol (LDL-C) was calculated by Friedewald’s formula: LDL-C=(TC−HDL-C)−TG/5.25 FPG concentration was measured by the hexokinase method and HbA1c by the Bio-Rad Variant Hemoglobin A1c assay.
Liver ultrasonography and definition of non-alcoholic fatty liver disease
Hepatic ultrasonography scanning was performed by an experienced radiologist who was blinded to the patients’ health status using GE LOGIQ P5 scanner (GE Healthcare, Milwaukee, USA) with a 4 MHz probe. Hepatic steatosis was diagnosed on the basis of characteristic sonographic features, including hepatorenal echo contrast, liver parenchymal brightness, deep beam attenuation and vessel blurring.26 The definition of NAFLD was based on hepatic ultrasonography diagnosis of hepatic steatosis without excessive alcohol consumption, viral or autoimmune liver disease.
Fibrosis-4 (FIB-4) score was calculated for each subject based on the formula: FIB-4=age ((year)×AST (U/L))/((PLT (109/L))×(ALT (U/L))1/2), and a cut-off of >3.25 was used to define advanced hepatic fibrosis.27
Definition of cancers and BMI categories
All types of cancers were identified by checking the patients’ medical records after they recalled histories of any kind of cancer which were diagnosed by professional health workers previously or after admission to the hospital. Subjects were classified by WHO guidelines for the Asian Pacific population into five BMI categories: underweight (<18.5 kg/m2), normal weight (18.5–22.9 kg/m2), overweight (23.0–24.9 kg/m2), obesity I (25.0–29.9 kg/m2) and obesity II (≥30.0 kg/m2).28 29 Since there were only 7 (3.0%) patients with underweight and 17 (7.3%) patients with obesity II, three BMI categories were used in the present study, including underweight or normal weight (non-obese or lean, <23.0 kg/m2), overweight (23.0–24.9 kg/m2) and obesity (25.0 kg/m2 or over).
Statistical analyses
Data were presented as the mean±SD for continuous variables or number and percentage for categorical variables. Skewness and kurtosis tests for continuous variables were conducted and found all followed approximation of normal distributions. Differences between subjects categorized by NAFLD (vs non-NAFLD) and cancer (yes vs no) were analyzed using one-way analysis of variance for continuous variables and χ2 test for categorical variables. Bar graphs showing prevalence rates of all cancers were made stratified by BMI categories and NAFLD.
Multivariable logistic regression models were used to calculate the adjusted ORs and 95% CIs for all cancers with adjustment for potential confounders (including age, sex, ever smoking and drinking habits, systolic and diastolic blood pressure, TG, TC, HDL-C and LDL-C, HbA1c, serum UA, oral hypoglycemic medications and insulin use, BMI and NAFLD). Interaction tests between BMI and NAFLD were conducted. Furthermore, multivariable logistic regression analyses of NAFLD (yes vs no) stratified by BMI categories as well as multivariable logistic regression analyses of BMI categories (underweight or normal weight as the reference) stratified by NAFLD for all cancers were conducted separately with adjustment for the same potential confounding variables. All p values were two-sided and p<0.05 was considered statistically significant. All statistical analyses were performed using Stata V.14.0 (StataCorp, College Station, Texas, USA).
Results
Prevalence rates of all cancers stratified by BMI categories and NAFLD
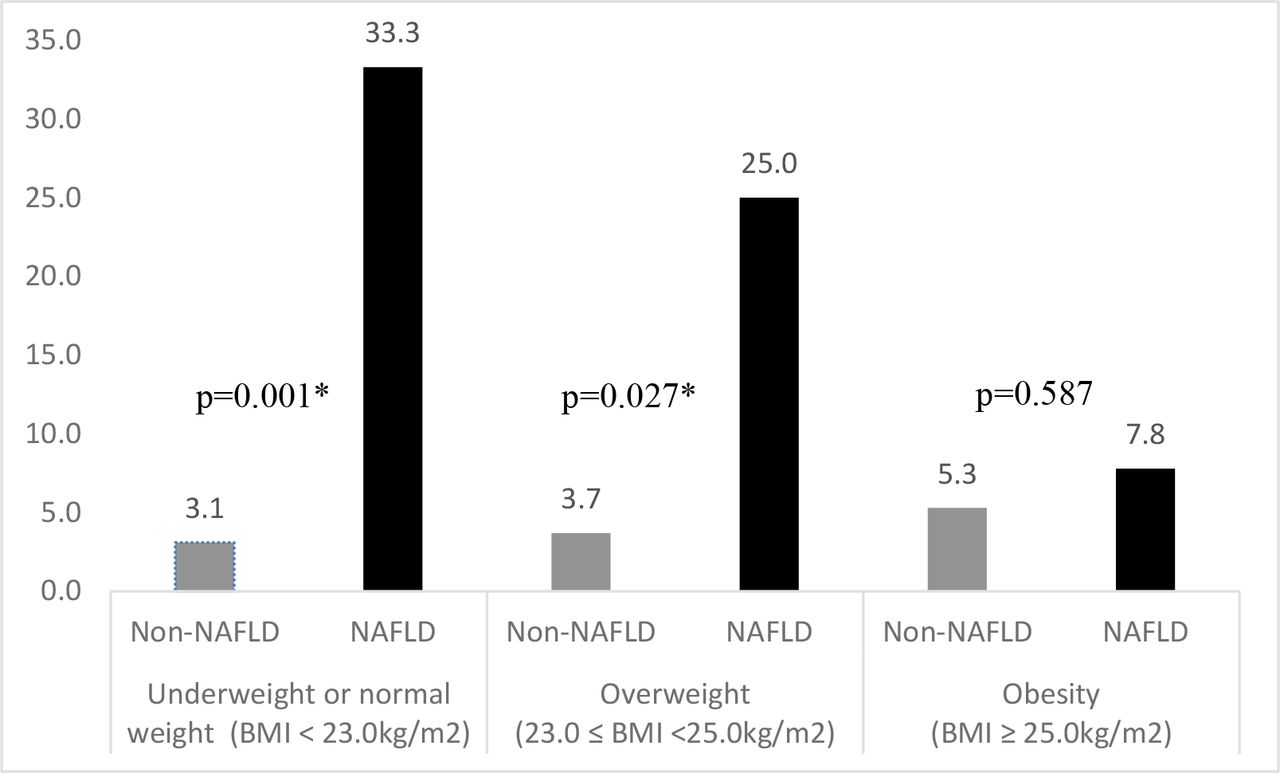
For all the 233 patients with T2DM, the means (±SDs) of age were 63.7 (±8.0) years for women (n=95, 40.8%) and 53.5 (±12.3) years for men (n=138, 59.2%) (p<0.001). Among them, 19 (8.2%) patients were identified as having cancers, and the primary cancers sites included breast cancer (n=2), cervical cancer (n=3), thyroid cancer (n=3), rectal cancer (n=3), liver cancer (n=1), lung cancer (n=3), gastric cancer (n=1), bladder cancer (n=1) and unclear cancer (n=2). Overall, the prevalence rates of cancer were significantly higher in those with NAFLD than those without NAFLD (15.5% vs 4.0%, p=0.002), but were not significantly different among BMI categories (6.8%, 13.7% and 6.5% for those with underweight or normal weight (n=74), overweight (n=51) and obesity (n=108), respectively, p=0.258). Figure 1 shows the prevalence rates of cancers in patients with NAFLD were significantly higher than those without NAFLD for those with underweight or normal weight (33.3% vs 3.1%, p=0.001) and those with overweight (25.0% vs 3.7%, p=0.027) but not for those with obesity (7.8% vs 5.3%, p=0.587). Figure 1 also shows the prevalence rates of cancer decreased significantly with increasing BMI categories (from underweight or normal weight, overweight to obesity) for those with NAFLD (33.3%, 25.0% and 7.8%, respectively, p=0.047) but not for those without NAFLD (3.1%, 3.7% and 5.3%, respectively, p=0.825).
Prevalence rate (%) of cancer stratified by body mass index (BMI) categories and non-alcoholic fatty liver disease (NAFLD). *p<0.05
Demographic and clinical characteristics stratified by NAFLD and cancer
Table 1 shows differences of demographics, lifestyle habits and clinical characteristics stratified by NAFLD and cancer separately. Generally, compared with those without NAFLD, patients with NAFLD were more likely to be female and had significantly higher levels of body weight, BMI, TG, FPG, serum UA as well as higher prevalence of cancer and significantly lower level of HDL-C. Meanwhile, compared with those without cancer, patients with cancer were more likely to be female and had significantly higher prevalence of NAFLD, but there was no significant difference on other clinical characteristics between them. And there was no significant difference on either FIB-4 score or FIB-4 score category stratified across NAFLD (yes vs no) or cancer (yes vs no).
Demographic, lifestyle and clinical characteristics of subjects by NAFLD and cancer in 233 patients with T2DM
Associations of NAFLD, BMI and clinical risk factors with cancer
Table 2 shows both crude and adjusted ORs with associated 95% CIs of NAFLD, BMI and clinical risk factors for cancer in 233 patients with T2DM. Women (vs men) and NAFLD (vs non-NAFLD) were significantly associated with increased risks of cancer, with the crude ORs (95% CIs) of 3.488 (1.276 to 9.536, p=0.015) and 4.364 (1.592 to 11.961, p=0.004), respectively. With adjustment for the potential confounding risk factors in the multivariable logistic regression models, NAFLD was still significantly associated with increased risk of cancer, and the adjusted OR (95% CI) was 5.969 (1.349 to 26.413, p=0.019). But the association between sex and risk of cancer attenuated to be marginally significant (p=0.049). Neither BMI nor other clinical factors were significantly associated with risk of cancer. There was no significant interaction effect between BMI categories and NAFLD for risk of cancer (p>0.05). FIB-4 score was not significantly associated with risk of cancer, with the crude and adjusted ORs (95% CIs) of 1.235 (0.674 to 2.261) and 0.958 (0.484 to 1.896) (both p>0.05), respectively.
Crude and adjusted ORs with associated 95% CIs for cancer in 233 patients with T2DM
Association of NAFLD with risk of cancer stratified by BMI categories
Table 3 shows both crude and adjusted ORs with associated 95% CIs of NAFLD for risk of cancers stratified by BMI categories. For those with underweight or normal weight, NAFLD was significantly associated with increased risk of cancer, and the adjusted OR (95% CI) was 17.446 (1.690 to 180.095, p=0.016). But for those with either overweight or obesity, NAFLD was not significantly associated with risk of cancer, and the adjusted ORs (95% CIs) were 11.642 (0.832 to 162.963, p=0.068) and 0.917 (0.170 to 4.954, p=0.920), respectively. Either the crude or the adjusted ORs of FIB-4 score in table 3 further show that FIB-4 was not significantly associated with risk of cancer across BMI categories (underweight or normal weight; overweight, obesity).
Crude and adjusted ORs with associated 95% CIs of NAFLD for cancer stratified by BMI categories in 233 patients with T2DM
Associations of BMI categories with risks of cancer stratified by NAFLD
Table 4 shows both crude and adjusted ORs with associated 95% CIs of BMI categories for risk of cancer stratified by NAFLD. For patients with NAFLD, compared with underweight or normal weight, obesity had significantly decreased risk of cancer with the crude OR ((95% CI) of 0.170 (0.030 to 0.952, p=0.044), but the adjusted OR (0.244 (0.025 to 2.390), p=0.226) attenuated to be statistically non-significant with adjustment for the confounding variables. For those without NAFLD, both the crude and adjusted ORs (95% CIs) showed BMI categories were not significantly associated with risk of cancer.
Crude and adjusted ORs with associated 95% CIs of BMI categories for cancer stratified by NAFLD in 233 patients with T2DM
Discussion
In the present study of 233 patients with T2DM, the prevalence of NAFLD were 36.1% and 10.7% were classified as non-obese or lean NAFLD. We found that 8.2% patients were identified as having cancers, and the prevalence rate of cancer in those with NAFLD was significantly higher than those without (15.5% vs 4.0%, p=0.002). With adjustment for the potential confounding risk factors in the multivariable logistic regression models, NAFLD was significantly associated with increased risk of cancer with the adjusted OR (95% CI) of 5.969 (1.349 to 26.413, p=0.019). Stratified analyses further showed that non-obese or lean NAFLD was still significantly associated with increased risk of cancer with the adjusted OR (95% CI) of 17.446 (1.690 to 180.095, p=0.016). FIB-4 score was not significantly associated with risk of cancer for all subjects or stratified across BMI categories. Neither continuous nor categorical BMI was independently associated with risks of cancer for all subjects or stratified across NAFLD.
NAFLD typically comprises a spectrum of pathological conditions, including simple steatosis, non-alcoholic steatohepatisis (NASH) and cirrhosis due to significant fat accumulation in the liver. NAFLD is a kind of chronic liver disease and consequently increases the risk of extrahepatic diseases, such as T2DM, CVD and chronic kidney disease.30 Nowadays, NAFLD has also been consistently linked to different types of cancer, including HCC and extrahepatic cancer, such as colorectal cancer, esophageal and gastric cancer, pancreatic, renal, breast and prostate cancer.17 18 31 32 But less is known about the effect of NAFLD on risk of all types of cancer in patients with T2DM independent of obesity. In the present study, we found that NAFLD was significantly associated with increased risk of all cancer in patients with T2DM which was independent of all the potential confounding factors, including indices of obesity (BMI), and the adjusted OR (95% CI) was about 5.969 (1.349 to 26.413). It must be noted that, due to the small sample size, the estimated OR in the present study was quite crude with much wider CI. Therefore, much bigger sample size is warranted for future studies.
Although NAFLD has been strongly associated with obesity, there is a substantial proportion of NAFLD cases who have low or normal BMI, which refers to the ‘non-obese or lean NAFLD’.22 23 33 34 The underlying pathophysiology of non-obese or lean NAFLD has not been fully elucidated and may be quite different from general NAFLD. Some suggested the pathogenesis of non-obese or lean NAFLD is associated with various genetic predispositions, which results in the accumulation of TG in the liver and resistance to insulin.34 Furthermore, the definition of non-obese or lean may vary from the existing literature.35 36 Therefore, the risk of non-obese or lean NAFLD for cancer in T2DM may further become complicated when comparing other NAFLD. We therefore conducted stratified analyses on the associations of NAFLD with risk of all cancer for patients with T2DM across different BMI categories. For those with underweight or normal weight (non-obese or lean, BMI <23.0 kg/m2), NAFLD was significantly associated with increased risk of cancer with the adjusted ORs (95% CIs) of 17.446 (1.690 to 180.095, p=0.016). But for those with overweight or obesity, NAFLD was not significantly associated with increased risk of cancer. Although we may not have enough power to evaluate the true associations of NAFLD for risk of all cancer in different BMI categories due to the small sample size, our findings for those patients with T2DM with underweight or normal weight did imply that non-obese or lean NAFLD was independently associated with excessive risk of cancer. But it should be noted that the interaction effects between NAFLD and BMI categories on risk of cancer was not statistically significant and therefore we could not rule out the possible effect of NAFLD on risk of cancer for those with overweight or obesity. To the best of our knowledge, we were probably the first to find the positive association of non-obese or lean NAFLD with risk of cancer for patients with T2DM. Our findings indicated that, even for those patients with T2DM with underweight or normal weight, screening of NAFLD and intervention to reduce liver content should be strengthened from the perspective of improving cancer prevention.
FIB-4 score was validated as a simple noninvasive index of hepatic fibrosis, and a cut-off of >3.25 was widely used to define advanced fibrosis.27 In the present study, FIB-4 score was not significantly associated with risk of cancer for all or stratified across different BMI categories. But we cannot exclude the possible effect of hepatic fibrosis on risk of cancer, since the average FIB-4 score was relatively lower and only 4 (1.7%) subjects were classified as advanced fibrosis due to the small sample size in the present study.
Obesity has well been documented to be associated with risks of NAFLD, T2DM and certain sites of cancer. But little evidence is available on association of obesity on the risk of all cancer in patients with T2DM independent of NAFLD. In the present study, we found that BMI (either continuous or categorical vales) was not significantly associated with risk of cancer with adjustment for potential confounding factors, including NAFLD. We further explored the associations of BMI categories with risk of cancer for patients with T2DM stratified by NAFLD and found that neither for patients with NAFLD nor for those without, BMI categories were not significantly associated with risk of all cancers. We cannot exclude the possible association between BMI and risk of cancer independent of NAFLD since we have not enough power due to the relatively small sample size, and we will further clarify it when the sample size of our ongoing cohort is big enough in future, especially from the prospective study design.
A few limitations of the present study should be recognized when generalizing our findings. First, all subjects in the present study were sampled from only one hospital in China, and their representativeness were quite limited. Second, our sample size was quite small, and only 19 (8.2%) and 4 (1.7%) patients were identified as having cancers or advanced hepatic fibrosis, respectively; therefore, we may not have enough power to determine their true associations, especially we could not rule out the possible effects of either obese NAFLD or hepatic fibrosis on risk of cancers. Third, the present analyses were based on the baseline information of our ongoing cohort study, therefore we cannot determine the temporal sequence among NAFLD and cancer. Last but not the least, NAFLD was determined by hepatic ultrasonography scanning in the present study, and we had only data on description of hepatic steatosis diagnoses but did not have data on more rigorous assessment of NAFLD. Therefore, future studies with more accurate and severities data on NAFLD are needed. On the other hand, we still have some strengths in the present study. For example, cancer was confirmed by patients’ medical records and were diagnosed by professional health workers previously. And we were probably the first to find the increased risk of non-obese or lean NAFLD on cancer in patients with T2DM which was independent of potential confounding factors, including indices of obesity.
Conclusions
The prevalence rate of cancer in those with NAFLD was significantly higher than those without in patients with T2DM. NAFLD, especially non-obese or lean NAFLD, were significantly associated with increased risk of cancer. Therefore, our findings implied that screening of NAFLD and intervention to reduce liver fat in patients with T2DM should be strengthened, even for those non-obese or lean patients with T2DM, from the perspective of cancer prevention.
Data availability statement
Data are available on reasonable request. Data are available from the corresponding author on reasonable request.
Ethics statements
Patient consent for publication
Ethics approval
This study was approved by Human Research Ethics Committee of the Zhongshan Hospital, Fudan University (Xiamen Branch) (number/ID: B2019-015). Participants gave informed consent to participate in the study before taking part.
Acknowledgments
We are grateful to all the patients for their participation.
References
Footnotes
NC and JZ contributed equally.
Contributors NC, JZ and ZL performed the statistical analysis and wrote the manuscript; JZ and KW participated in the data collection; XL contributed to discussion; NC, XL and ZL participated in the design of the study and edited the manuscript. XL and ZL are the guarantors of this work and, as such, had full access to all the data in the study and take responsibility for the integrity of the data and the accuracy of the data analysis.
Funding This study was supported by the grants from Guiding Project on Medicine & Health in Xiamen, China (No. 3502Z20209048) and National Key R&D Program of China (No. 2017YFC0907100).
Competing interests None declared.
Provenance and peer review Not commissioned; externally peer reviewed.