Article Text

Abstract
Objective We investigated the relationships of maternal circulating individual free fatty acids (FFA) with insulin resistance, insulin secretion and inflammatory biomarkers during mid-pregnancy.
Research design and methods The data were drawn from a prospective cohort of generally healthy pregnant women (n=1368, African-American 36%, Hispanic 48%, Caucasian 16%) in Camden, NJ. We quantitatively determined 11 FFAs, seven cytokine/adipokine, homeostatic model assessment of insulin resistance (HOMA-IR) and C-peptide levels from the fasting blood samples that were collected at 16 weeks of gestation. Multivariate analyses were performed along with separate analyses for each individual FFA.
Results High HOMA-IR (p<0.001) and C-peptide (p<0.0001) levels were positively associated with a twofold to fourfold increased risk for developing gestational diabetes mellitus (GDM). Negative relationships were found with specific FFAs (molecular percentage, palmitoleic, oleic, linolenic, myristic acids) and HOMA-IR and C-peptide levels (p<0.01 to p<0.0001). In contrast, palmitic, stearic, arachidonic, dihomo-γ-linolenic (DGLA) and docosahexaenoic acids were positively associated with HOMA-IR and C-peptide (p<0.01 to p<0.0001). The individual FFAs also predicted cytokine/adipokine levels. For example, women who had elevated DGLA (highest quartile) were twice as (adjusted OR 2.06, 95% CI 1.42 to 2.98) likely to have higher interleukin (IL)-8 (p<0.0001) levels. Conversely, women with high palmitoleic, oleic, and linolenic acid levels had reduced odds (≥2-fold, p<0.01 to p<0.001) for having higher IL-8, IL-6 or tumor necrosis factor-alpha levels.
Conclusion Our results suggest that maternal individual FFAs uniquely affect insulin resistance and secretion. The effects are either direct or indirect via modulation of the inflammatory response. Modifying the composition of FFAs may help in reducing the risk of GDM.
- free fatty acid(s)
- insulin resistance
- gestational diabetes mellitus
- inflammation
This is an open access article distributed in accordance with the Creative Commons Attribution Non Commercial (CC BY-NC 4.0) license, which permits others to distribute, remix, adapt, build upon this work non-commercially, and license their derivative works on different terms, provided the original work is properly cited, appropriate credit is given, any changes made indicated, and the use is non-commercial. See: http://creativecommons.org/licenses/by-nc/4.0/.
Statistics from Altmetric.com
Significance of this study
What is already known about this subject?
Previous studies were limited to the relation of total concentrations of free fatty acids (FFAs) with insulin resistance/secretion in pregnant women with and without gestational diabetes mellitus (GDM).
How specific individual FFAs are involved in the regulation of glucose homeostasis and modulate inflammatory response in normal pregnancy and in women prior to the diagnosis of GDM remains uncertain.
What are the new findings?
In this prospective and well characterized cohort of young pregnant women, we show that specific individual FFAs have strong, but opposite effects on insulin resistance and insulin secretion by mid-pregnancy.
Different associations between specific FFAs and inflammatory biomarkers (cytokine/adipokine) were also observed.
How might these results change the focus of research or clinical practice?
Our data suggest that individual FFAs have unique metabolic impacts in healthy pregnant women and in women prior to the diagnosis of GDM.
The recognition and modification of circulating FFAs composition could be important for reducing the risk of GDM and other pregnancy complications related to subclinical inflammation and insulin resistance.
Introduction
Resistance to the actions of insulin on glucose and fat metabolism has been observed in normal pregnancy, particularly during late gestation.1 2 Excessive insulin resistance (IR) and significant β-cell dysfunction are key components for the development of gestational diabetes mellitus (GDM).3–5 How IR develops during pregnancy is not fully understood. Circulating free fatty acids (FFA) have been recognized as one of the most important factors that contribute to IR and also alter insulin secretion.1 6 7 Previous studies by Boden and Chen demonstrated that experimentally created acute elevations in circulating total FFA concentration cause increases in IR in healthy non-pregnant subjects, and type 2 diabetes mellitus (T2DM) and in pregnant women with and without GDM.1 7 8 Elevated total FFA levels significantly increase insulin secretion in normal subjects, but not in T2DM and GDM; here insulin secretion is defective.1 6–8 Thus, the relationship of the individual FFAs, instead of total FFA, to IR and insulin secretion in human pregnancy needs further investigation.
Strong evidence indicates that chronic low-grade inflammation which is characterized by increased circulating cytokine levels is another key factor associated with IR.4 9 FFAs have emerged as an important link for explaining inflammatory-related conditions.10–12 Increased total FFA levels induced whole body proinflammatory responses and impaired endothelial function in non-pregnant healthy subjects.9 13 Supplementation with n-3 fatty acids (FA) in obese pregnant women resulted in decreased cytokine levels in both placenta and adipose tissues.14 Although in vitro studies have reported that individual FAs modulate the inflammatory response in cultured cells,15 16 results are equivocal. Whether maternal individual FFAs affect inflammatory cytokine levels differently in human pregnancy is not known.
The purpose of the present study was to examine the relationships of individual FFAs with measures of IR (homeostatic model assessment of insulin resistance, HOMA-IR), insulin secretion indicated by C-peptide level, and inflammatory biomarkers from the Camden Study, a well-characterized prospective cohort of generally healthy pregnant women at high risk of adverse maternal-fetal outcomes. We hypothesized that individual FFAs have (1) different relationships with IR and insulin secretion and (2) different associations with inflammatory cytokine/adipokine levels in human pregnancy.
Research design and methods
Study design and population
The data were collected as part of the Camden Study, a prospective cohort study of maternal nutrition and pregnancy outcome in young, generally healthy women residing in one of the poorest cities in the continental United States.17 18 The study was conducted in the Osborn Family Health Center at Our Lady of Lourdes Hospital in Camden, NJ. Informed written consent was obtained from each participant after explanation of the nature and purpose of the study.
Study participants were enrolled between October 1996 and June 2006 for prenatal care. A total of 3.5% of the women who had serious non-obstetric problems (eg, lupus, type 1 or 2 diabetes, seizure disorders, malignancies, acute or chronic liver disease, drug or alcohol abuse and psychiatric problems) were found not to be eligible at screening. Eighty percent of the patients who were eligible agreed to participate in this study. Of the 1703 pregnant women who had all measurements assayed, we also excluded participants who were diagnosed with pre-eclampsia (n=186) or delivered a preterm infant (n=149) since both conditions are potentially associated with metabolic disturbance and/or increased inflammation.19–21 Twenty-five women who were diagnosed with GDM and also had complication of pre-eclampsia (n=13) or preterm delivery (n=12) were not excluded. A final group of 1368 women were included in this analysis.
Data collection
Data of socioeconomic, demographic and lifestyle characteristics were obtained by interview at entry to care (13.4±5.2 weeks of gestation, mean±SD), and updated at 20 and 28 weeks of gestation. Ethnicity was self-defined. Gestational duration was assessed with an algorithm based on a participant’s last normal menstrual period confirmed or modified by early ultrasound. Body mass index (BMI) was computed based on self-reported pregravid weight and measured height at entry to prenatal care (kg/m2).
Diagnosis of GDM and definition of normal controls
The diagnosis of GDM was made by a two-step approach. Patients were initially screened by a 50 g oral glucose challenge test at the 24–28 weeks of gestation. A 100 g oral glucose tolerance test (OGTT) was performed on that subset of women exceeding the glucose threshold value (>140 mg/dL at 1 hour). The diagnostic criteria for GDM were based on the Carpenter/Coustan conversion as recommended by the American Diabetes Association.22 Participants with a normal glucose screen test were defined as controls.
Sample collection and analytical procedures
Fasting blood samples (>8 hours) collected at entry to care (15.8±5.2 weeks of gestation) were refrigerated and centrifuged at 4°C. The serum and plasma samples were aliquoted and stored at –70°C until assayed.
Measurement of FFAs
We measured the plasma concentration and relative abundance of 11 FFAs (myristic, palmitic, stearic, palmitoleic, oleic, linoleic, α-linolenic, dihomo-γ-linolenic (DGLA), arachidonic, eicosapentaenoic (EPA) and docosahexaenoic (DHA) acids). Total lipids were extracted by a modified Folch method and analyzed by gas chromatography/mass spectrometry (Agilent Technologies 5973 MS/6890 GC, Santa Clara, CA) as described previously.23 An internal standard heptadecanoic acid (C17:0) was added to each sample before the extraction of FAs to identify the FFA fraction from other lipid classes which was separated by thin layer chromatography. A nitroterephthalic acid-modified polyethylene glycol capillary column (ZB-FFAP, Phenomenex, Torrance, CA) was used. Peak retention times were identified by injecting known standards (Sigma-Aldrich, Louis, MO). The precision and reproducibility was monitored by the analysis of reinjection on the same samples and the samples from different batches.
The peak area of FFA was identified as the percentage of total area under the peaks and absolute concentration of FFA was quantified by multiplying each individual FFA in relative value (%) by the total FFA concentration (μmol/L) determined by an enzymatic assay kit (Wako Chemicals USA, Richmond, VA).
Assays of cytokine and adipokine
Cytokines (interleukin (IL)-6, IL-8, IL-10, tumor necrosis factor alpha (TNF-α) and granulocyte-macrophage colony-stimulating factor) and adipokines (adiponectin and resistin) were analyzed by two panels using the Luminex xMAP technology (Luminex, Austin, TX) on the MagPix system. Serum cytokine concentrations were determined by the human high sensitivity T-cell 5-plex magnetic bead panel and adipokines were determined by the human adipokine 2-plex magnetic bead panel (EMD Millipore, Billerica, MA). According to the manufacturing protocol, there was no or negligible cross-reactivity between the antibodies for an analyte and any of the other analytes in each of the panels. The average intracoefficient variation (CV) was 5.5% (range 4.6%–7.0%) and the average inter-CV was 11.2% (range 8.2%–13.2%) for cytokines. The intra-CV was 4.4% and 5.5%, the inter-CV was 10.1% and 11.3% for adiponectin and resistin, respectively. All analyses were performed according to the manufactures’ protocols and were done in duplicate. The concentrations were calculated from best fit standard curves generated from calibrators for each analyte in each assay by Milliplex Analyst V.5.1.
Parameters of glucose and insulin homeostasis
Fasting plasma glucose was measured with the glucose oxidase method (Sigma Diagnostics, St Louis, MO) on a Multiscan analyzer (BioTek, Winooski, VT). Serum insulin was determined by radioimmunoassay (RIA) using a kit with a specific antibody that cross-reacts only minimally (<0.2%) with proinsulin and has a high sensitivity (2 mU/mL or 12 pmol/L). Plasma C-peptide was determined by an RIA kit with high sensitivity (0.1 ng/mL or 0.033 nmol/L) and low cross activity to proinsulin (<4%) (Linco, St Charles, MO). The intra-CV and inter-CV were 3.3% and 6.1% for C-peptide, 4.9% and 7.2% for insulin, 3.3% and 5.3% for glucose. We used C-peptide concentration as an indicator of insulin secretion because it is cosecreted on an equimolar basis from the β-cell with insulin and is not extracted or metabolized by the liver.3 18 HOMA-IR was computed as index of IR.24 25
Dietary data
A 24 hours’ recall of the previous day’s diet was obtained at entry to care, week 20 and 28 gestation processed with databases from the Campbell Institute of Research and Technology (Campbell Soup Company) in Camden as described previously.23 The database generates data for more than 70 nutrients and 19 FAs using the US Department of Agriculture Nutrient Database for Standard Reference and the Continuing Survey of Food Intakes by Individuals. The mean of three 24-hour recalls was used to calculate the total daily intake of energy, carbohydrate, protein, total fat, individual FAs, saturated FA (SFA), monounsaturated FA and polyunsaturated FA (PUFA) accordingly.
Statistical analysis
Parametric statistics were calculated for the continuous variables, and χ2 tests for independence were used for the categorical variables. Log10 transformations were performed if the data were positively and highly skewed. Multiple linear regression analyses were used to examine the relationships of individual FFAs (expressed as molecular percentage, %) with the continuous outcome variables (HOMA-IR and C-peptide level). Separate regression models were employed to estimate the relationships of each of the independent variables with the outcome variables. The same types of analyses were also performed with the women who were diagnosed with GDM during later gestation and in normal controls (online supplementary tables 1 and 2). Multiple logistic regressions were performed to estimate the ORs and 95% confidence intervals (CI) for the elevated levels of the glucose metabolism parameters (≥median level) with GDM at entry (prior to the clinical diagnosis of GDM).
Supplemental material
We also conducted multiple polytomous logistic regression analyses to estimate the associations of the elevated individual FFAs with the cytokine/adipokine levels. This is an extension of traditional logistic regression in multiple levels of an outcome variable that are all adjusted so that the ORs are estimated in the same model. The frequency distributions of the FFAs (%) were divided into quartiles, and logistic regression was used to estimate the OR of high (top quartile) FFAs with cytokine/adipokine levels in each quartile using the lowest quartile as the reference category. The linear trends of specific FFAs across the quartiles of cytokine/adipokine were also tested.
In order to examine the relation between dietary and circulating FFAs, we correlated (Pearson’s r) plasma individual FFA (molecular %) with the corresponding dietary FA intake (as % of total fat intake) adjusted for energy intake.
All multivariable analyses were also conducted controlling for potential confounding variables which included maternal BMI, age, parity, cigarette smoking, and ethnicity. All of the levels of significance were two sided, and p<0.05 was considered to be the lowest level of acceptable statistical significance. All of the statistical analyses were performed with SAS V.9.4 (SAS Institute).
Results
The characteristics of the women at entry (~16 weeks’ gestation) are shown in table 1. As expected, women who developed GDM during late gestation were older and had higher pre-pregnant BMI (p<0.0001). There were more Hispanic and fewer African-American women in the GDM group (p<0.001). The mean gestational age at blood sampling, parity and cigarette smoking were not significantly different between the GDM women and normal controls (p>0.05 for each). The concentrations of fasting plasma glucose, C-peptide, serum insulin and HOMA-IR were significantly higher in the GDM women than in the normal controls (p<0.001 to p<0.0001 for each).
Characteristics of study participants
Further analysis by multiple logistic regressions showed that elevated (≥median entry level) glucose (≥4.38 mmol/L) (adjusted OR (AOR) 2.15, 95% CI 1.30 to 3.56), insulin (≥99.73 pmol/L, AOR 2.49, 95% CI 1.41 to 4.40), C-peptide (≥0.54 nmol/L, AOR 4.43, 95% CI 2.25 to 8.72) and HOMA-IR (≥2.75, AOR 2.71, 95% CI 1.51 to 4.86) were significantly associated with increased risk for the subsequent development of GDM (p<0.01 to p<0.0001 for each).
Individual FFAs with HOMA-IR and C-peptide
The HOMA-IR and C-peptide levels were regressed on the linear combination of the potential confounding variables (age, pre-pregnant BMI, cigarette smoking, ethnicity and parity) in multiple regression analyses. The estimated regression coefficients for the multiple models are presented in table 2. There were significant negative relationships of several individual FFAs with HOMA-IR (β coefficient was −0.666, –0.100, −1.317 and −0.309 for 1% increases in palmitoleic or oleic or α-linolenic or myristic acids, respectively, p<0.01 to p<0.0001 for each). Inverse relations were also found with respect to C-peptide (β coefficient was −0.457, –0.069, −0.984 and −0.211 ng/mL C-peptide for 1% increases in palmitoleic or oleic or α-linolenic or myristic acids, respectively, p<0.001 to p<0.0001 for each).
Association of individual FFAs with HOMA-IR and C-peptide concentration
In contrast, significant positive associations of several FFAs with HOMA-IR were observed (β coefficient was 0.065, 0.084, 0.778 and 0.269 for palmitic, stearic, DGLA, and arachidonic acids, respectively, p<0.001 to p<0.0001 for each); similar relationships were found with C-peptide (p<0.0001 for each). There was no significant association of linoleic acid and EPA with HOMA-IR. EPA and DHA were both positively related to C-peptide (p<0.001 and p<0.0001).
Separate analyses were performed for women who subsequently developed GDM and the normal controls. The results from the normal controls were identical to those for all participants (online supplementary table 1). Similar results were also found for the GDM women, but the magnitude of these relationships was not statistically significant (online supplementary table 2). The lack of significance most likely was probably attributable to the small sample size of GDM group.
The trends of relationships (positive and negative) between individual FFAs and HOMA-IR or C-peptide in non-GDM women who complicated with pre-eclampsia and preterm delivery are similar to those shown with GDM and non-GDM normal controls, but significant association was only found in palmitoleic acid (p<0.01) in women with preterm delivery; the association was significant in palmitoleic, oleic, α-linolenic and stearic acids in women with pre-eclampsia (p<0.05 to p<0.001, data not shown).
Individual FFAs and inflammatory biomarkers
A summary for the FFAs, which were consistently showing linear associations with at least two cytokines/adipokines, is presented in table 3. Elevated individual FFAs (the highest quartile vs other quartiles pooled) were associated with inflammatory biomarkers in opposite directions (p for trend <0.05 to <0.0001 for each). Significant negative relationships were found for myristic, palmitoleic, linolenic and oleic acids. For example, women with higher (highest quartile) palmitoleic acid levels relative to the other quartiles had a 2.7-fold significant decrease for having a high IL-8 level (highest quartile vs lowest quartile, 15.1% vs 31.4%, AOR was 0.36, 95% CI 0.24 to 0.55, p for trend <0.0001). For myristic acid, the AOR was 0.37 (95% CI 0.25 to 0.54). Similar results were found for the same group of FFAs with IL-6, TNF-α or resistin. Opposite relationships were found with respect to DGLA, palmitic acid and EPA (table 3). For example, having a high DGLA predicted a twofold increase in the odds of having a high IL-8 (AOR 2.06, 95% CI 1.42 to 2.98, p for trend <0.0001). However, no significant relationships of stearic, linoleic, and DHA with cytokine/adipokine levels were observed. Arachidonic acid was only associated with one marker of cytokine/adipokine, TNF-α (AOR 1.72, 95% CI 1.20 to 2.46), which is not listed in table 3.
Association of elevated individual FFAs (molecular percentage, %) with inflammatory biomarkers
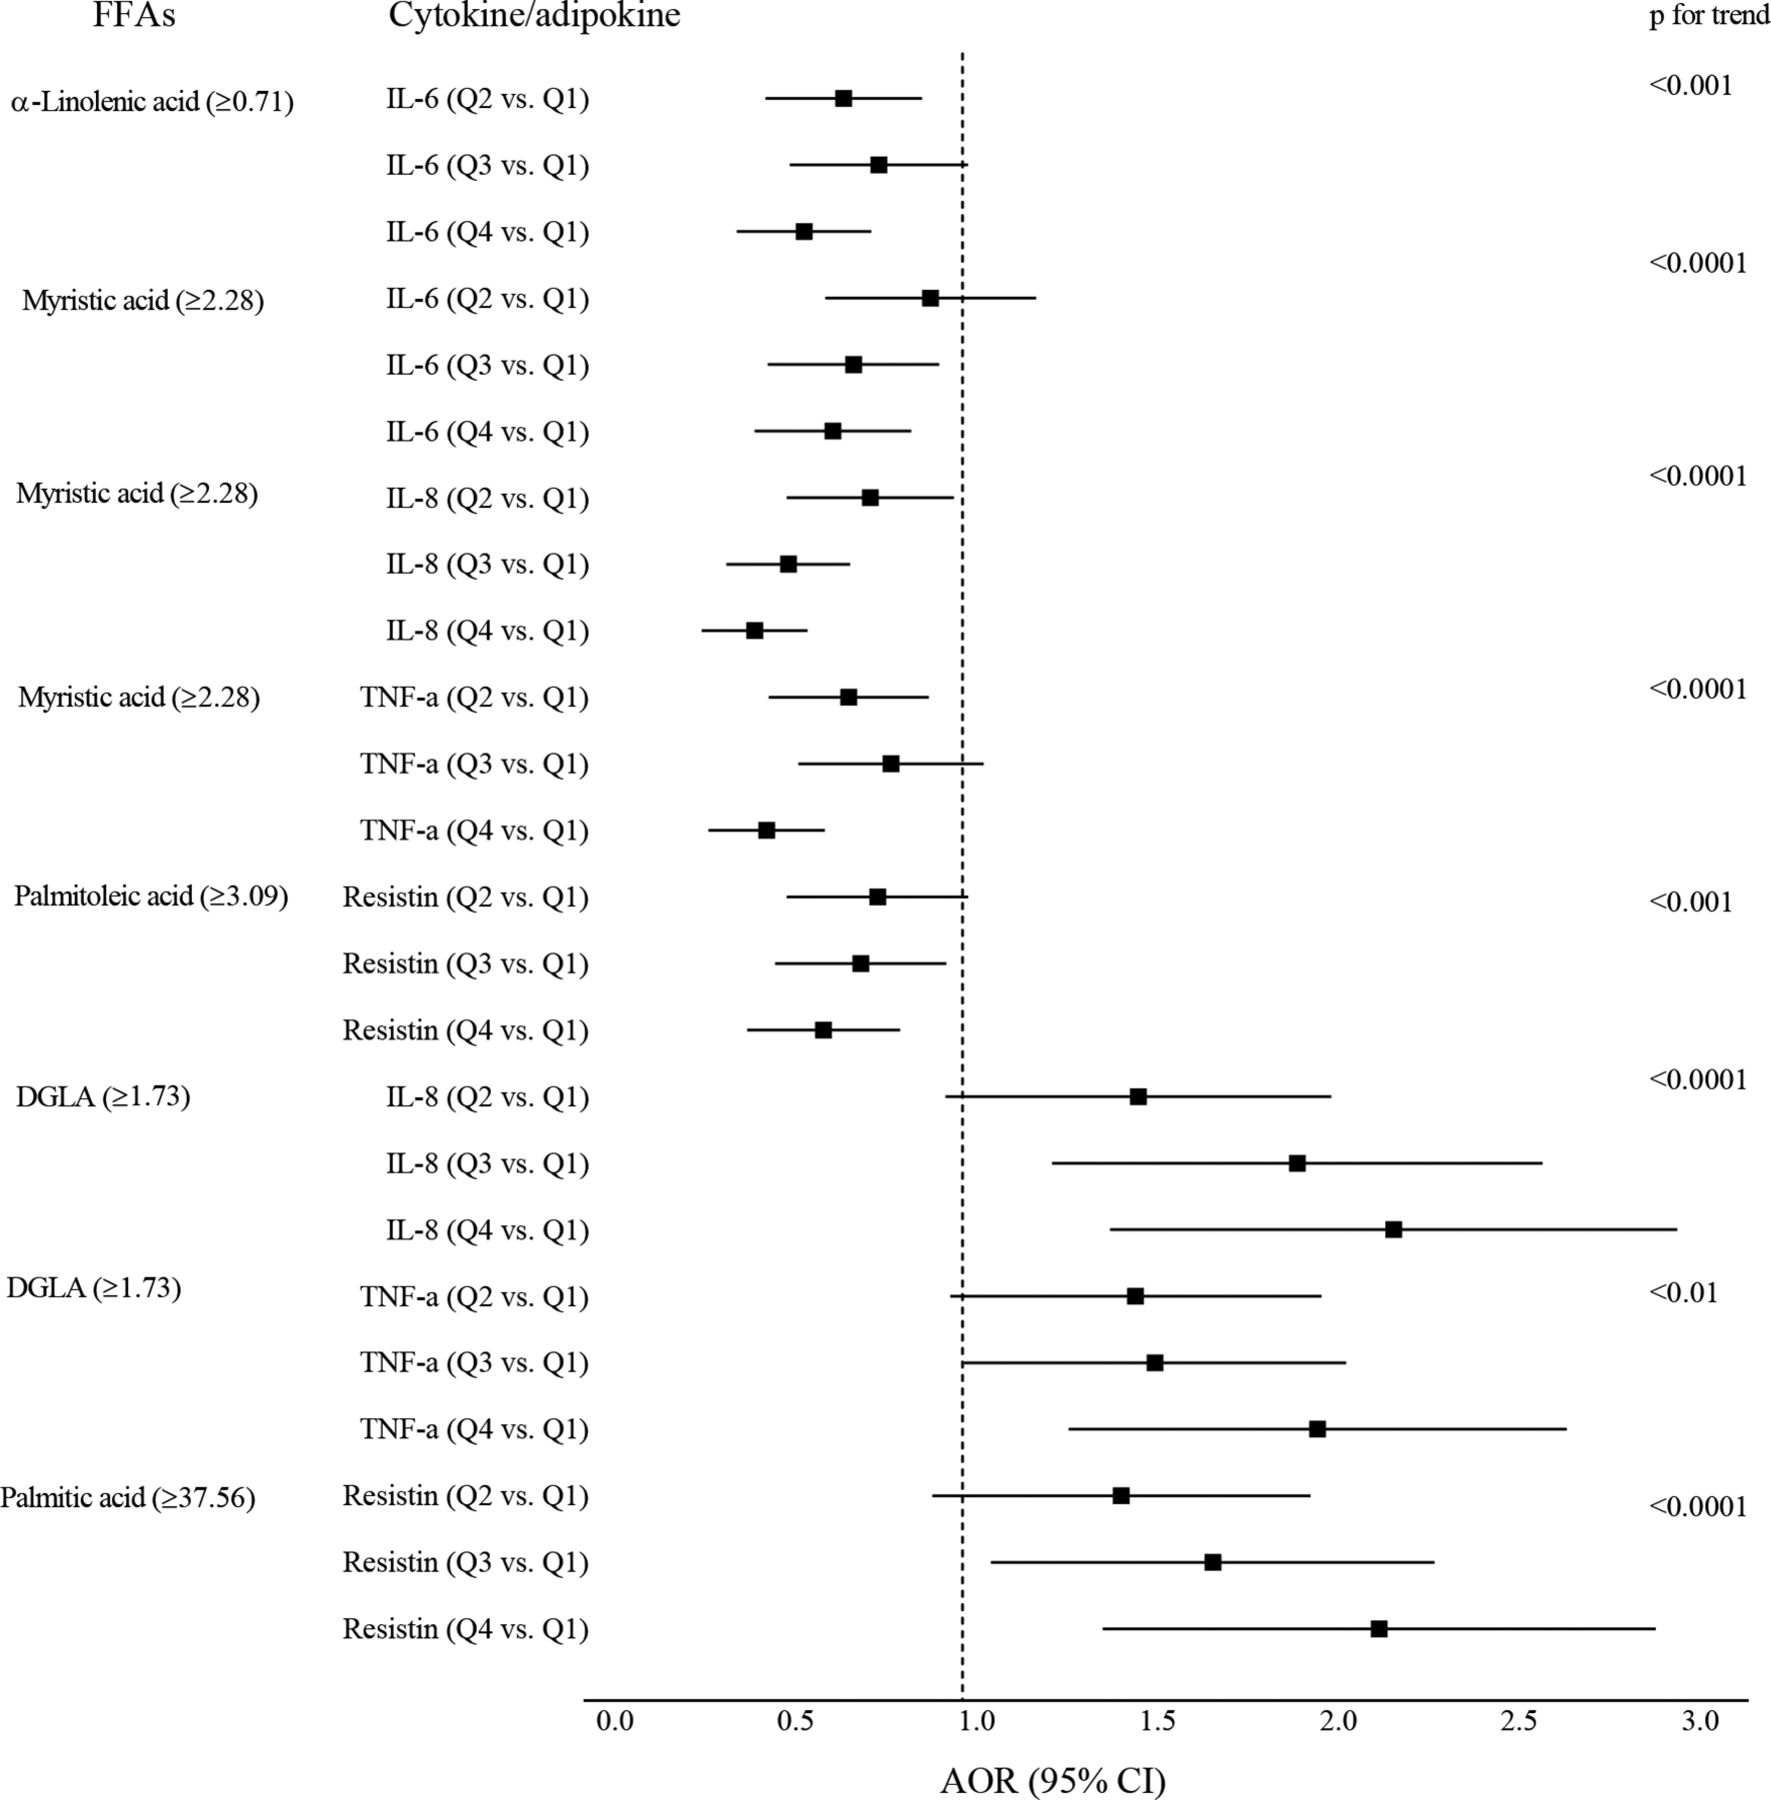
For the FFAs that had significant linear relationships with cytokine/adipokine levels, we compared the effect of higher FFAs on each of the quartile of cytokine/adipokine levels (using the lowest quartile as reference) (figure 1). For the negative associations of linolenic and myristic acids, there was a trend for decreasing AORs across the IL-6, IL-8 and TNF-α quartiles. For the positive associations of DGLA and palmitic acid, the AORs increased across the quartiles for IL-8, TNF-α, and resistin.

Linear associations of specific FFAs with inflammatory biomarkers. Square markers indicate adjusted ORs (AOR) which were estimated for patients who were in the highest quartile of FFA (vs other quartiles pooled), association with inflammatory biomarkers (comparing the quartiles 2–4 to the lowest quartile). Error bars indicate 95% CI. Models were adjusted for maternal age, pre-pregnant body mass index (BMI), parity, ethnicity and cigarette smoking. Separate models were performed for each FFA with each of the cytokines/adipokines. DGLA, dihomo-γ-linolenic acid; FFA, free fatty acid; IL, interleukin; TNF, tumor necrosis factor.
We did not observe any association of FFAs (in molecular percentage) to adiponectin. Adiponectin was inversely correlated with maternal pre-pregnant BMI (Pearson’s r=−0.283, p<0.0001), HOMA-IR (β coefficient −0.616, p<0.001) and C-peptide (β coefficient –0.567, p<0.0001). In addition, the adiponectin levels were negatively correlated with the absolute concentrations (μmol/L) of palmitic acid (p<0.0001), stearic acids (p<0.01), DGLA (p<0.05) and total FFA (p<0.01). Compared with the lowest quartile, the highest quartile of palmitic acid was associated with decreasing levels of adiponectin (AOR 0.66, 95% CI 0.46 to 0.94) when BMI was not controlled for. This finding was not significant after BMI was controlled for.
Individual FFAs and dietary fat intake
We correlated plasma individual FFA (molecular %) with the corresponding dietary FA intake (as % of total fat intake) adjusted for energy intake. Plasma myristic acid was minimally correlated with dietary intakes of myristic acid (r=0.100, p<0.0001), total fat (r=−0.07, p<0.05) and total PUFAs (r=−0.116, p<0.001). The correlations with other FAs were non-significant and negligible.
Conclusions
In this prospective cohort of young pregnant women, we have shown different associations of circulating individual FFAs with measurements of IR and secretion. Most importantly, opposite relationships between specific FFAs and inflammatory biomarkers (cytokine/adipokine) were also observed. The results indicate that individual FFAs have unique metabolic impacts by mid-pregnancy.
Markers identifying GDM risk
There has been a lack of consistency in the identification of markers that predict GDM.26–28 We found that higher HOMA-IR or C-peptide or insulin or glucose concentration determined at ~16 weeks’ gestation was associated with 2.7-fold to 4.4-fold increased risk for developing GDM independent of several traditional risk factors, including maternal age and BMI. Recently, in a secondary analysis of case–control study, Hinkle et al reported that elevated HbA1c levels at 8–13 weeks’ gestation were associated with GDM.26 Another study reported that HOMA-IR at week 7–12 gestation was associated with GDM.27 Thus, impaired glucose homeostasis seems to occur before the third trimester; our findings confirm that simple measurements may be useful for earlier identification of some women at risk for GDM.
Individual FFAs are associated with IR and insulin secretion differently
A particularly interesting finding in the present study was that specific individual fasting FFAs have large, but opposite effects on IR and C-peptide by mid-pregnancy (table 2). The strongest negative relationship was for the essential FA, α-linolenic acid, whereas DGLA, an endogenously produced n-6 FA, was one of the most positive correlates to HOMA-IR. Similar results were observed for the FFAs and C-peptide.
Previous studies were limited to the relation of total FFA concentration with IR/secretion. Elevation in plasma total FFAs by infusion of lipid and heparin in healthy subjects, patients with type 2 diabetes, or pregnant women with and without GDM caused IR by reducing insulin-stimulated glucose uptake.6–9 Increased total FFA level also has a role as an insulin secretagogue in patients with diabetes and healthy individuals.5 6 Our findings support FFAs having significant relationships with IR and insulin secretion, and indicate that individual FFAs are differentially associated with IR and insulin secretion.
FAs have an important role in the regulation of insulin homeostasis. In a prospective cohort of American Indians, Lemaitre et al have shown that higher plasma level of ceramides or higher sphingomyelins (the sphingolipids species) with SFAs, such as palmitic acid, have different associations with fasting insulin, HOMA-IR or HOMA β-cell function.25
We found that higher myristic acid, an SFA, was negatively correlated with having favorable relationships with both HOMA-IR and inflammation (tables 2 and 3). In non-pregnancy studies, serum myristic acid has positive or an unfavorable association with subclinical inflammation and with increased risk of T2DM.10 29 For unknown reasons, our results are contrary to previous observations in the literature. Additional studies are needed to understand the underlying mechanisms.
Individual FFAs are associated with inflammatory cytokine/adipokine differently
Another significant finding from the current study was that elevated individual FFAs were significantly associated with several major inflammatory markers, including IL-6, IL-8, and TNF-α and resistin, in different directions (table 3). Inflammation is a widely known contributor linked to increased IR.9 11 12 15 30 However, little is known about the effects of individual FFAs as modulators of inflammation during pregnancy.
Many studies have reported significant effects for total FFA levels and/or n-3 FAs in inflammation.9 14 31 Acute increases in total FFA concentrations induce intracellular and total cellular inflammation in healthy subjects.9 Supplementation of n-3 FAs (EPA and DHA) in non-pregnancies reduces blood levels of inflammatory markers.31 However, in obese pregnant women, supplementation of DHA and EPA significantly reduces the inflammatory response in maternal placental and adipose tissues, but plasma inflammatory markers do not show changes, except with respect to a reduction of C-reactive protein concentration (p<0.05).14 Thus, the effects of FAs on the inflammation are not always detectable in blood levels of inflammatory markers.
Likewise in our study, not all individual FFAs were associated with inflammatory biomarkers. It is generally believed that the n-3 FAs have anti-inflammatory and SFAs have proinflammatory properties.11 16 31 However, a recent study suggested that differences in chain lengths of individual SFAs had an opposite effect on inflammation.10 Currently, there are insufficient data in human studies to predict of which specific FAs will affect inflammatory status and how the effect can be detected.9 15 30 32 We observed strong relationships, particularly with several FFAs representing monounsaturated, n3, n6, and saturated FFAs, suggesting the unique impacts of FFAs on chronic inflammation during pregnancy.
Finally, we did not find significant relationships between FFAs (in %) and adiponectin. The association of adiponectin to several SFA concentrations was dependent on maternal BMI. Although adiponectin has a strong anti-inflammatory property and the concentration is decreased in GDM,33 34 the published results on its relationship with FFAs are mixed. A report from Spain studied 17 FAs (without known lipid class sources), and only found that palmitic acid and myristic acid were negatively correlated with adiponectin in non-pregnant women (p=0.02 and p=0.007).35 A significant inverse association between circulating adiponectin and plasma non-esterified FA or palmitic acid levels was found during an experimental elevation of intravascular triglyceride lipolysis in healthy men.34 In contrast, acute lowering of total FFA concentration pharmaceutically was associated with a decrease in the adiponectin level.36 Further studies are also needed to better understand the association of FFAs with adiponectin in pregnancies.
Strengths and limitations
Strengths of our study are a well-characterized large prospectively designed cohort including the measurements of indices of IR/secretion, inflammatory biomarkers as well as FFAs which have been validated and widely adopted in experimental and epidemiologic studies.3 8 9 24 25 There are some potential limitations. First, we included 25 women diagnosed with GDM and also complicated with either pre-eclampsia or preterm delivery because GDM is the focus of this study. We could have performed a separate analysis for GDM with and without pre-eclampsia or preterm delivery if the sample size was larger. Second, circulating FFA composition has been considered as a biomarker of fat intake, but the reports on their relationship have been inconsistent.37–40 We were unable to find strong relationships between plasma FFAs and dietary fat intake by 24 hours’ recalls. Plasma FFA levels are the end products of both exogenous (dietary fat intake) and metabolism endogenously (lipolysis, lipogenesis and oxidation), it is not feasible for our epidemiologic study to determine and distinguish the kinetics of fat metabolism. In addition, the time differences between blood sample collection and the assessment of dietary intakes could also contribute to the results. Lastly, we have used diagnostic criteria for GDM from the American Diabetes Association.22 By using the new criteria from the hyperglycemia and adverse pregnancy outcome (HAPO) can result in a significantly increased number of women diagnosed with GDM.41 42 The participants in our cohort were enrolled prior to HAPO study, we did not obtain data of a 75 g OGTT for all participants, and therefore, we are unable to detect additional cases of GDM. In the current study, our main focus is to examine the association of individual plasma FFAs with the cardiometabolic markers including inflammation, IR and secretion in women of normal pregnancy and with GDM. Our results suggested that individual FFAs have unique impacts on inflammation and glucose metabolism by mid-pregnancy.
In summary, our results found that individual FFAs are differentially associated with IR/secretion and inflammatory biomarkers. The findings suggest that specific FFAs play different roles in the regulation of glucose homeostasis in normal pregnancy and in women prior to the diagnosis of GDM. The effects are either direct or indirect depending on the modulating inflammatory response. Thus, the recognition and modification (possibly by dietary essential FA intake) of circulating FFA composition, especially the functional long-chain FFAs, is important for reducing the risk of GDM and other pregnancy complications related to subclinical inflammation and IR.
Acknowledgments
The authors thank the staff of the Osborn Family Health Center, Our Lady of Lourdes Hospital, for providing access to patients; Margaret D Schluter and Christine Hostetter for their outstanding technical assistance.
References
Footnotes
Presented at Part of data from this study was presented in abstract form at the American Diabetes Association (ADA) 78th Scientific Sessions, Orlando, FL, 22–26 June 2018.
Contributors XC designed the study, obtained funding and wrote the manuscript. TPS contributed to the laboratory method(s) and the quality of the free fatty acid measurements. RAS contributed to overseeing the statistical analyses of the data. TOS contributed to the design and obtained funding for the prospective cohort study. All authors participated in the interpretation of data and the writing, reviewing, editing of the manuscript and had the final responsibility for approving the submitted version of the manuscript. XC is the guarantor of this work and, as such, had full access to all data in the study and takes responsibility for the integrity of the data and the accuracy of the data analysis.
Funding This research was supported by the National Institute on Minority Health and Health Disparities grant (R01-MD007828 to XC) and the National Institute of Child Health and Human Development grant (HD038329 to TOS).
Competing interests None declared.
Patient consent for publication Not required.
Ethics approval The institutional review board at the University of Medicine and Dentistry of New Jersey (which later became Rowan University School of Osteopathic Medicine in 2013) approved the study’s protocol.
Provenance and peer review Not commissioned; externally peer reviewed.